Introduction
The balsam gall midge, Paradiplosis tumifex Gagné (Diptera: Cecidomyiidae), is a major Christmas tree pest throughout the range of balsam fir, Abies balsamea (Linnaeus) Miller, in North America. The Christmas tree industry is a multi-million-dollar business annually in eastern Canada, and consequently, P. tumifex has been the subject of intensive investigation (see Osgood et al. Reference Osgood, Bradbury and Drummond1992 for a review). Paradiplosis tumifex is a univoltine, needle-galling cecidomyiid. Adults fly from early May to early June in New Brunswick, Canada. Mated females disperse to the canopy to lay eggs on swollen or freshly burst buds of balsam fir. Egg hatch occurs after 2–3 days, and larvae move to individual needles to initiate gall formation (Osgood and Gagné Reference Osgood and Gagné1978). The mechanism responsible for gall initiation is unknown, but simple, single chambered prosoplasmic galls (described in West and Shorthouse Reference West and Shorthouse1982) become visible in mid-June. In early October, midges drop from needles to the duff layer where they overwinter as late-instar larvae (Osgood and Gagné Reference Osgood and Gagné1978). This “dropping” phase can last until late December, although the majority of midges exit the galls by the end of October (Osgood and Gagné Reference Osgood and Gagné1978). Most galled needles turn yellow and fall from the tree within one season (Lintner Reference Lintner1888; Giese and Benjamin Reference Giese and Benjamin1959), resulting in defoliation of the tree.
Numerous studies have investigated gall maker distribution within a host and attempted to define appropriate sampling units and monitoring plans (Fay and Whitham Reference Fay and Whitham1990; Fidgen et al. Reference Fidgen, Teerling and McKinnon1994; Strong and Bennett Reference Strong and Bennett2010). Previous research has quantified midge densities and to some extent within-tree distribution by P. tumifex (Giese and Benjamin Reference Giese and Benjamin1959) and measure mitigation techniques (Embree et al. Reference Embree, Estabrooks, Marks and Renault1985; Estabrooks et al. Reference Estabrooks, Kettela and Embree1985); however, a standard protocol for assessing gall-midge densities, which would form the basis of monitoring programmes and population dynamics studies, has yet to be established. Giese and Benjamin (Reference Giese and Benjamin1959) suggested a measurement survey and associated damage-level scale to help determine stand population levels based on percentage of infested twigs. However, this scale was based on the idea that midge infestations cannot be effectively mitigated through pesticide use or by other forms of management (Giese and Benjamin Reference Giese and Benjamin1959). Based on current practices employed by Christmas tree growers, this scale requires revision to allow more accurate assessments at the tree level. In their scale, Giese and Benjamin (Reference Giese and Benjamin1959) used “infested twig” (= shoots) as a measure of damage; however, even at low levels, infested twigs can have a wide range of galled needles. Aesthetically, it may be just as harmful for a tree to have a few shoots with a high percentage of needles galled as it is to have many shoots with relatively few needles per shoot galled. These variations in distribution of galls at low levels of infestation are not captured well by the Giese and Benjamin scale. Therefore, we sought to: (a) establish a suitable sampling unit for evaluating branch-level and tree-level galling by balsam fir gall midge across a range of tree heights and population densities, and (b) test hypotheses about some factors that might influence within-tree variation in gallmaker attack rates (i.e., crown level, shoot order, shoot length).
Materials and methods
Study site
We studied gall-midge infestation in three balsam fir Christmas tree stands located in McGivney, (46°20.425′N, 66°33.832′W), Chipman (46°15.941′N, 65°51.019′W), and Kilfoil (46°36.407′N, 67°37.186′W), New Brunswick, Canada. All sites were currently unmanaged in that they had received no shearing, weeding, fertilising, or other interventions for at least the previous year. Trees arose from natural regeneration. Stand sizes were 11.3 ha, 3.5 ha, and 3.3 ha in McGivney, Chipman, and Kilfoil, respectively. At the time of this study, McGivney had an established (3–4 years old) but moderate gall-midge infestation (∼20–40% defoliation), Chipman had been heavily infested for at least 3 years (∼80% defoliation in each of those years), and Kilfoil was experiencing a new infestation (light galling had been detected the previous fall, ∼5–15% defoliation). All other insect pests of balsam fir were at negligible levels.
Branch sampling
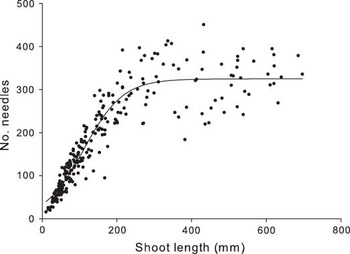
We conducted field surveys from 12 July through 9 September 2011, finishing just before larval drop. In each stand, we selected 30 trees from each of three height classes: 0–1 m, 1–2 m, and 2–3 m (measured from the soil to the base of the leader). Gall density was measured for a subset of shoots using a sampling method previously described by Piene (Reference Piene1989) and diagrammed by Johns et al. (Reference Johns, Ostaff and Quiring2006: p. 4; Fig. 1). Current-year shoots were classified as either first order (originating from the first-order main axis node), or second order (originating from the second-order node or second-order internode from the main axis). We evaluated galling only for shoots along the main axis of first-order and second-order shoots (when possible) of a branch in each of the lower, middle, and upper crown. Giese and Benjamin (Reference Giese and Benjamin1959) reported no significant influence of branch exposure, therefore we selected only south-facing branches. For each current-year shoot originating from the sample branch section, we measured shoot length and counted P. tumifex galls. In addition to our shoot samples, we selected ∼200 south-facing shoots from all crown levels throughout the range of available shoot lengths at McGivney (our moderate density site) and recorded shoot length and number of needles per shoot to establish their relationship. We used the resulting regression equation to estimate the number of needles per shoot on our branch samples and, ultimately, to express infestation as galls per needle (Fig. 1).
Relationship between shoot length and number of needles per shoot. The equation of the fitted line is y = 2E − 06x 3 − 0.0036x 2 + 1.9008x.

We combined gall and needle counts for all first-order and for all second-order shoots on each sampled branch, so as to use the sampled branch as our basic level of replication. We calculated intensity of gallmaker infestation for a branch by dividing the total number of galls by the (inferred) total number of available needles.
Statistical analyses
We began with site, height class, crown level, shoot order, and shoot length as variables potentially explaining variation in infestation. However, we were not able to conduct interpretable analyses of infestation considering shoot length and categorical variables simultaneously, because shoot-length distributions differed considerably across levels of the categorical variables. We dealt with this problem by first considering the categorical variables, which were of more direct interest to us because they are the variables on which sampling schemes might be based. Later, we conducted some simple heuristic analyses (see below) to determine whether differences in shoot length could be driving apparent influences of the categorical variables. We treated site, height class, and crown level as fixed effects (site is considered fixed because we deliberately chose sites with different levels of midge infestation).
Because few trees had second-order shoots at the top of the crown, our sampling design was necessarily an incomplete factorial. In order to simplify the analyses, we began with a four-way analysis of variance (ANOVA) including site, height class, crown level, and shoot order. In this analysis, gall density was slightly but significantly higher on first-order shoots, but no interactions involving branch order were significant (detailed results not reported here). As interpretation of other effects did not depend on branch order, we restricted subsequent analyses to first-order shoots. The remaining analysis was a fully factorial three-way ANOVA, in which we tested significance of main effects and all possible interactions using type III sums of squares. Because our measure of infestation did not conform to the ANOVA normality assumption, we evaluated significance of F-statistics by randomisation (Manly Reference Manly2006) using code written in R (R Development Core Team 2010). The randomisation analysis compares F-statistics based on the actual data to those based on data randomly permuted across levels of all factors (representing the null hypothesis that factor levels are uninformative). The randomisation approach reached conclusions identical to a conventional analysis; however, we report only the former.
Because average shoot lengths varied across levels of our categorical main effects, and because ovipositing insects often respond to shoot length, we used some simple heuristic analyses to assess the likelihood that the detected effects of site, height class, and crown level actually reflect underlying shoot-length differences. Our approach was to ask whether shoot length, considered alone, could explain infestation as well as the main effects; if (but only if) it could, then the main effect could have been generated by confounded shoot-length variation. We began by modelling the dependence of infestation rate on shoot length, ignoring all the main-effect factors, using a quadratic regression. We then compared the predictive power of the shoot-length regression (measured by its model r 2) to that of each main-effect factor considered alone (measured by the appropriate ANOVA model r 2). We did this both in simple analyses for each main-effect factor, pooling across all other factors, and in more complex analyses, fitting separate regression and ANOVA models for each value of the other factors (for instance, looking at the predictive power of crown level versus shoot length separately for each site or for each height class).
Finally, we assessed the suitability of a first-order, mid-crown shoot as a representative sampling unit for gall-midge infestation using regressions. We assessed the predictive power of three regressions: infestation calculated for the entire tree versus that calculated for the entire mid-crown branch; infestation calculated for the entire mid-crown branch versus that calculated for a first-order, mid-crown shoot; and infestation for the entire tree versus that for a first-order, mid-crown shoot. In each case, we report model r 2 and P-values, but we recognise that significance tests must be interpreted with caution here, because values to estimate infestation at the shoot level were also used to estimate branch-level infestation (and similarly for branch-level and tree-level estimates). We pooled data across sites for these regressions as we were interested in the ability of a single sampling scheme to work across spatial variation in environment and infestation levels.
Results
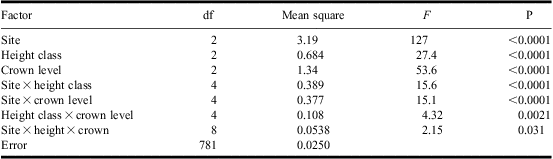
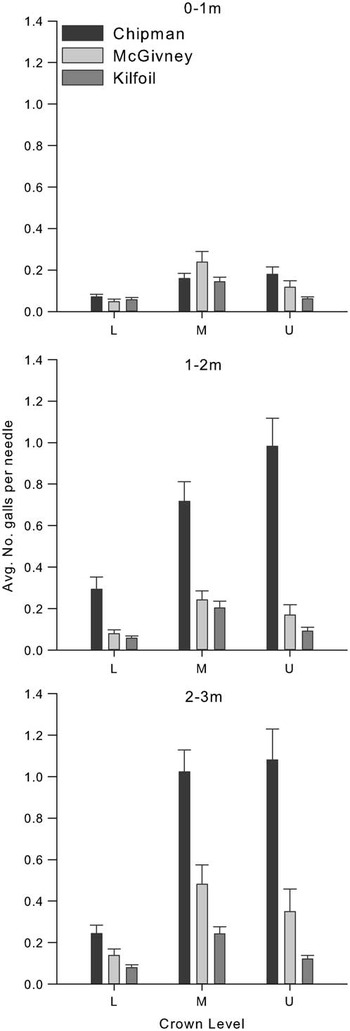
In our three-way analysis of infestation as a function of site, tree height class, and crown level, infestation depended significantly on all main effects and all interactions (Table 1). The largest variance component was associated with differences among sites, but both height class and crown level had considerable explanatory power, and each interaction also explained a significant amount of variance. Overall, infestation tended to be highest at Chipman (although for the smallest trees infestation was low and similar among sites) and in larger trees and in mid-crown and upper-crown branches (Fig. 2).
Effects of site, height class, and crown level on infestation by Paradiplosis tumifex for three Christmas tree stands in central New Brunswick, Canada, 2011.
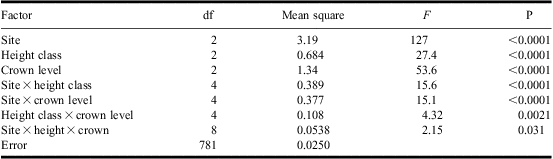
P-values determined by randomisation.
Average number of Paradiplosis tumifex galls per needle (±SE) in the lower, middle, or upper crown of 0–1 m, 1–2 m, and 2–3 m trees from three stands in central New Brunswick, Canada.

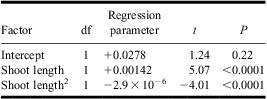
The quadratic dependence of infestation on shoot length was significant but weak for the pooled data set, with model r 2 = 0.039 (Table 2; Fig. 3). Regression r 2-values are of course somewhat larger for analyses broken down by levels of the main effects (detailed results not reported here), as such analyses implicitly remove main effects and shoot length by main effect interactions from the residual variance. Our heuristic analyses suggest that the difference in infestation rate among tree height classes could plausibly be driven by confounded variation in shoot length. Small trees are less infested, but have (on average) shorter shoots, below the apparent peak length for infestation (Fig. 3). For the pooled data set, shoot length predicted infestation just as well as height class (r 2 = 0.04 for either model), and r 2-values remain comparable in analyses broken down by site or crown level (results not shown). For crown level, variation in infestation rate could arise in part from confounded variation in shoot length, because low branches have low infestation rates and short shoots. However, for the pooled data, crown level has greater predictive power than shoot length (r 2 = 0.08 versus 0.04), and this difference is maintained when the data set is broken down by tree height class or site (results not shown). Therefore, crown level has at least some influence on infestation independent of shoot-length variation. Finally, variation in infestation among sites seems to have little to do with shoot length; Chipman and McGivney differ in infestation level but not in shoot length, whereas Kilfoil has the lowest infestation but the longest shoots. Unsurprisingly, then, site has far more predictive power than shoot length in the pooled data set (r 2 = 0.19 versus 0.04) and also in analyses broken down by height class and crown level (results not shown).
Quadratic fit of infestation level on shoot length across all sites, tree height classes, and crown levels.
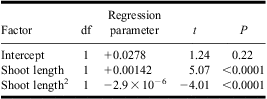
Model r 2 = 0.039.
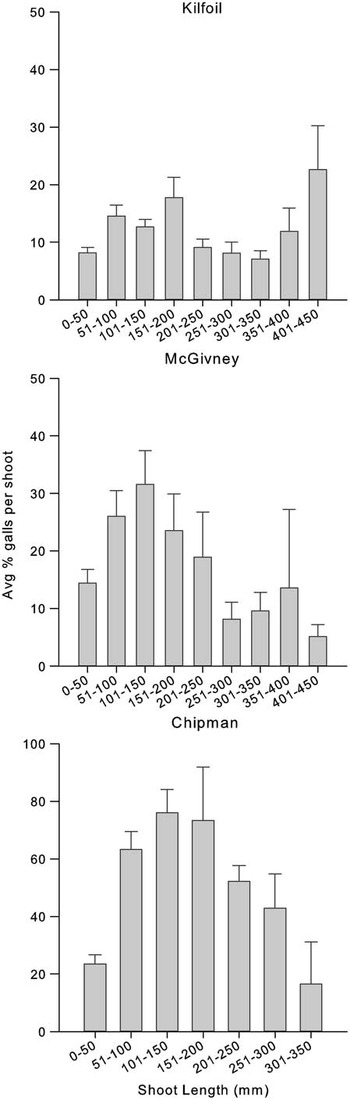
Influence of shoot length of balsam fir on average percentage galling (±SE) success by Paradiplosis tumifex. Shoot lengths are binned into nine length classes (0–450 mm in 50-mm increments) for ease of display, but all analyses used the original, continuous shoot-length data.

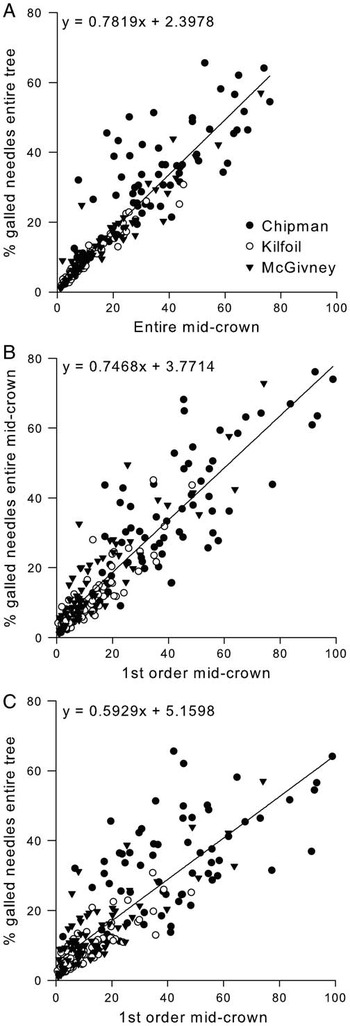
Gall density in the mid-crown branch explained 91% of the variance in gall density for whole trees (Fig. 4A) (P < 0.001). Galling at the first-order, mid-crown shoots explained 89% of variation in galling density for the whole branch (Fig. 4B) (P < 0.001) and 81% of the variation for the whole tree (Fig. 4C) (P < 0.001).
Relationships between average percentage Paradiplosis tumifex galling in (A) mid-crown shoots versus entire tree, (B) mid-crown first-order shoots versus entire mid-crown branch, and (C) first-order, mid-crown shoot versus entire tree.

Discussion
The dependence of P. tumifex infestation on site, height class, and crown level is highly complex and may involve covariation of shoot length with at least height class and crown level. As a result, patterns in infestation do not lend themselves to simple interpretation. This complexity motivates our efforts to provide a sampling unit that is a simple but reasonably accurate predictor of gallmaker impact at the whole-tree scale.
Our simple heuristic analyses suggest that, while variation in shoot length exists among sites, tree height classes, and crown levels, this confounded variation is not entirely responsible for the infestation patterns we report. Although we cannot clearly distinguish between effects of height class and shoot-length variation, infestation varies among crown levels, and especially among sites, in ways that cannot be driven only by shoot length. Further experiments are needed to understand the biological mechanisms underlying variation in P. tumifex infestation.
Mid-crown, first-order shoots provided a reliable estimate of infestation at the whole-tree level (Fig. 4), even at our Chipman site where the infestation crown-level pattern differed from the other two sites (Fig. 2). Thus, gall densities and subsequent defoliation for the entire tree can be estimated by sampling only first-order shoots on mid-crown branches, regardless of tree height or stand density. The establishment of a reliable sampling unit will aid in the development of a sequential sampling plan for rapid assessment of overall health in Christmas tree stands under midge attack (Giese and Benjamin Reference Giese and Benjamin1959). Perhaps as important, this improved sampling procedure will allow consistent tracking of the success of mitigation techniques.
Acknowledgements
We thank Rob Johns, Gaetan LeClair, Peter Mayo, Glen Forbes, and Andrew Morrison at Natural Resources Canada, Canadian Forest Service for technical and analytical support, as well as Blake Edwards and Katie Burgess for excellent technical assistance. Linley Jesson helped with randomisation analyses in R. We also thank two anonymous reviewers for their helpful comments. This research has been supported by InFor Inc.; Forest Protection Limited; Natural Resources Canada, Canadian Forest Service; and the Natural Sciences and Engineering Research Council of Canada (Discovery Grant to S.B.H.).