For most of the nineteenth century the United States exported raw materials and food (cotton and tobacco from the South and wheat and corn from the Midwest) and imported manufactured goods. One of the most controversial aspects of U.S. economic policy in the decades after the Civil War was the use of high import tariffs to protect domestic manufacturers (located mainly in the North) from foreign competition. Tariff advocates claimed that high import duties helped American workers by expanding industrial employment and keeping wages high, while also giving farmers a steady demand in the home market for the food and raw materials that they produced. Tariff critics charged that those import duties raised the cost of living for consumers and harmed agricultural producers by effectively taxing their exports, thus redistributing income from consumers and farmers to benefit big businesses and capital-owners in the North.
This protectionist trade policy was a contentious issue in American national politics during the Gilded Age of the 1880s. After post–Civil War reconstruction ended with the election compromise in 1877, tariff policy became the major source of partisan conflict: Republicans defended high protective tariffs and Democrats demanded that the tariff be used only to raise revenue. The election of 1888 hinged on the issue of tariff reform, and although the Democratic candidate (Grover Cleveland) won more popular votes, the Republican candidate (Benjamin Harrison) won the Electoral College, ensuring that the Republican policy of high tariffs remained intact.1
Reitano, Tariff Question, provides a recent historical overview of tariff politics during this period.
Despite this political controversy and the fact that import tariffs were among the most important government policies of the period, little research has been devoted to the overall economic consequences of late-nineteenth-century trade protection.2
DeLong, “Trade Policy,” provides a general discussion of trade policy during this period. Several industry studies examine the role of protection in promoting the iron and steel industry, such as Head, “Infant Industry Protection,” on steel rails; and Irwin, “Did Late-Nineteenth-Century Tariffs,” on tin plate, and “Could the United States Iron Industry,” on pig iron, but few papers focus on the economy-wide impact of the policy.
This article explores the incidence of U.S. tariff policy in the late nineteenth century by focusing on how the policy changed the domestic prices of traded goods relative to nontraded goods. A tariff increases the domestic price of importable goods relative to exportable goods, but this positive effect for import-competing industries is often mitigated by a tariff-induced increase in the price of nontradeable goods. The rise in the price of nontraded goods also reduces the relative price of exportables to the detriment of that sector. The results in this article suggest that higher prices of nontraded goods meant that the average 30 percent U.S. tariff on imports during the 1880s yielded about a 17 percent implicit subsidy to domestic import-competing producers and a 10 percent effective tax on exports. The tariff also redistributed a large share of national income (roughly 8 percent of GDP) among various affected groups, but the impact on consumers was only slightly negative because of the large share of exported products (particularly food) in consumer expenditures.
These findings help resolve several puzzles about late-nineteenth-century U.S. trade policy. First, the results explain why domestic manufacturers pressed for ever higher duties, even though nominal tariff rates were already very high. The reason could be that the effective subsidy to them was much smaller than suggested by nominal rates of protection. Second, the results confirm that tariffs were a highly charged political issue for good reason: they redistributed large amounts of income between various groups. In particular, about 30 to 40 percent of the burden of high tariffs fell on producers of agricultural exports, which helps account for the opposition of farmers to the existing levels of import taxation. Third, most voters may not have strongly opposed the protectionist policy because it proved to be only slightly harmful to consumers overall.
This article sets out the economic framework that underlies the concept of “net” protection in contrast to the more familiar concepts of nominal and effective rates of protection. The article then turns to the empirical relationship between the prices of traded and nontraded goods to assess the degree of protection (positive or negative) given to different sectors of the economy. The results also reveal the income transfers between various groups (consumers, exporters, import-competing producers, etc.) for 1879 and 1899. Finally, this framework is applied to the antebellum period to provide a contrast with the results from the late nineteenth century and to compare the results to other studies of the pre-Civil War period.3
Such as Harley, “Antebellum American Tariff.”
ASSESSING THE DEGREE OF TRADE PROTECTION
The degree to which an import-competing sector of the economy is protected from foreign competition is a deceptively complex question. The first step in addressing this question is to examine nominal rates of protection. In the late nineteenth century, import tariffs were the sole form of U.S. trade intervention (subsidies and quotas were not employed until later in the twentieth century). The nominal rates of protection are the rates of import duty as set by Congress and applied at the border by customs officials.
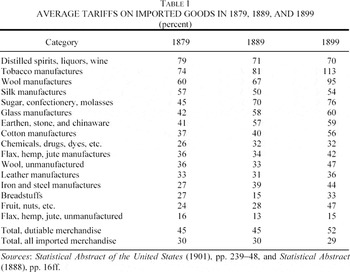
Table 1 shows the average import tariffs with respect to the major import-competing sectors of the economy in 1879, 1889, and 1899. Because the United States was a net exporter of agricultural goods and a net importer of manufactured goods for most of this period, tariffs were imposed mainly on imported manufactured goods and consumption items. The rates of most import duties were very stable over the period from 1870 to 1913. The average tariff on total imports was about 30 percent and the average tariff on dutiable imports was about 45 percent.4
U.S. Bureau of the Census, Historical Statistics, series U211–212

Nominal rates of protection do not necessarily indicate the actual degree of protection given to domestic producers. One problem with nominal rates is that they ignore the structure of protection across industries. The effective rate of protection, defined as the percentage change in value added in an activity as a result of the tariff structure, takes into account the impact of tariffs on intermediate and final goods in determining the degree to which producers of final goods are protected.5
Corden, Theory.
This tendency is evident in the late-nineteenth-century U.S. tariff code. As Table 1 indicates, tariffs on unprocessed raw materials (such as flax and wool) were set lower than duties on final manufactured goods. For example, the duty on unmanufactured wool was about 33 percent, whereas the duty on manufactured wool products was about 67 percent. According to G. R. Hawke's calculations, the effective rate of protection given to domestic wool manufacturers was 229 percent in 1889.6
Hawke, “United States Tariff.”
This is a general conclusion from numerous studies in the late 1960s and early 1970s. For a more recent discussion, see Anderson, “Effective Protection.”
A third measure of protection takes the price of nontraded goods as a numeraire against which one can determine the degree of assistance given to import-competing producers and the size of the burden placed upon export-oriented producers. The “net” or “true” rate of protection is defined as the proportionate change in the domestic price of importables relative to nontradeable goods.8
Corden (Theory, pp. 106ff) calls this measure “net” protection whereas Clements and Sjaastad (How Protection) call it “true” protection. See Greenaway and Milner, Trade, for a fuller discussion of the concept, which is often examined in the context of developing countries but has not, to my knowledge, been applied to the United States.
McDougall, “Tariffs”; Dornbusch, “Tariffs”; and Sjaastad, “Commercial Policy.”
To illustrate the concept, consider a small open economy that produces exportables, importables, and nontraded goods. The prices of the traded goods are determined on the world market (the terms of trade), but the prices of the nontraded goods depend on domestic supply and demand. (Thus, there are three relative prices, the terms of trade and the prices of exportables and importables in terms of the nontradeables.) The imposition of an import tariff raises the domestic price of importables relative to exportables and, initially, relative to nontraded goods as well. This higher price shifts resources into the production of importables and out of the production of exportables and nontradeables. It also shifts demand away from importables toward exportables and nontraded goods. The increased demand for and reduced supply of nontraded goods increases the price of nontraded goods in terms of exported goods and mitigates the increase in price of importables relative to nontraded goods.
These price changes are a necessary part of the international adjustment mechanism. An increase in the tariff reduces imports, leading to an incipient balance of trade surplus and excess demand for nontradeables. An appreciation of the real exchange rate (that is, an increase in the relative price of nontraded to traded goods) is required to restore balanced trade and eliminate the excess demand. Because of the higher price of nontradeables, the magnitude of protection given to domestic producers of import-competing goods is less than that indicated by the nominal tariff rate. In addition, producers of exportables face a decline in their price relative to that of nontradeables.
In this framework, the net or true rate of protection is defined as the proportionate change in the domestic price of importables relative to nontradeables. The tariff increases the domestic price of importables by (1 + t), where t is the ad valorem tariff rate, which in turn increases the domestic price of nontradeables by (1 + d), where d is the percentage increase in the price of nontraded goods. As a result, the net protection to the importables sector is

or

Similarly, the net subsidy to the exportables sector is

where s is the rate of export subsidy granted by the government. If s = 0, as in the late nineteenth century, then s* reduces to −d/(1 + d), which will be negative (i.e., an export tax).
For example, suppose that a 50 percent import tariff leads to a 20 percent increase in the price of nontraded goods. This means that the net subsidy to import-competing producers as a result of the tariff (as measured by the increase in the price of importables relative to nontraded goods) is 25 percent, while the net tax imposed on exporters (as measured by the decline in the price of exportables relative to nontradeables) is 17 percent. If the price of nontraded goods had risen by the full amount of the tariff, then the import-competing sector would have received no protection, as its relative price would not have increased.
As is often the case in tax policy, policy makers can choose the nominal rate of protection, but cannot directly control the incidence of the tariff because they cannot influence how much it drives up the price of nontraded goods. In terms of incidence, in the example just considered, only 60 percent of the nominal protection actually reaches import-competing producers as a subsidy, while 40 percent of the nominal protection falls on exporters as an effective export tax. Only if the tariff has no impact on nontraded goods prices will the nominal rate of protection translate into assistance of the same magnitude for import-competing producers.
Furthermore, the following equilibrium relationship can be shown to hold

where PN is the price of nontraded goods, PM is the price of importables, PX is the price of exportables, a ˆ indicates the proportion rate of change (e.g., ΔPX / PX). The incidence or shift parameter ω is a function of the compensated demand and supply price elasticities for nontradeables with respect to the three prices.
10Specifically, ω = (hDM − hSM) / (hSN − hDN), where hDi and hSi are the compensated demand and supply price elasticities for nontraded goods with respect to the price of import-competing goods and nontraded goods, in compliance with homogeneity restrictions. See Greenaway and Milner, Trade, pp. 120–21, for further details.
If import tariffs are the only form of trade intervention, such that there are no export subsidies and therefore ΔPX / PX = 0, then from equation 2 we have

Combining equations 1 and 2′ yields

In this equation, the net or true rate of protection hinges on the nominal rate of tariff protection (t) and the incidence parameter (ω). Because 0 ≤ ω ≤ 1, the nominal rate of protection overstates the true degree of protection (t ≥ t* ≥ 0). If ω = 0, then t* = t, but as ω approaches one, then t* approaches zero.
The incidence parameter ω also indicates the proportion of the tariff that is borne by exporters as an implicit export tax. Assuming again that there are no export subsidies, then combining equations 1′ and 2′ yields

If ω = 0, then the price of exportables in terms of nontradeables does not change and exporters do not suffer (i.e., s* = 0), but if ω > 0, then s* < 0. In the limit, if ω = 1, then the price of exportables relative to nontradeables falls by the full extent of the tariff and a nominal tariff of a given amount acts as an export tax of the same amount. Thus, if the tariff has a large impact on the price of nontraded goods, the tariff simultaneously yields a low level of protection for import-competing producers while imposing a great cost on exporters.
Figure 1 illustrates these relationships. The horizontal axis measures the relative price of exportables in terms of nontradeables (PX / PN) and the vertical axis measures the relative price of importables in terms of nontradeables (PM / PN). In the absence of any trade policy interventions, the domestic price of importables in terms of exportables (PM / PX) is given by the world market and is represented by the ray extending from the origin. The schedule HH indicates different combinations of prices of importables and exportables (relative to nontradeables) that clear the market for nontradeable goods. (If the price of importables goes up, then the price of exportables must go down to eliminate the excess demand for nontradeables.) The initial equilibrium is at A where the terms-of-trade ray intersects the HH schedule.

FIGURE 1 IMPORT TARIFFS AND RELATIVE PRICES
The imposition of an ad valorem import tariff of rate t increases the domestic price of importables relative to exportables, rotating the ray upward by the amount of the nominal tariff. The new equilibrium point is B, where this ray intersects the HH schedule. To remove the incipient tariff-induced trade surplus and accompanying excess demand for nontradeables, the price of nontraded goods increases by d percent. The price of exportables relative to nontradeables falls by 1 / (1 + d) while the price of importables relative to nontradeables increases by (1 + t) / (1 + d).
The magnitude of the increase in price of nontradeables is determined by the degree of substitutability between nontradeables and importables in production and consumption. If there is substitutability between nontraded and traded goods, then HH is negatively sloped.11
This figure illustrates the particular case when there is substitutability in production and consumption for traded and nontraded goods, but no such substitution between exportables and importables.
Alternatively, if exportables and nontradeable are close substitutes (ω = 0), the HH schedule is vertical, the price of nontradeables does not change, and the final equilibrium is at D. In this case, the nominal tariff equals the net or true protection given to import-competing producers. The price of exportables falls relative to importables, but not relative to nontraded goods.
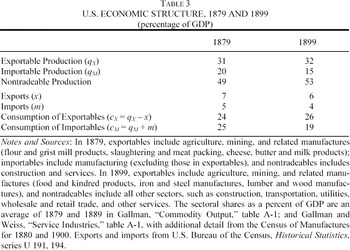
This framework is a useful way of thinking about the late-nineteenth-century American economy for several reasons. First, the U.S. economy at this time can be viewed as being composed of three sectors, producing agricultural goods (exportables), manufactured goods (importables), and nontraded goods (services). These sectors were roughly balanced in terms of size: in 1879, agriculture and mining accounted for 33 percent of GDP, manufacturing about 23 percent of GDP, and services roughly 44 percent of GDP.12
Gallman, “Commodity Output”; and Gallman and Weiss, “Service Industries.”
Second, the impact of protection in raising the price of nontraded goods and inflating the cost structure of the economy is not only commonly recognized today, but was frequently mentioned in the late nineteenth century. The imposition of high trade barriers to protect a large segment of the economy could not help but to have an impact on the nontraded sector of the economy as well. Many observers recognized that increased production in import-competing industries as a result of the tariff would create demands on resources that would increase production costs and thereby mitigate the gains to domestic producers of import-competing goods while adversely affecting exporters. The Special Commissioner for Revenue, David Wells, wrote in his first report that a high import tariff “will soon distribute itself throughout the whole community, and will eventually manifest itself and reappear in the shape of an increased price for all other forms of labor and commodities; thus aggravating the very evil which in the outset it was intended to remedy.”13
Wells, Report, p. 37.
Grosvenor, Does Protection, p. 359. Contemporary economists such as Taussig (“Wages”) described the various mechanisms by which high tariffs kept the level of U.S. wages and prices higher than they would otherwise be.
Third, changes in the real exchange rate were an important part of the international adjustment mechanism in the late nineteenth century. In response to a higher tariff, an alternative adjustment would be a nominal exchange rate appreciation, which would also lower the relative price of tradeables. For most of the late nineteenth century, however, the United States was on the gold standard and so nominal exchange rate changes were ruled out. Instead, changes in the domestic price level, i.e., the price of nontradeables, were required to remove the excess demand for nontraded goods and restore the trade balance to its previous level.15
For a recent study on commercial policy, the real exchange rate, and nontraded goods that uses an approach similar to the one in this article, see Devereux and Connolly, “Commercial Policy.”
MEASURING NET PROTECTION AND TARIFF INCIDENCE
Like the concepts of nominal and effective protection, the net or true rate of protection can be explored with some simple calculations. Because the incidence parameter ω is determined by a complex structure of substitution relationships, a common strategy is to estimate it indirectly by rearranging equation 2 as follows

and estimating

where ω is the elasticity of PN / PX with respect to PM / PX and ε is an error term. This regression relies on the fact that the terms of trade are determined by the world market whereas the prices of nontraded goods are endogenous.
16It is also equivalent to estimating log(PN)t = α + ω log(PM)t + (1 − ω) log(PX)t + εt.
This equation focuses on how changes in the relative price of imports (as depicted by a rotation of the ray in Figure 1) affect the relative price of nontradeables, but excludes anything that might change the price of domestic nontraded goods without necessarily changing the price of imports or exports. That is, it does not account for factors that might shift the HH schedule itself. A plausible shift variable for domestic prices (the HH schedule) is the domestic money stock, or currency held by the public, relative to nominal GDP. This is a measure of inflationary pressures, as changes in the money supply might bring about changes in domestic prices beyond those induced by changes in the prices of traded goods. Therefore, equation 5 can be modified as follows

where M is the domestic monetary stock relative to nominal GDP.
This method of estimating ω has the advantage of requiring only time series data on export and import prices, the price of nontradeables, and the money supply. Robert Lipsey calculates export and import prices starting in 1879, as presented in U.S. Bureau of the Census, Historical Statistics of the United States, series U-226 and U-238, and Matthew Simon reports a similar series back to 1865.17
Lipsey, Price; U.S. Bureau of the Census, Historical Statistics; and Simon, “United States Balance of Payments.”
Johnston and Williamson, “Annual Real and Nominal GDP”; and David and Solar, “Bicentenary Contribution.”
Johnston and Williamson, “Annual Real and Nominal GDP.”
One concern about this specification is that the results from a regression based on equation (5) or (5′) may be spurious if the relative price series are nonstationary. In results that are not reported, augmented Dickey-Fuller test statistics on the data series confirm that one cannot reject the hypothesis that log(PM / PX) and log(PN / PX) using either the GDP deflator or CPI have a unit root in levels (i.e., are nonstationary), while one can reject that hypothesis in first difference (i.e., the series are stationary when differenced). Estimation of equation (5) and (5′) in levels might be appropriate if the nonstationary series are cointegrated, i.e., that there is a long-run equilibrium relationship between the two such that a linear combination of them is stationary; otherwise, they should be estimated in first differences to ensure that the regressors are stationary.
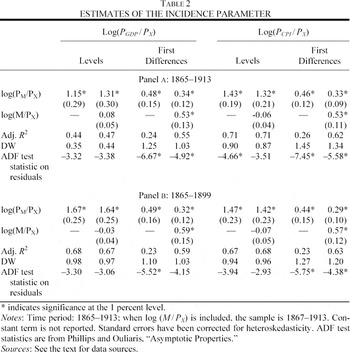
Table 2 presents regression results for equations (5) and (5′) in levels and first differences for the period 1865 to 1913 (in panel a) and 1865 to 1899 (in panel b). The results for the levels regressions suggest that log(PN / PX) and log(PM / PX) are not cointegrated. Using the approach of Robert Engle and Clive Granger, the augmented Dickey-Fuller test on the residuals of the levels regression indicates that the residuals are nonstationary and hence the levels results are not consistent and may be spurious.20
Engle and Granger, “Cointegration.”

In the first-difference regression, both the regressors and the residuals are stationary. In estimating equation 5 for the period 1865 to 1913 (panel a), both measures of nontraded goods prices produce similar point estimates of ω, 0.48 in the case of the GDP deflator and 0.46 in the case of the consumer price index. However, as noted before, these estimates may suffer from omitted variables bias because they do not account for possible changes in domestic prices that occur independently of changes in the prices of traded goods. Hence, results are also reported including log(M / PX) as in equation (5′), which appears to confirm the bias of the previous estimates. With the inclusion of this variable, the estimate of ω falls to 0.34 in the case of the GDP deflator and 0.33 in the case of the consumer price index, and the explanatory power of the regression improves considerably.
One concern with these estimates is that the structure of U.S. trade underwent a dramatic shift starting in the mid-1890s when the United States became a net exporter of manufactured goods. To ensure that the estimates of ω are not affected by this problem, panel b reports the same regression results for the period 1865 to 1899. Regardless of the general price index used, the estimates of ω are similar to those in panel a: about 0.46 in first regression and about 0.31 in the second regression controlling for inflationary pressures.
Thus, depending upon which specification is preferred, the high estimate of ω is about 0.45 and the low estimate of ω is about 0.32. With an average tariff on total imports of 30 percent, equation (2′) indicates that these duties would push up the price of nontradeables by 14 percent under the high estimate of ω and by 10 percent under the low estimate of ω. Is it plausible that import tariffs were at such a high level as to have raised the prices of nontraded goods by about 10 to 14 percent? Most accounts of this period put the level of U.S. prices as substantially higher than those in free-trade Britain. Marianne Ward and John Devereux report that the prices of services (housing, domestic service, and transportation) were roughly 25 percent higher in the United States than in Britain during the late nineteenth century, despite the similar income levels in the two countries.21
Ward and Devereux, “Measuring British Decline,” p. 832.
Williamson, “Evolution.”
Using equations 3 and 3′ results in estimates of ω that the nominal rate of protection of 30 percent translates into a 15 percent degree of net protection given to import-competing producers (manufacturing) and amounts to a 12 percent effective tax on exporters (agriculture) in the case of the high ω, and a 19 percent degree of net protection and 9 percent export tax in the case of the low ω. As expected, import tariffs were not nearly as protective as indicated by nominal or effective rates of protection and the burden imposed on the exportables sector was significant.
These results have implications that help explain several well-known features of the nineteenth-century debate over tariff policy. The advantages effectively gained by the import-competing producers, as compared to nontraded goods producers, were much lower than might be deduced from the nominal rates of protection. Just as agricultural subsidies in the twentieth century get capitalized into land values and the prices of other inputs, thereby raising farmers' costs, the import tariffs of the late nineteenth century put upward pressure on producers' costs by increasing nominal wages and the prices of nontraded goods. As a result, import-competing interests had an incentive to press for even higher tariffs to gain greater protection.23
Of course, import-competing interests always have an interest in higher tariffs, but the marginal benefit of higher tariffs may diminish after some point. If the net protection is much lower than the nominal protection, however, the high nominal protection may understate the incentives to seek higher tariffs. This phenomenon may account for the push by manufacturing interests for even higher rates of nominal protection in the McKinley tariff of 1890.
The results also indicate that exporters faced a substantial export tax, on the order of about 10 percent. The term ω indicates the fraction of protection that is borne by exporters; meaning that about 30 to 40 percent of whatever nominal import tariffs were imposed resulted in a higher price of nontraded goods with no compensating change in the price of exportable goods. Although the Constitution formally prohibited export taxes, agriculture faced a large, implicit export tax as a result of the import tariffs of the day. The implicit export tax hit a broad constituency because agricultural exports were quite diverse in the late nineteenth century, encompassing traditional staples such as cotton and tobacco produced in the South, as well as grains and meat products produced in many states across the Midwest. This feature of protection may account for the general opposition of midwestern farmers and Southern planters to the high level of the tariff.
The framework developed above can also reveal the income transfers associated with this incidence of protection.24
Clements and Sjaastad, How Protection; and Choi and Cumming, “Who Pays for Protection.” Although a fully specified, multisector computable general equilibrium model might yield more precise accounting of changes in income distribution, previous research has found that this framework yields findings similar to those more complex simulations without the detailed data requirements. See Choi and Cumming “Who Pays for Protection.”
Taken from Gallman, “Commodity Output”; and Gallman and Weiss, “Service Industries.” Some adjustments were made to these data. In 1879, exportables include agriculture, mining, and related manufactures (flour and grist mill products, slaughtering and meat packing, cheese, butter and milk products); importables include manufacturing (excluding those in exportables), and nontradeables include all other sectors (construction, transportation, utilities, wholesale and retail trade, and other services. In 1899, exportables include agriculture, mining, and related manufactures (food and kindred products, iron and steel manufactures, lumber and wood manufactures), and nontradeables include all other sectors. I thank Thomas Weiss for suggesting these adjustments.

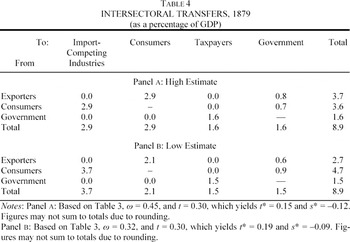
Table 4 presents an intersectoral transfer matrix that records the implied income transfers among five groups—import-competing producers, exporters, consumers, taxpayers, and the government—as a result of the tariff policy in 1879. The redistribution of income is calculated under the assumption of that the policy does not change total income and results are presented for the high and low estimates of the incidence parameter.26
The framework employed in this article is not equipped to examine the deadweight losses from the tariff policy. According to calculations in Irwin, “Trade Restrictiveness,” the static welfare loss from tariffs amounted to about 0.7 percent of GDP in the 1870s and 1880s and about 0.5 percent of GDP in the 1890s. Thus, the net welfare impact of tariffs was relatively small as a percentage of GDP, but the gross transfers were very large as a percentage of GDP.

The most interesting question addressed by the transfer matrix is whether consumers benefited or lost from protection. Consumers gain from the lower domestic price of exportables (by the amount ω t*cX / (1 − ω)) but lose from the higher domestic price of importables (by the amount t*cM). This gives rise to the “neoclassical ambiguity” of the standard specific factors trade model wherein the change in the real wage as a result of the tariff hinges on the weights of goods in the consumption bundle.27
See Ruffin and Jones, “Protection.”
The results here indicate that consumers lost income as a result of protection, but not a substantial amount. As the Table 4 indicates, consumers gained between 2.1 and 2.9 percent of GDP at the expense of exporters but paid 2.9 to 3.7 percent of GDP to import-competing producers (about 0.8 percent of GDP sent to the government in the form of tariff revenue is presumed to be returned to all consumers in a lump-sum payment). Thus, tariff protection cost consumers on net less than 1 percent of GDP. The reason import duties did not put a huge burden on consumers is that about 40 percent of consumption expenditures were devoted to food, and food accounted for more than half of U.S. exports in the mid-1880s. (After cotton, breadstuffs and meat were the largest categories of U.S. exports.) Although these products were important exports, most domestic production was consumed at home; for example, about three-quarters of the wheat crop was for domestic consumption. About 20 percent of consumer expenditures went to clothing, the major importable in the consumption bundle, and another 10 percent was devoted to tobacco manufactures and alcohol, both of which were imported to some degree.28
Various consumer expenditure surveys of the 1870s and 1880s indicate budget shares of about 42 percent for food, 10 percent for tobacco and alcohol, 18 percent for housing, 20 percent for clothing, and 10 percent for other items (Ward and Devereux, “Measuring British Decline,” p. 833).
Of course, either a different trade pattern or a different consumption pattern would have produced a different result in terms of the impact on consumers. Consumers in Britain, like those in the United States, devoted a large share of their expenditures to food, but British consumers had a strong interest in free trade because the country was a net food importer during the nineteenth century.
Even if the net effect of protection on consumers was negative, consumers-cum-taxpayers could have gained from protection on the assumption that all the revenues from import duties (some of which are paid by exporters, not just consumers) were returned to consumers as a lump-sum rebate or exchanged for lower domestic taxes financing public goods.30
This assumption does not, strictly speaking, hold because the revenues from the import duties were largely redistributed to specific groups, such as Civil War veterans in the North.
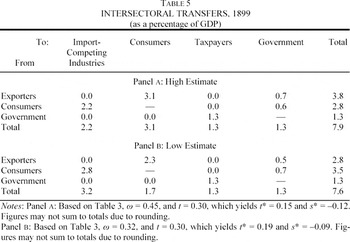
Table 5 presents the intersectoral transfer matrix for the year 1899. Due to structural changes in the economy, including the greater export orientation of U.S. manufacturers, the magnitude of the transfers in 1899 declined by a full percentage point of GDP compared with 1879. The implicit tax on exporters was roughly the same magnitude of GDP, but the transfers to import-competing industries fell from about 3.5 percent of GDP in 1879 to about 2.7 percent of GDP in 1899. Because of the declining transfers to import-competing industries and the bias in the structure of consumption toward exportables, consumers may have gained by protection in 1899 instead of losing as they had in 1879. However, the gain was very slight, only about 0.1 to 0.3 percent of GDP. Consumers-cum-taxpayers gained somewhat more from the policy of protection.

If the impact of tariffs on consumers as a broad class (and not in their role as producers) was roughly neutral by 1899, it would have been difficult to mobilize them to oppose the policy. In fact, in the 1888 presidential election fought largely over the tariff issue, the voting electorate was closely divided but slightly in favor of the tariff-reform candidate. The incumbent Democratic president, Grover Cleveland, who wanted to reduce tariff rates, received 48.6 percent of the vote, while his protariff Republican rival, Benjamin Harrison, received 47.8 percent of the vote. However, the geographic distribution of these votes ensured that Harrison won the electoral college by 233 to 168 and thus became president.31
See Reitano, “Tariff Question,” for a detailed study of the 1888 political debate over tariff policy.
As a check on the results in Tables 4 and 5, we can use other data to assess the validity of the magnitude of the transfers reported here. The most transparent transfer is from the government to taxpayers. In 1879, the federal government collected $137 million in customs revenue, about 1.4 percent of nominal GDP, and in 1899 the government collected $206 million in customs revenue, about 1.1 percent of nominal GDP.32
U.S. Bureau of the Census, Historical Statistics, series Y-352.
One important qualification suggests that these results may overstate the amount of redistribution brought about by the late-nineteenth-century tariffs. The magnitude of these transfers would be reduced if import tariffs significantly improved the terms of trade of the United States. It is unlikely that the estimates of the incidence parameter would be affected by tariff-induced terms-of-trade effects.33
As mentioned earlier in the article, U.S. tariffs did not change much over the course of the late nineteenth century, and the parameter is identified by movements in the terms of trade that are likely to be exogenous to the tariffs themselves.
AN ANTEBELLUM COMPARISON
Although this article has focused on the impact of the tariff in the late-nineteenth-century United States, this framework can also be used to shed some light on the antebellum period. Given the sharp political conflicts between the North and the South over tariff policy, the connections between the tariff and income distribution prior to the Civil War has long been of interest to economic historians. Clayne Pope, John James, and Harley all employed computable general equilibrium models of varying degrees of sophistication to examine the impact of the tariff prior to the Civil War (specifically, in 1859, in the cases of James and Harley).34
Pope, “Impact”; James, “Welfare Effects”; and Harley, “Antebellum American Tariff.”
An advantage of the net protection framework used in this article is that the data requirements and modeling assumptions are much less severe than in computable general equilibrium models, although the results are also much less detailed.
Most studies find much higher estimates of ω for countries where traditional exports dominate. In the late nineteenth century, the U.S. export bundle was a mix of traditional and nontraditional exports, and hence ω should be lower.
The results for the antebellum period will be presented very briefly. Export and import prices are from Douglass North, the money stock is from Peter Temin, the GDP deflator is taken from Johnston and Williamson, and the consumer price index is from David and Solar.37
North, Economic Growth. The money stock is from Temin, Jacksonian Economy; the GDP deflator is taken from Johnston and Williamson, “Annual Real and Nominal GDP”; and the consumer price index from David and Solar, “Bicentenary Contribution.”
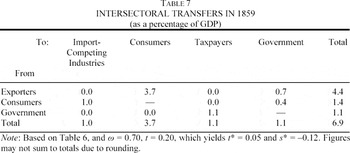
In the first-difference regressions, both the regressors and the residuals are stationary. In the first-difference estimate of equation 5′, the point estimates of ω are 0.65 (with a standard error of 0.06) using the GDP deflator and 0.78 (with a standard error of 0.08) using the consumer price index. Taking a rough estimate of ω as 0.70 along with an average tariff on all imports of 20 percent in late 1850s, equation 2′ indicates that this tariff would push up the price of nontradeables by 14 percent. This implies that the net protection given to import-competing producers (manufacturing) was just 5 percent and the effective tax on exporters (agriculture) was 12 percent. The higher estimate of ω implies a large impact on the price of nontraded goods and reaffirms Southerner complaints that the burden of the tariff was largely shifted onto Southern exporters through higher prices of importables and nontraded goods.
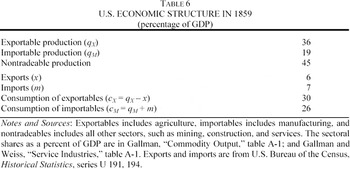
Table 6 presents the structure of the economy in 1859 and Table 7 presents the implied transfers.38
Due to the availability of greater data, previous work, such as that of Pope, James, and Harley, cited above, also focused on the late antebellum period even though the most contentious debates over the tariff were in the 1820s and early 1830s.
The most transparent transfer for which other data can be used to assess the validity of the transfer magnitudes is that from the government to taxpayers. Around 1850 the government collected about $40 to $50 million in tariff revenue, about 1.5 percent of GDP at that time, taking nominal GDP as about $2.4 billion (U.S. Bureau of the Census, Historical Statistics, series U-210). This is reasonably close to the 1.0 percent of GDP indicated in these calculations.


The Table 7 results can be compared with those in Harley's general equilibrium calculations.40
Harley, “Antebellum American Tariff,” tables 4 and 7.
Harley (“Antebellum American Tariff,” Table 4) calculates that the 1859 tariff entailed about a 0.5 percent deadweight loss of welfare; Irwin (“Trade Restrictiveness”) finds the deadweight loss to be about 0.2 percent of GDP.
CONCLUSIONS
This article examines the incidence of the tariff in the late-nineteenth-century United States and reaches four principle conclusions about some of the important features of American trade politics at that time.
First, although the nominal level of protection was very high to judge by legislated tariff rates, the net protection given to import-competing manufacturers was diminished by the tariff-induced increase in the price of nontraded goods. The calculations presented here suggest that the 30 percent average tariff on total imports resulted in net protection of about 17 percent for import-competing producers (manufacturers) and an export tax of roughly 10 percent on export-oriented producers (agriculture). This low level of net protection gave these manufacturers an ongoing incentive to press for higher duties to increase their level of support.
Second, the tariff redistributed substantial amounts of income—about 8 percent of GDP—among various producer groups and consumers. In addition, the burden of the tariff on exporters exceeded the benefits received by import-competing producers. The sizeable redistribution brought about by the protectionist trade policy justified its status as one of the most highly controversial issues in national politics during this period. Both the desirability and the efficiency of the transfers were leading political issues.
Third, the policy of tariff protection appears to have harmed consumers but have been roughly neutral with respect to consumers as taxpayers. Consumers did not bear an enormous burden from the high tariff rates because of the large weight of exportable goods (principally food) in domestic consumer expenditures. The political implication was that tariff opponents would not be able to generate much support for their position by appealing to consumer interests, and in fact the protariff Republicans dominated national politics for many decades after the Civil War.
Fourth, the burden of the tariff on the exportables sector was higher in the antebellum period than in the Gilded Age. Although the total transfers as a result of the tariff were lower in the antebellum period, the cost to the exportables sector was greater than in the postbellum period. Because the production of export crops was highly concentrated in the South, states such as South Carolina vehemently argued that the tariff was a sectional policy, making trade policy even more politically divisive than in the late nineteenth century.
The author wishes to thank Jeremy Atack, Robert Margo, Ken Sokoloff, Thomas Weiss, two referees, and seminar participants at the University of Warwick, Erasmus University, and the NBER's DAE Program Meeting for helpful comments.