1. Introduction
In the present work we combine two normally disparate branches of fluid mechanics: wall-bounded flow in the domain of fundamental fluid mechanics, and Langmuir circulation, a phenomenon associated with geophysical fluid mechanics and oceanography. The two have a key aspect in common: vortices. A number of studies have sought to introduce streamwise-aligned vortex pairs into boundary layer flow in order to manipulate it favourably. We propose that this can be achieved by a passive mechanism kinematically similar to a mechanism for Langmuir circulation, the relatively little studied ‘CL1’ mechanism. The ‘CL1’ mechanism requires mean shear and oblique pairs of waves; the former is present in a wall boundary layer, the latter can be generated by a criss-cross wave pattern in the wall itself. Langmuir circulation is normally associated with wind creating waves on the surface of lakes and oceans, although the mechanism itself necessitates neither wind nor surface waves.
We begin by reviewing the two hitherto disparate halves of the pertinent literature, pertaining to Langmuir circulation and designed vortices in a wall-bounded flow, respectively.
1.1. Background on Langmuir circulation
Cellular vortex structures identified by the presence of ‘windrows’ in open waters have come to be recognised as a central mechanism for the mixing of waters beneath the surface of the ocean and lakes, and, in particular, with the evolution of ocean thermoclines (Leibovich Reference Leibovich1983; Li, Zahariev & Garrett Reference Li, Zahariev and Garrett1995; Thorpe Reference Thorpe2004). Commonly known as Langmuir circulation (LC) in honour of the pioneering investigation by Langmuir (Reference Langmuir1938), they enhance mixing in part by their circulatory motion and also through the formation of downwelling jets that penetrate far deeper than the surface wave motion itself (Belcher etal. Reference Belcher, Grant, Hanley, Fox-Kemper, Van Roekel, Sullivan, Large, Brown, Hines and Calvert2012). However, the underlying mechanics driving them remained a mystery until Craik (Reference Craik1970) proposed a nonlinear kinematic interaction between surface waves and sub-surface mean shear.
Although greatly expanded upon over subsequent years by Craik and Leibovich (Craik & Leibovich Reference Craik and Leibovich1976; Craik Reference Craik1977; Leibovich Reference Leibovich1977; Craik Reference Craik1982b; Leibovich Reference Leibovich1983), Craik's paper demonstrated a fundamental resonance mechanism that acts, in combination with nonlinear Lagrangian transport or drift, to twist mean vortex lines in accordance to Helmholtz's vortex theorem. Of key importance is that it acts to redirect vorticity from the current, where it is spanwise, into the direction of the current (streamwise) after which it amalgamates to generate circular motions. The model proposed by Craik (Reference Craik1970) assumed a multidirectional wave field in combination with a unidirectional current. This interaction scenario is now commonly referred to as the ‘CL1’ mechanism, although it has antecedents in the Benny–Lin mechanism (Benney & Lin Reference Benney and Lin1960) that grows algebraically in time and is driven by the wave field. Further analysis of the CL equations developed by Craik & Leibovich (Reference Craik and Leibovich1976), highlighted a second instability mechanism to LC based on similar principles (Craik Reference Craik1977). This mechanism, termed ‘CL2’, comes about as a result of a positive feedback where vortex motion increases a spanwise unevenness in the current profile, and is now held to be the dominating Langmuir mechanism in the ocean (Thorpe Reference Thorpe2004).
However, although CL theory accounts for both CL1 and CL2, it assumes that the wave field is irrotational and that the current at the free surface is small compared with the phase speed of the waves (weak shear). If instead the current at the free surface is comparable to the phase speed of the waves (strong shear), then the wave field will be rotational and a far more powerful theory is required to describe the ensuing wave-mean interaction. Such a theory was developed by Andrews & McIntyre (Reference Andrews and McIntyre1978) who map (exactly) the Navier–Stokes equations into a Lagrangian mean reference frame to realise the generalized Lagrangian mean (GLM) equations. We mention these limiting cases because there exists a clear but imperfect analogy between conventional LC beneath a water surface, and a circulation phenomenon occurring above a rigid, wavy topography where no-slip at the wall replaces wind above the ocean surface to create the necessary mean shear near the boundary. ‘Imperfect’ because weak shear scaling that underlies CL theory as it describes LC of oceans and lakes does not carry over to wall boundary layers, where instead the shear is strong (Craik Reference Craik1982b). Imperfect also because although the weak and strong shear versions of the CL2 instability to LC presume shear and differential pseudomomentum (or drift) they have key differences. Specifically, while CL2 is wave driven and not subject to wave distortion, its strong shear counterpart is subject to wave distortion and is wave catalysed (Phillips & Wu Reference Phillips and Wu1994). This means that while the perturbation velocities that define the LC about the mean shear cannot exceed those of the orbital velocities of the wave field in weak shear, they can vastly exceed them in strong shear, which is why the strong shear version of the instability is sometimes denoted as CL2-O(1). Indeed, the streamwise velocity perturbation thus generated become strong enough to distort the primary flow field and modulate wave growth. There is then a two-way coupling between wave field and shear flow which increases the complexity of the problem.
Craik (Reference Craik1982b) utilised GLM to study the CL2-O(1) instability in uniform shear over rigid wavy walls, while Phillips & Wu (Reference Phillips and Wu1994) and Phillips & Shen (Reference Phillips and Shen1996) went on to explore a wide range of distributions of shear. The CL2-O(1) theory was also employed by Phillips, Wu & Lumley (Reference Phillips, Wu and Lumley1996) who sought to explain the observations by Gong, Taylor & Dörnbrack (Reference Gong, Taylor and Dörnbrack1996) of Langmuir vortices over hilly terrain and by Phillips (Reference Phillips2005) to explain the laboratory observations of LC beneath wind-driven surface waves by Melville, Shear & Veron (Reference Melville, Shear and Veron1998). Although these studies assume invisid flow, viscous dissipation is included in the general set of equations (Phillips Reference Phillips1998) derived from GLM to describe the evolution of LC arising in sheared flow subjected to finite amplitude rotational waves. While these equations can be used to study CL1-like instabilities, the focus of the work was the CL2 class and the derivation of a set of equations that capture it in all levels of shear, from weak, where they recover the CL equations, to moderate, which is applicable in shallow waters, to strong. These are known as the CLg equations (Phillips & Dai Reference Phillips and Dai2014).
In contrast little attention has been given to the CL1 class of instabilities and to our knowledge none to its forced excitation through constructional design. This forms the backdrop for the present study, where we will follow in the footsteps of Craik (Reference Craik1970) to demonstrate that the form and intensity of Langmuir vortices over wavy bounding walls provides a ‘direct-drive’ mechanism that is kinematically identical to CL1. We also utilise GLM to explore how wave distortion affects strongly sheared CL1-type circulation.
1.2. Vortices in wall-bounded flows
The mechanism we document suggests a new avenue to manipulate wall-bounded flows with the object of reducing drag. This is an attractive prospect, particularly considering that friction loss in flow transport networks accounts for approximately 10 % of the global electric energy consumption (Kühnen et al. Reference Kühnen, Song, Scarselli, Budanur, Riedl, Willis, Avila and Hof2018).
The topic, of course, is not new and dates from a seminal work by Bakewell & Lumley (Reference Bakewell and Lumley1967) who noted that skin friction drag appeared to be intimately associated with flow aligned coherent structures in the wall region. The structures were later found to be co-rotating vortices composed of rolls and streaks, the former defined by cross-stream velocity perturbations, the latter by axial flow perturbations (see, e.g. Deguchi & Hall Reference Deguchi and Hall2014); it was also found that a co-rotating vortex pair could join and lift from the surface to form a hairpin (Head & Bandyopadhyay Reference Head and Bandyopadhyay1981). More recent studies show that intentionally imposed near wall streaks and hairpins can stabilize the overall flow regime and delay or prevent transition into turbulence (Du & Karniadakis Reference Du and Karniadakis2000; Cossu & Brandt Reference Cossu and Brandt2002, Reference Cossu and Brandt2004; Fransson et al. Reference Fransson, Brandt, Talamelli and Cossu2005, Reference Fransson, Talamelli, Brandt and Cossu2006; Pujals, Cossu & Depardon Reference Pujals, Cossu and Depardon2010a; Pujals, Depardon & Cossu Reference Pujals, Depardon and Cossu2010b). Indeed, as much as 80 % of the turbulent drag can be traced back to streaks that undergo a rapid cycle of events where they occasionally rupture from the wall (an event known as a ‘burst’) causing the subsequent transport of fast-moving fluid back into the wall region (Corino & Brodkey Reference Corino and Brodkey1969; Offen & Kline Reference Offen and Kline1974).
Of course multiple methods have been explored to modify the wall flow in order to reduce drag. These include generating vortices or travelling waves (Auteri et al. Reference Auteri, Baron, Belan, Campanardi and Quadrio2010), imposing jets (Iuso et al. Reference Iuso, Onorato, Spazzini and Di Cicca2002) and blowing and suction (Lieu, Moarref & Jovanović Reference Lieu, Moarref and Jovanović2010). A large amount of literature also exists on employing specially designed surfaces to reduce drag, from streamwise-aligned groves called riblets, which act to control the spacing of wall vortices, to surface roughness motivated by biomimicry (Dean & Bhushan Reference Dean and Bhushan2010; Sirovich & Karlsson Reference Sirovich and Karlsson1997). Secondary vortex motion, aligned with the flow, can also be generated via spanwise intermittent roughness patches (Anderson et al. Reference Anderson, Barros, Christensen and Awasthi2015; Willingham et al. Reference Willingham, Anderson, Christensen and Barros2014) or streamwise-aligned obstacles (Yang & Anderson Reference Yang and Anderson2018; Vanderwel & Ganapathisubramani Reference Vanderwel and Ganapathisubramani2015; Kevin et al. Reference Kevin, Monty, Bai, Pathikonda, Nugroho, Barros, Christensen and Hutchins2017; Sirovich & Karlsson Reference Sirovich and Karlsson1997). Anderson et al. (Reference Anderson, Barros, Christensen and Awasthi2015) demonstrated that these structures are related to Prandtl's secondary flow of the second kind, driven and sustained by spatial gradients in the Reynolds-stress components. Accordingly, Chan et al. (Reference Chan, MacDonald, Chung, Hutchins and Ooi2015, Reference Chan, MacDonald, Chung, Hutchins and Ooi2018) studied turbulent flow over an ‘egg carton’ roughness configuration using direct numerical simulation, which can be seen as a special case of the wall geometry examined in the present paper. They too report circulation aligned with the flow attributed to Prandtl's secondary flow of the second kind. However, this is a dynamic mechanism, as opposed to LC, which is kinematic in nature. Here too we likewise plan to modify the wall surface, but not with roughness or groves but rather by making it wavy.
The paper is structured as follows. Governing equations are presented in § 2. A means for numerically computing a linearised solution for an arbitrary unperturbed shear current profile is given in § 3. The particular second-order interaction of harmonics responsible for the generation of LC are considered in § 4 and a solution for this motion derived in the limits of inviscid transient flow and viscous stationary flow. The computation procedure is summarized in § 4.3. Since GLM theory has been seen to be fruitful in the study of CL2-type instability, we utilise it in § 5 to explore the CL1-type mechanism and in the process rederive an equation previously derived in § 4. Results are given in § 6, where we first look at free surface flows in § 6.1 and then wall-bounded flows in § 6.2. Simulation results are presented in § 7 and a summary is provided in § 8.
2. Model equations
The model considered in this work applies to incompressible flows where, whenever a free surface is present, surface tension is ignored. The problem is readily converted to non-dimensional form using the depth or wall-to-wall distance  $h$ and surface current peak velocity
 $U_0$, as follows:
 \begin{align} (x,y,z) & \mapsto (x,y,z)h,\quad {\boldsymbol{k}}\mapsto {\boldsymbol{k}}/h,\quad t \mapsto th/U_0, \nonumber\\
\hat{\boldsymbol{u}}_\textrm{t} & \mapsto \hat{\boldsymbol{u}}_{t}U_0,\quad \hat p_\textrm{t} \mapsto \hat p_\textrm{t} \rho U_0^2. \end{align}
Here  ${\boldsymbol {k}}=(k_x,k_y)$ is the wavenumber in the surface plane,
 $\hat {\boldsymbol {u}}_\textrm {t}$ the fluid velocity and
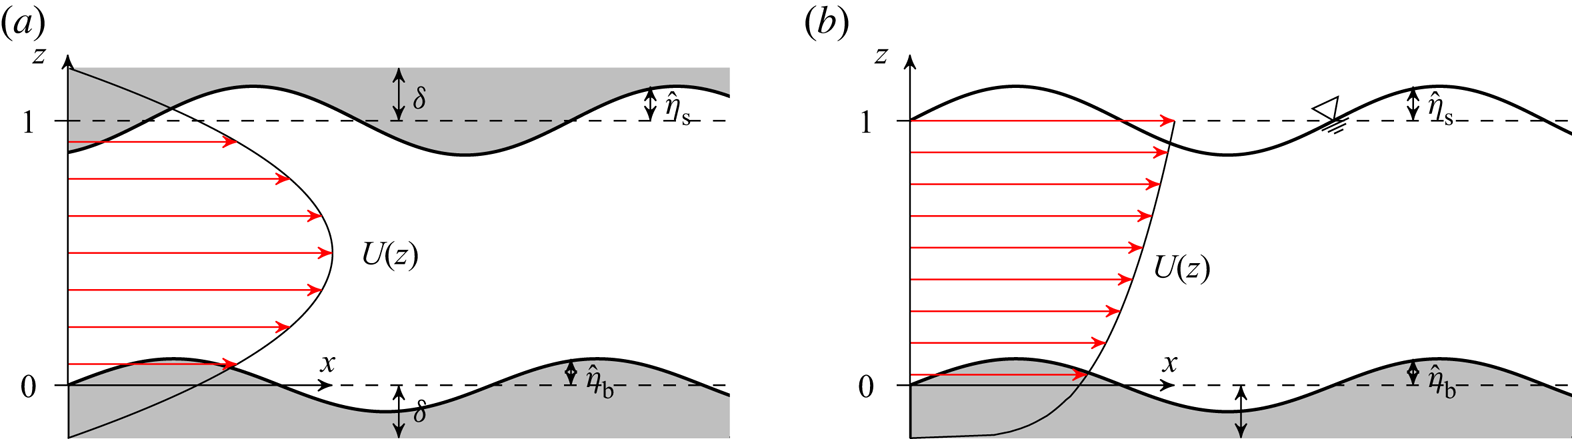
 $\hat p_\textrm {t}$ the pressure. Hatted quantities pertain to real space with the Fourier (wave vector) space counterparts written without hats. Flows over sinusoidally shaped boundaries of low steepness are in focus in the present study, as sketched in figure 1, yet any bathymetry shape can be analysed by superposition according to Fourier's theorem. A slip velocity is assumed at the two boundary reference planes
 $z=0$ and
 $1$, here achieved by stretching commonly used velocity profiles a displacement length
 $\delta$ such that the stagnation points of the bulk current
 $U(z)$ fall outside of the interior domain. Small undulations observed in streamlines near an actual corrugated wall can then approximately be modelled as the displaced wall sketched in figure 1. Crude as this approximation may appear in terms of boundary layers, it suffices for our purposes because the nature of the vortex mechanism to be studied is kinematic, not dynamic, and does not rely on wall friction (other than that needed for generating the principal shear). The boundaries, located at
 $z=\hat \eta _\textrm {b}(\boldsymbol {r})$ and
 $z=1+\hat \eta _\textrm {s}(\boldsymbol {r})$, perturb and redirect current energy to undulate the velocity field within. Here,
 $\boldsymbol {r}=(x,y)$ is the horizontal coordinate.
Sketch of the problem set-up. (Magnitudes of  $\eta _\textrm {s}$ and
 $\eta _\textrm {b}$ are exaggerated.) (a) Wall bounded and (b) free surface.

The problem to be solved consists of the Navier–Stokes equations, along with a kinematic condition at the boundaries:
 \begin{gather} \left.\begin{aligned} \left[ \frac{\partial \hat{\boldsymbol{u}}_\textrm{t}}{\partial t} \right] + ( \hat{\boldsymbol{u}}_\textrm{t} \boldsymbol{\cdot} \hat{\boldsymbol{\nabla}})\hat{\boldsymbol{u}}_\textrm{t} + \hat{\boldsymbol{\nabla}} \hat p_\textrm{t} & = \left[ Re^{-1} \hat\nabla^2\hat{\boldsymbol{u}} \right] - Fr^{-2} \boldsymbol{e}_z\\ \hat{\boldsymbol{\nabla}} \boldsymbol{\cdot} \hat{\boldsymbol{u}}_\textrm{t} & =0 \end{aligned}\right\};\quad \hat\eta_\textrm{b}(\boldsymbol{r}) \leq z\leq~1+\hat\eta_\textrm{s}(\boldsymbol{r}), \end{gather}
 \begin{gather}\hat{\boldsymbol{u}}_\textrm{t} \boldsymbol{\cdot} \hat{\boldsymbol{\nabla}} \hat\eta_\textrm{b} = \hat w;\quad z = \hat\eta_\textrm{b}(\boldsymbol{r}), \end{gather}
 \begin{gather}\hat{\boldsymbol{u}}_\textrm{t} \boldsymbol{\cdot} \hat{\boldsymbol{\nabla}} \hat\eta_\textrm{s} = \hat w;\quad z = 1+\hat\eta_\textrm{s}(\boldsymbol{r}), \end{gather}
with 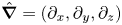 $\hat {\boldsymbol {\nabla }}=(\partial _x,\partial _y,\partial _z)$. The Froude number is
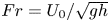 $Fr=U_0/\sqrt {g h}$ and
 $Re= U_0 h/\nu$ is the Reynolds number (
 $g$ being the gravitational acceleration and
 $\nu$ the kinetic eddy viscosity). The viscous and transient terms placed in square brackets are considered only in relation to the resonant second-order mode interaction—first-order solutions are assumed inviscid and at a steady state. When the upper surface is free,
 $\hat \eta$ is a function of the local flow and the inviscid dynamic boundary condition that pressure be constant at the surface is imposed.
3. Linearised solution
Assume that the motions attributed to the perturbed boundaries are small compared with the current velocity  $U(z)\,$. Separating these, we have
 \begin{gather} \hat{\boldsymbol{u}}_\textrm{t}(\boldsymbol{r},z)\, = \boldsymbol{U}(z) + \hat{\boldsymbol{u}}(\boldsymbol{r},z,t)\,; \quad \boldsymbol{U} = (U,0,0), \end{gather}
 \begin{gather}\hat p_\textrm{t}(\boldsymbol{r},z)\, = Fr^{-2}(1-z) + \hat p(\boldsymbol{r},z,t)\,. \end{gather}
A constant reference pressure term has been set to zero. A steady state of the first-order motion can be reached without the influence of viscosity. Assuming such a state has been reached and the Reynolds number is large, we neglect the transient and viscous terms in the first-order motion. (Note that viscous effects in the steady state are indirectly modelled via the shape of  $U(z)$.) Let the boundary topography
 $\hat \eta$ be described as a superposition of modes
 $\eta ({\boldsymbol {k}}){\textrm {e}}^{{\textrm {i}} {\boldsymbol {k}}\boldsymbol {\cdot }\boldsymbol {r}}$ (real when summed),
 $\eta \in \{\eta _\textrm {b},\eta _\textrm {s}\}$. The flow field
 $\{\hat {\boldsymbol {u}},\hat p\}(\boldsymbol {r},z)$ of the linear solution becomes a superposition of these wave modes
 $\{\boldsymbol {u},p\}({\boldsymbol {k}},z)$. After linearisation and insertion of (3.1), the linearised Euler equations read as
 \begin{gather} {\textrm{i}} k_x U \boldsymbol{u} + \boldsymbol{U}'(z) w +\boldsymbol{\nabla} p = 0, \end{gather}
 \begin{gather}\boldsymbol{\nabla}\boldsymbol{\cdot} \boldsymbol{u} = 0, \end{gather}
where  $\boldsymbol {\nabla }=({\textrm {i}} k_x,{\textrm {i}} k_y,\partial _z)$. Eliminating
 $u$,
 $v$ and
 $p$ then yields the Rayleigh equation
 \begin{equation} w''-{ \left( k^2+U''/U \right) }w = 0, \end{equation}
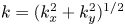 $k=(k_x^2+k_y^2)^{1/2}$.
The kinematic boundary conditions (2.2b) and (3.1b), linearised about the reference planes, read as
 \begin{gather} w(0) = {\textrm{i}} k_{x}U(0) \eta_\textrm{b}, \end{gather}
 \begin{gather}w(1) = {\textrm{i}} k_{x}U(1) \eta_\textrm{s}. \end{gather}
(We describe in Akselsen & Ellingsen (Reference Akselsen and Ellingsen2019a) a procedure for extending the lower boundary condition to bathymetries of finite amplitude, but we will here consider only the linear conditions.) If free surface flow is considered then the additional linear dynamic condition
 \begin{equation} \eta_\textrm{s} = Fr^{2} p(1)\, \end{equation}
governs the upper boundary, determining  $\eta _\textrm {s}$.
3.1. Numerical solutions for arbitrary current profiles
An arsenal of methods are at our disposal for evaluating the boundary value problem (3.3)–(3.5). For example, Phillips et al. (Reference Phillips, Wu and Lumley1996) adopted a Galerkin method at this stage. The problem (3.3)–(3.5) is, however, rather simple and so we rather opt for a simple shooting technique.
Writing the Rayleigh equation (3.3) in terms of the pressure and integrating once yields
 \begin{equation} p''-2\frac{U'}{U}p'-k^2 p = 0. \end{equation}
Next, substituting the vertical velocity component by the pressure component using (3.2a) with (3.4), the boundary conditions on  $p$ read as
 \begin{equation} p'(0) = [k_x U(0)]^2 \eta_\textrm{b},\quad \begin{cases} p'(1) = [k_x U(1)]^2 \eta_\textrm{s}; & \text{[fixed boundaries],}\\ p'(1)-[Fr\, k_x U(1)]^2 p(1) =0; & \text{[free surface].} \end{cases} \end{equation}
Equations (3.6) and (3.7) reveal that  $p$ is independent of the sign of
 $k_x$ and
 $k_y$ if
 $\eta$ is. The velocity components in terms of
 $p$ are
 \begin{equation} u =-\frac{p}{U} - \frac{U' p'}{k_x^2 U^2},\quad v = - \frac{k_y p}{k_x U},\quad w = \frac{{\textrm{i}} p'}{k_x U}. \end{equation}
Integration of (3.6) is performed numerically using a standard ordinary differential equation (ODE) solver and the guess for  $p(0)$ adjusted according to the error in (3.7). Computation time has never been found to exceed a second on a regular laptop computer, and the procedure yields
 $p(z)$ and its derivative, from which the velocity components are directly retrieved using (3.2a).
3.2. Analytical solution for a power-law current profile
Following Phillips & Shen (Reference Phillips and Shen1996) and Phillips et al. (Reference Phillips, Wu and Lumley1996), we now consider the particular family of power-law current profiles where  $U$ is proportional to
 $z$ raised to a power
 $q$. The power law allows for analytical solutions while representing a wide variety of primary flow profiles. We assume the free surface geometry of figure 1(b). Several forms of the commonly studied current profiles are obtained with different values of
 $q$; the uniform current most commonly considered is then recovered by setting
 $q$ to zero. A linear current profile is recovered when
 $q=1$. The linear profile has been investigated frequently in the literature since it is—in two dimensions—the only rotational flow for which potential theory is applicable. In the intermediate range
 $0<q<1$, concave-up profiles of the kind sketched in figure 1(b), resembling that observed in turbulent bottom boundary layer flows reside. A range of intermediate exponent values have over the years been suggested for turbulent flows (Chen Reference Chen1991; Cheng Reference Cheng2007). Flows with a surface shear layer may be modelled with
 $q > 1$, resulting in a class of concave-down profiles.
Akselsen & Ellingsen (Reference Akselsen and Ellingsen2019a) used a profile  $U=z^q$ with the
 $z$-axis defined so that the lower boundary reference plane was at
 $z=\delta$. This plane is in the current formalism located at
 $z=0$ and we instead stretch and shift the vertical axis:
 \begin{equation} U(z) = [\zeta(z)]^q,\quad \zeta(z) = \frac{z+\delta}{1+\delta};\quad [0\leq z\leq 1]. \end{equation}
Inserting (3.9a,b) and adopting the substitution 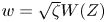 $w=\sqrt \zeta W(Z)$;
 $Z=k(z+\delta )$, the Rayleigh equation (3.3) is remoulded into the modified Bessel equation
 \begin{equation} W''(Z)+\frac{W'(Z)}{Z}-{ \left( 1+\frac{(1/2-q)^2}{Z^2} \right) }W(Z)=0 \end{equation}
whose two linearly independent homogeneous solutions are known. Written in terms of a generic flow variable  $\phi$, we have
 \begin{equation} \phi = \sum_\pm b^\pm \phi^\pm \end{equation}
with
 \begin{gather} w^\pm(z) = {\textrm{i}}\sqrt \zeta I_{\pm(q-1/2)}(\tilde k \zeta)\,, \end{gather}
 \begin{gather}p^\pm(z) = \frac{k_x}{k} \zeta^{q+1/2} I_{\pm(q+1/2)}(\tilde k \zeta)\,, \end{gather}
 \begin{gather}\boldsymbol{u}_{\textrm{h}}^\pm(z) = \frac{{\textrm{i}} q \zeta^{q-1} w^\pm \boldsymbol{e}_x-\tilde{\boldsymbol{k}} p^\pm}{\tilde k_x \zeta^q}, \end{gather}
where  $I_\alpha$ is the modified Bessel function of the first kind of order
 $\alpha$ and
 $\boldsymbol {u}_{\textrm {h}} = (u,v)$ is the horizontal velocity vector. A stretched wave vector
 $\tilde {\boldsymbol {k}} = {\boldsymbol {k}}(1+\delta )$ has also been introduced. The remaining constants
 $a^+$ and
 $a^-$ are determined by the two boundary conditions; (3.4) and (3.5) yield the relationships
 \begin{equation} b^\pm =\begin{cases} {\textrm{i}} k_{x} \dfrac{\eta_\textrm{s} w^\mp(0)-U(0) \eta_\textrm{b} w^\mp(1) }{ w^\pm(1)w^\mp(0) -w^\pm(0)w^\mp(1)}, & \text{ (fixed boundaries)},\\ {\textrm{i}} k_{x} U(0) \eta_\textrm{b} \left[ w^\pm(0) -\dfrac{w^\pm(1)\,-{\textrm{i}} k_x Fr^2 p^\pm(1)\,}{w^\mp(1)\, - {\textrm{i}} k_x Fr^2 p^\mp(1)\,}w^\mp(0) \right]^{-1}, & \text{ (free surface)}. \end{cases}\end{equation}
Further details on the analytical free surface solution is given in Akselsen & Ellingsen (Reference Akselsen and Ellingsen2019a).
4. The resonant second-order wave interaction
Similar to Craik (Reference Craik1970), we consider boundary undulations composed of a pair of sinusoidal waves directed symmetrically about the streamwise direction  $x$, i.e.
 \begin{equation} \hat\eta = \frac{a}{4}\left[{\textrm{e}}^{{\textrm{i}}( k_{1x} x + k_{1y} y)}+{\textrm{e}}^{{\textrm{i}}( k_{1x} x - k_{1y} y)} + \mathrm{c.c.} \right] =a\cos(k_{1x} x)\cos(k_{1y} y),\end{equation}
( $\eta \in \{\eta _\textrm {b},\eta _\textrm {s}\}$,
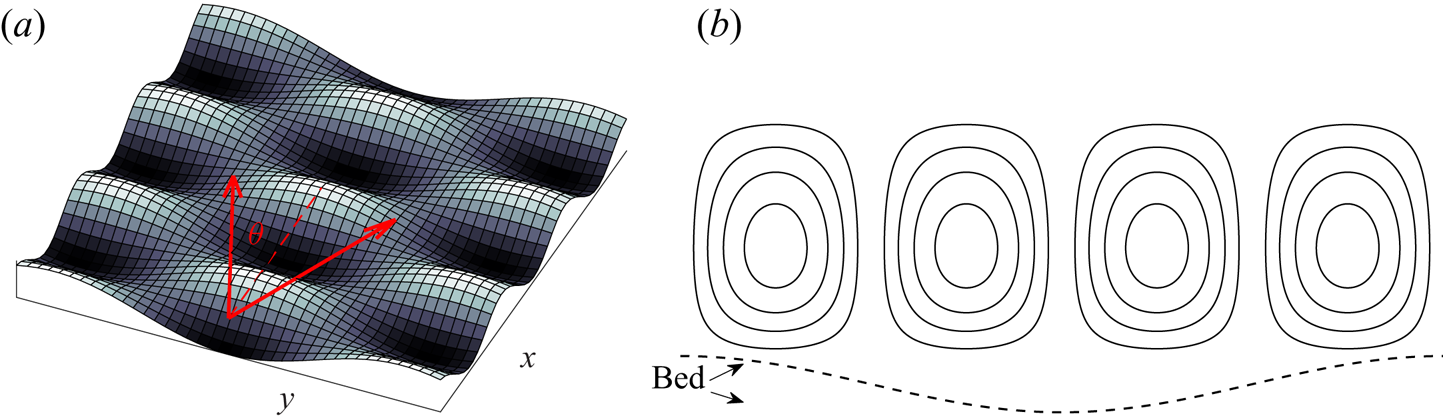
 $a\in \{a_\textrm {b},a_\textrm {s}\}$). An illustration is shown in figure 2. A free surface will to linear order also have the same functional form as the bathymetry, thus behaving kinematically similar to an undulated upper wall with the important difference that the mean current and secondary flow see this as a full-slip boundary. The first-order wave modes involved each have amplitudes
 $a/4$ and the four wave vectors
 $(\pm k_{1x},\pm k_{1y})$ (the sign of each component is varied independently). Second-order harmonics, in turn, have wave vectors
 $\boldsymbol {\kappa }$ which are sums of pairs of these. The harmonics thus come in four different types with wave vectors
 $\boldsymbol {\kappa }=\pm 2(k_{1x},k_{1y})$,
 $\boldsymbol {\kappa } = 0$,
 $\boldsymbol {\kappa } =(\pm 2k_{1x},0)$ and
 $\boldsymbol {\kappa } = (0,\pm 2k_{1y})$. The last type of harmonic is resonant—see Craik (Reference Craik1970) and Akselsen & Ellingsen (Reference Akselsen and Ellingsen2019b) for further details. The resonance will manifest in the formation of vortex pairs aligned in the current flow direction, as illustrated in figure 2.
Boundary topography and the orientation of vortices relative to it: (a) bottom topography with wave vectors  $(k_{1x},\pm k_{1y})$ indicated; (b) schematic illustration of swirling streamlines in the cross-flow plane.

From here we adopt  $\boldsymbol {u}$ and
 $p$ as the second-order components unless otherwise stated. The equations of motion for the second-order components of the Stokes expansion read as
 \begin{gather} (\partial_t-Re^{-1}\nabla^2)\boldsymbol{u} + \boldsymbol{U}' w + \boldsymbol{\nabla} p = -[(\boldsymbol{u}\boldsymbol{\cdot}\boldsymbol{\nabla})\boldsymbol{u}]_{1\times}, \end{gather}
 \begin{gather}\boldsymbol{\nabla} \boldsymbol{\cdot}\boldsymbol{u}=0 \end{gather}
for this particular interaction. Left-hand variables are second-order components while the right-hand cross terms are the second-order interactions of first-order components. Eliminating the horizontal velocity components and the pressure, the Orr–Sommerfeld equation for the second-order vertical velocity  $w(z,t;{\boldsymbol {k}}_1)$ becomes
 \begin{gather} (\partial_t-Re^{-1}\nabla^2)\nabla^2 w = \mathcal{R}(z)\,; \end{gather}
 \begin{gather}\mathcal{R} ={\textrm{i}} \boldsymbol{\kappa} \boldsymbol{\cdot} \partial_z [(\boldsymbol{u}\boldsymbol{\cdot}\boldsymbol{\nabla})\boldsymbol{u}_{\textrm{h}}]_{1\times} + \kappa^2 [(\boldsymbol{u}\boldsymbol{\cdot}\boldsymbol{\nabla}) w]_{1\times} \end{gather}
with 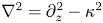 $\nabla ^2=\partial _z^2-\kappa ^2$,
 $\kappa =2|k_{1y}|$. Due to symmetry, we have
 $\boldsymbol {\nabla }=(0,{\textrm {i}}\kappa _y,\partial _z)$ and
 $[(\boldsymbol {u}\boldsymbol {\cdot }\boldsymbol {\nabla })u]_{1\times } = 0$ which simplifies the right-hand expression (4.4) significantly; using (3.8a,c) to express the first-order velocity component in terms of the first-order pressure, we find the remarkably simple expression
 \begin{equation} \mathcal{R}(z)= 8 \frac{k_{1y}^2}{k_{1x}^2}\frac{U'}{U^3} \left[ { \left( k_{1x}^2-k_{1y}^2 \right) }p_1^2 + (p_1')^2 \right]. \end{equation}
The first-order pressure mode  $p_1$ is the solution of (3.6)–(3.7) with
 ${\boldsymbol {k}}={\boldsymbol {k}}_1$. Note that the curvature term
 $(U''/U)w$ is not present in (4.3) because
 $\kappa _x = 0$, i.e. the resonant wave is two-dimensional and orthogonal to the shear current.
For arbitrary profiles, considered in § 3.1, the right-hand side of (4.3) is evaluated directly from the output of the ODE integrator. If the power-law profile (3.9a,b) is adopted (§ 3.2) then the right-hand side can be written explicitly as
 \begin{equation} \mathcal{R}(z) = 8 \frac{q k_{1y}^2 }{1+\delta} \sum_{s=\pm1}\frac{k_{1x}^2-sk_{1y}^2}{k_1^2} \left\{\sum_{\pm} b_1^{\pm} I_{\pm(q+s(1/2))} \big[k_1(z+\delta)\big]\right\}^2,\end{equation}
 $b_1^\pm$ and its velocity components are as given in (3.11)–(3.13) with
 ${\boldsymbol {k}}={\boldsymbol {k}}_1$.
The resonant second-order harmonic is uniform in  $x$ which allows for a streamfunction
 \begin{equation} \psi={\textrm{i}} w/\kappa_y \end{equation}
to be expressed in the  $yz$-plane. An expression for the pressure component is given in the appendix.
The resonant wave interactions will come with both signs  $\boldsymbol {\kappa }=(0,\kappa _y)=(0,\pm 2k_{1y})$, with the corresponding modes being complex conjugates of each other. It is therefore sufficient to consider only the positive spanwise wavenumber
 $\kappa _y=\kappa =2|k_{1y}|$ and write, for any flow variable
 $\hat \phi$,
 \begin{equation} \hat\phi = 2 \operatorname{Re}(\phi)\cos(\kappa y) - 2\operatorname{Im}(\phi) \sin(\kappa y).\end{equation}
The streamfunction  $\psi$ is purely imaginary when
 $\eta _\textrm {b}$ and
 $\eta _\textrm {s}$ are real. Contour plots of
 $-2\,\operatorname {Im}\,\psi$ are therefore presented among the results of § 6. When
 $-\operatorname {Im}\,\psi >0$, the vertical flow is directed in towards lines aligned with peaks and troughs in the wall topography, with the horizontal velocity perturbation
 $\hat u$ being strongest along these lines. This serves to increasingly tilt vortex particle trajectories in the
 $xy$-plane with time. Vortex rotation is in the opposite direction when
 $-\operatorname {Im}\,\psi <0$.
In what follows, two limits of (4.3) shall be investigated, namely the inviscid transient problem  $Re^{-1} = 0$ and the viscous steady-state problem
 $\partial _t\boldsymbol {\cdot } \rightarrow 0$.
4.1. Inviscid transient problem
We now set  $Re^{-1} = 0$. Because the harmonic in question is resonant it will not reach a time-independent state without the intervention of viscosity or nonlinear dynamics. The solution of (4.3) can be obtained using the method of variation of parameters which results in
 \begin{equation} w = \sum_\pm d^\pm {\textrm{e}}^{\pm \kappa z} + w_{\times}(z)\,;\quad w_{\times}(z)\, = \frac{t}{\kappa} \int_0^z \textrm{d} \xi\mathcal{R}(\xi)\, \sinh \kappa (z-\xi). \end{equation}
We have here imposed circulation quiescence at  $t=0$. The function
 $w_{\times }(z)$ is evaluated at all
 $z$ with simple numerical integration.
The second-order boundary conditions for fixed wall boundaries, Taylor expanded about  $z=0$ and
 $z=1$, reduce to
 \begin{equation} w(0,t) = w(1,t) = 0. \end{equation}
A little more caution is required for a free surface boundary; kinematic and dynamic conditions then reduce to
 \[ \partial_t \eta_\textrm{s}-w =0;\quad Fr^2 p -\eta_\textrm{b} = Fr^4 p_1 p_1',\quad [z=1]. \]
Combining these with the  $y$-component of the second-order momentum equation (4.2a) and the continuity equation (4.2b) yield
 \begin{equation} \partial_t^2\partial_z w +\kappa_y^2 Fr^{-2}w = 0,\quad [z=1]. \end{equation}
Vertical velocity  $w$ is only linear in time so that the boundary conditions become (4.10) also at a free surface. Fixing the integration constants of (4.9a,b), our inviscid solution reads as
 \begin{equation} w = w_{\times}(z)\, - w_{\times}(1)\frac{\sinh\kappa z}{\sinh \kappa}. \end{equation}
The streamwise velocity component  $u$ is retrieved directly from inserting (4.12) into the momentum equation (4.2a). The interaction term disappears due to symmetry and we obtain
 \begin{equation} u(z,t)=-\frac{t}{2}U'(z) w(z,t), \end{equation}
which is proportional to  $t^2$.
4.2. Viscous steady-state problem
We now turn to the viscous problem assuming a steady state has been reached. It should be noted here that the second-order solution constructed here is driven by the interaction kinematics of first-order waves which are themselves assumed to be inviscid; we assume that the periodic dynamics of the first-order waves are affected little by viscosity at moderate to large Reynolds numbers, and that the role of viscosity at that order is in all essentials accounted for through the prescribed shear of  $U(z)$. The resonant mode, on the other hand, continues to grow in time until it becomes strong enough for viscosity to become significant, and the flow reaches a steady state. The solution to (4.3) when denying any time dependency can be found by applying the solution formula of the previous problem twice. It is
 \begin{gather} w = \sum_\pm (d_0^\pm + z d_1^\pm) {\textrm{e}}^{\pm \kappa z} + w_{\times}(z)\,; \end{gather}
 \begin{gather}w_{\times}(z)\, = \frac{Re}{2\kappa^3 } \int_0^z \textrm{d} \xi \mathcal{R}(\xi)\, G[ \kappa (z-\xi)];\quad G(Z)=\sinh(Z)-Z\cosh(Z). \end{gather}
A full-slip condition is assumed at the upper boundary if considering a free surface, as is often reasonable for an atmospheric interface between water and air. We find that all first-order cross terms cancel also for these stress conditions, even after Taylor expansion about  $z=1$ (see also Craik Reference Craik1970). Appropriate full-slip stress conditions are
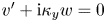 $v'+ {\textrm {i}} \kappa _y w = 0$ about the reference plane. The other boundary conditions discussed in § 4.1 still hold; employing the continuity equation (3.2b) yields
 \begin{equation} w=w''=0 \quad[\text{full-slip}] \end{equation}
at  $z=0$ or
 $1$ if considering the upper or lower boundary, respectively. We will also consider no-slip boundaries, which with (4.2b) implies that
 \begin{equation} w=w'= 0\quad[\text{no-slip}] \end{equation}
at  $z=0$ or
 $1$. With these conditions we have derived the integration constants
 $d_0^+$,
 $d_0^-$,
 $d_1^+$ and
 $d_1^-$ in (4.14) for the three cases, full-slip/full-slip, no-slip/no-slip and full-slip/no-slip, at the upper/lower boundary. Explicit solutions for
 $w(z)$ are presented in appendix A.
The horizontal velocity component of the vortex motion is again obtained by integrating the  $x$-component of the linearised momentum equation (4.2a). One finds that
 \begin{equation} u(z) = \sum_\pm d_u^\pm {\textrm{e}}^{\pm\kappa z}+ \frac{Re}{\kappa} \int_0^z\textrm{d}\xi U'(\xi) w(\xi)\sinh\kappa (z- \xi). \end{equation}
Appropriate no-slip and full-slip boundary conditions are  $u=0$ and
 $u'=0$, respectively, evaluated at the appurtenant reference planes. (Cross terms merely represent the second-order correction of a first-order motion which itself does not support stress conditions.) Coefficients
 $d_u^\pm$ are given in appendix A.
4.3. Summary of computations procedure
In summary we compute a solution for a general shear profile by first computing the linear solution for the first-order pressure  $p_1(z)$ through numerically integrating (3.6) subject to (3.7). From this, we compute from (4.5) the right-hand term
 $\mathcal {R}(z)$ of the Rayleigh/Orr–Sommerfeld equation. If considering a free surface flow with a power-law profile,
 $\mathcal {R}(z)$ can instead be computed directly from (4.6). The transient, inviscid circulation solution is then obtained from (4.12) after numerically integrating (4.9a,b). This yields
 $w_{\times }$, or the streamfunction
 $\psi$ by virtue of (4.7), whose contours in real space (4.8) represent streamlines. Spanwise velocity is the
 $z$-derivative of the streamfunction while the horizontal component is given by (4.13). Pressure can be computed from (A 4). In a viscous, steady-state solution, equations (4.14) and (4.18) replace (4.12) and (4.13), respectively. The full form of the resulting expressions are given in appendix A.
5. Comparison with strong shear CL2 instability and the theory of the generalized Lagrangian mean
We will start this section by relating our findings to GLM theory before considering features of strong shear CL1 instability compared with strong shear CL2 instability.
Andrews & McIntyre's (Reference Andrews and McIntyre1978) theory of the GLM has in recent years dominated in the study of CL2-type Langmuir circulation (Leibovich Reference Leibovich1980; Craik Reference Craik1982a,Reference Craikb; Phillips Reference Phillips1998, Reference Phillips2005). This theory is commonly used to derive the eigenvalue problem that governs the stability of unidirectional waves to flows of longitudinal vortex form. In order to connect our work with the GLM-based literature, we shall briefly discuss how key observations from the GLM theory relates to the CL1-type circulation considered in the present paper.
The GLM Navier–Stokes equations, averaged in  $x$, read as
 \begin{equation} \overline{D}{}^\textrm{L} (\overline{\hat u}{}^\textrm{L}_i - \hat\wp_i) + \overline{\hat u}{}^\textrm{L}_{j,i}(\overline{\hat u}{}^\textrm{L}_j- \hat\wp_j)+\hat\pi_{,i} = Re^{-1} \left[ \overline{( \hat\nabla^2\hat u_i)}{}^\textrm{L} + \overline{\hat\xi_{j,i}(\hat\nabla^2\hat u_j)^l} \right]. \end{equation}
Except for the symbol for the pseudomomentum
 \begin{equation} \hat\wp_i\equiv -\overline{\hat\xi_{j,i} \hat u_{j}^l} \end{equation}
and the use of hats to denote physical space variables, we have here adopted the common notation. The operator  $\overline {(\cdot )}{}^\textrm {L}$ is the average along a Lagrangian trajectory described by the displacement
 $\boldsymbol {\xi }$ of fluid particles. The fluctuating part of the Lagrangian velocity is denoted by
 $\hat {\boldsymbol {u}}^l=\hat {\boldsymbol {u}} (\hat {\boldsymbol {x}} + \hat {\boldsymbol {\xi }},t)-\overline {\hat {\boldsymbol {u}}}{}^\textrm {L}$. Gradient terms are lumped into
 $\hat \pi$ which may be thought of as an effective pressure. Overlines denote the streamwise average, indices
 $\{1,2,3\}$ refer respectively to the spatial dimensions
 $\{x,y,z\}$, repeated indices are summed and comma denotes differentiation. We refer the reader to the above references, in particular Andrews & McIntyre (Reference Andrews and McIntyre1978) and Craik (Reference Craik1982a,Reference Craikb), for a more complete description.
Envisage a wave field of  $O(\epsilon )$ generated by the wall topography. Only
 $O(\epsilon ^2)$ terms can survive the streamwise averaging. To
 $O(\epsilon ^2)$, (5.1) reduces to
 \begin{equation} \partial_t (\overline{\hat{\boldsymbol{u}}}{}^\textrm{L} - \hat{\boldsymbol{\wp}})+\hat{\boldsymbol{\nabla}}[U \overline{\hat u}{}^\textrm{L}_1 + \hat\pi-\tfrac12 U^2] -\hat\wp_1 \hat{\boldsymbol{\nabla}} U+ \overline{\hat u}{}^\textrm{L}_3 \boldsymbol{U}_{,3}- Re^{-1}\hat\nabla^2\overline{\hat{\boldsymbol{u}}}=0. \end{equation}
The streamwise averaged Eulerian velocity, pseudomomentum and differential drift (Stokes drift)  $\overline {\hat {\boldsymbol {u}}}{}^\textrm {S}=\overline {\hat {\boldsymbol {u}}}{}^\textrm {L}-\overline {\hat {\boldsymbol {u}}}$ will at
 $O(\epsilon ^2)$ have modes
 \[ [\boldsymbol{u}(z,t),\boldsymbol{\wp}(z,t),\boldsymbol{u}^\textrm{S}(z,t)]{\textrm{e}}^{{\textrm{i}} \kappa_y y}. \]
The streamwise component of  $\boldsymbol {u}$ obeys, by (5.3),
 \begin{equation} (\partial_t - Re^{-1} \nabla^2 )u_{1}= \partial_t ( \wp_1 - u_1^\textrm{S}) - (u_3+u^\textrm{S}_3) U_{,3}. \end{equation}
The other components of (5.3), together with continuity  $\boldsymbol {\nabla }\boldsymbol {\cdot }\overline {\boldsymbol {u}}=0$, can at
 $O(\epsilon ^4)$ be reduced into an Orr–Sommerfeld type equation
 \begin{equation} (\partial_t-Re^{-1}\nabla ^2)\nabla ^2 u_3 = - \kappa^2 \wp_1 U_{,3} - \partial_{t}[{\textrm{i}} \kappa_y (\wp_2-u_2^\textrm{S})_{,3} + \kappa^2 (\wp_3-u_3^\textrm{S})], \end{equation}
 $\nabla ^2=\partial _{zz}-\kappa ^2$. The second right-hand term vanishes when we next consider a time-independent primary flow.
For evaluating (5.5), one must first find the linear displacement  $\boldsymbol {\xi }$. Following Craik (Reference Craik1982a), we have derived the particle trajectories for time independent
 $U$, adopting Craik's method for matching trajectories to the appropriate streamlines. Writing
 $\hat {\boldsymbol {\xi }}$ as a superposition of modes
 ${\boldsymbol {\xi }}{\textrm {e}}^{{\textrm {i}}(k_x x + k_y y)}$ and using (3.8a–c) to express the
 $O(\epsilon )$ wave field, we eventually find the simple relation
 \begin{equation} \boldsymbol{\xi} = \frac{\boldsymbol{\nabla} p}{k_x^2 U^2}+O(\epsilon^2), \end{equation}
 $\boldsymbol {\nabla } = ({\textrm {i}} k_x,{\textrm {i}} k_y,\partial _z)$. Expression (5.6) implicitly assumes the absence of critical layers where
 $U=0$, as is common. Adopting this to compute the pseudomomentum (5.2), we get
 \begin{gather} \hat\wp_1 = -\frac{4}{k_x^2 U^3} \left[ { \left( k_x^2+k_y^2 \right) } p^2 + ( p')^2 \right] -\frac{4\cos(2k_y y)}{k_x^2 U^3} \left[ { \left( k_x^2-k_y^2 \right) } p^2 + ( p')^2 \right] + O(\epsilon^3), \end{gather}
 \begin{gather}\hat\wp_2 = \hat\wp_3 = 0. \end{gather}
Inserting (5.7) into (5.5) and matching it to (4.3) successfully recovers (4.5). Generalised Lagrangian mean theory thus accords with the more primitive mode coupling theory utilized in § 4, although the benefits of GML theory are not as patent as in studies of CL2 instability. The horizontally uniform part of the pseudomomentum can, for  $k_y\to \infty$, be compared with Craik's (Reference Craik1982a) equation (3.4a) with his
 $\phi =-4p'/\epsilon k_x^2 U$, whence we find that the spanwise-periodic topography generates, for the same amplitude
 $a$, half the pseudomomentum of the spanwise uniform topography, in addition to the spanwise periodic part.
When the shear intensity is of  $O(1)$, the study of CL2-type instabilities turns more complicated than its weak shear counterpart due to the influence of wave distortion (Craik Reference Craik1982b; Phillips Reference Phillips2005). Wave distortion comes about as the pseudomomentum generated by the spanwise-periodic wave perturbation (here called the Langmuir wave) reaches a magnitude great enough to re-enter the eigenvalue problem governing the stability of the spanwise-periodic wave. The pseudomomentum generated by the spanwise-periodic wave itself must then be estimated in a separate analysis, first performed by Craik (Reference Craik1982b), yielding a coupled pair of differential equations governing the stability to longitudinal vortex form. This equation set has since been termed the ‘generalized Craik–Leibovich equations’ (CLg), with the range of validity extending beyond instability from wind-driven surface waves and into boundary layer flows.
Wave distortion enters the CL1 problem less directly due to three prominent differences between the two mechanisms. First, where the CL2 mechanism primarily consists of a distortion of the streamwise flow generating a spanwise-periodic wave, the CL1 mechanism works by directly imposing a spanwise-periodic wave of prescribed wavelength. Second, CL2 wave distortion is present immediately from the scaling of the initial perturbation of the primary flow, while the instability of CL1 is algebraic, growing linearly from out of a completely unperturbed state. If not sufficiently suppressed by viscosity, the wave may eventually grow until wave distortion takes effect or other longitudinal vortex instabilities occur. Third, where the spanwise-periodic wave in the CL2 mechanism generates pseudomomentum at the same wavelength, the CL1 equivalent is an interaction between two spanwise-periodic wave fields, generating higher and lower spanwise harmonics.
Wave distortion will eventually arise in CL1 if the viscosity is insufficient to restrain the circulation to a moderate intensity. This then occurs via pseudomomentum generated by the Langmuir wave. Only streamwise-periodic particle displacements and velocity perturbations can combine in (5.2) to produce non-zero pseudomomentum (by construction,  $\overline {\hat {\boldsymbol {\xi }}}=0$). The next order of pseudomomentum relevant in terms of wave distortion is then generated by two primary
 $O(\epsilon )$ harmonics interacting with the Langmuir wave. The Langmuir wave must therefore be of
 $O(1)$ (and not
 $O(\epsilon )$) for this distortion to scale with the principal pseudomomentum (5.7). Such wave distortions will then be spanwise periodic with wavenumbers
 $k_{1y}$ and
 $3k_{1y}$. The streamwise component of the Langmuir wave is, similar to CL2, the first to become significantly large as this is proportional to
 $Re^2$. Flow simulations are presented later in § 7. Examining velocity fields from these simulations (examining
 $\overline {\hat u}$ minus its spanwise mean) reveals that the streamwise component of the Langmuir wave is about
 $5\,\%$ the magnitude of the principal flow at
 $Re_\tau =30$,
 $a=0.0635$, and significantly less for smaller Reynolds numbers and amplitudes. It seems quite possible that wave distortion generated by the Langmuir wave plays a role in the unstable behaviour and emergence of higher wavenumbers observed at larger Reynolds numbers. The theoretical model accords with the observed magnitude of the streamwise Langmuir wave component and indicates that the no-slip boundary condition for the Langmuir wave is active in reducing its magnitude below
 $O(\epsilon ^2 Re^2)$.
6. Results
6.1. Free surface flow
In this section we consider free surface flows with the power-law profile (3.9a,b), i.e. adopting the free surface boundary condition in (3.7)/(3.13) (using the ‘mixed’ condition in (A 1c) and (A 3) when discussing no-slip flows). Even though we have presented an efficient numerical procedure for arbitrary shear currents, the power law (3.9a,b), as adopted by Phillips et al. (Reference Phillips, Wu and Lumley1996), is a suitable choice for exploring a variety of curvatures.
The Froude number of a free surface flow affects Langmuir circulation only through the upper boundary, which is in phase with the bathymetry when the Froude number is subcritical and in antiphase when supercritical (Lamb Reference Lamb1932, Art. 246). For definiteness, we fix it at a subcritical value  $Fr=0.5$. The critical Froude number is unity for a uniform current and
 \begin{equation} Fr_{\textrm{c}}^2=\frac{k}{k_x^2}\frac{I_{q-1/2}[k(1+\delta)] I_{-q+1/2}(k\delta) -I_{-q+1/2}[k(1+\delta)] I_{q-1/2}(k\delta) }{I_{q+1/2}[k(1+\delta)] I_{-q+1/2}(k\delta) -I_{-q-1/2}[k(1+\delta)] I_{q-1/2}(k\delta)}, \end{equation}
with the power-law profile (3.9a,b) – see, e.g. Lamb (Reference Lamb1932, Art. 246) or Akselsen & Ellingsen (Reference Akselsen and Ellingsen2019a). Whether the upper boundary is a wall or a free surface affects the Langmuir circulation mainly by determining whether this motion should be subject to a full-slip condition or not. The Froude number enters only the boundary condition of the linear wave. Wall undulations must generate surface undulations of comparable magnitude for the Froude number to notably affect the circulation. This happens only when the flow itself is shallow ( $k \ll 1$) or when the Froude number is close to criticality. Neither is the case in the presented examples so that the sensitivity to the Froude number is weak.
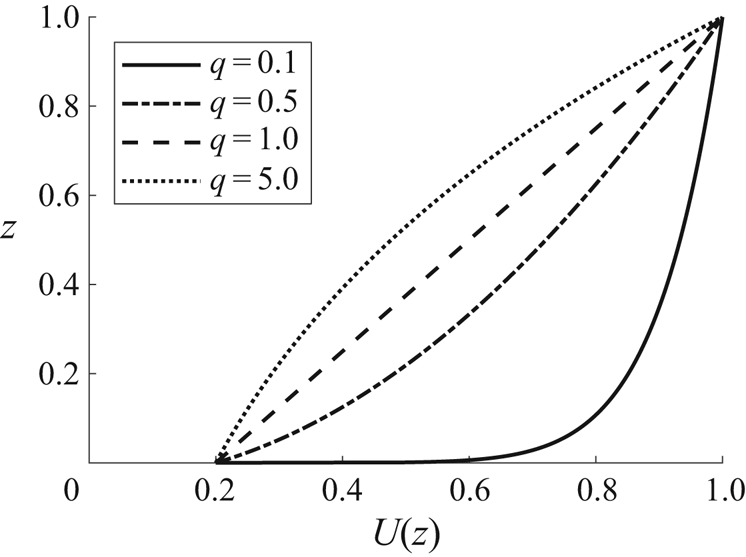
We start by considering the primary current profiles drawn in figure 3 for the power law (3.9a,b) with varying exponent values  $q=0.1$,
 $0.5$,
 $1.0$ and
 $5.0$. Values of displacement
 $\delta$ (need not be small) are chosen to give the same wall velocity
 $U(0)=U_{\textrm {b}}=0.2$, i.e.,
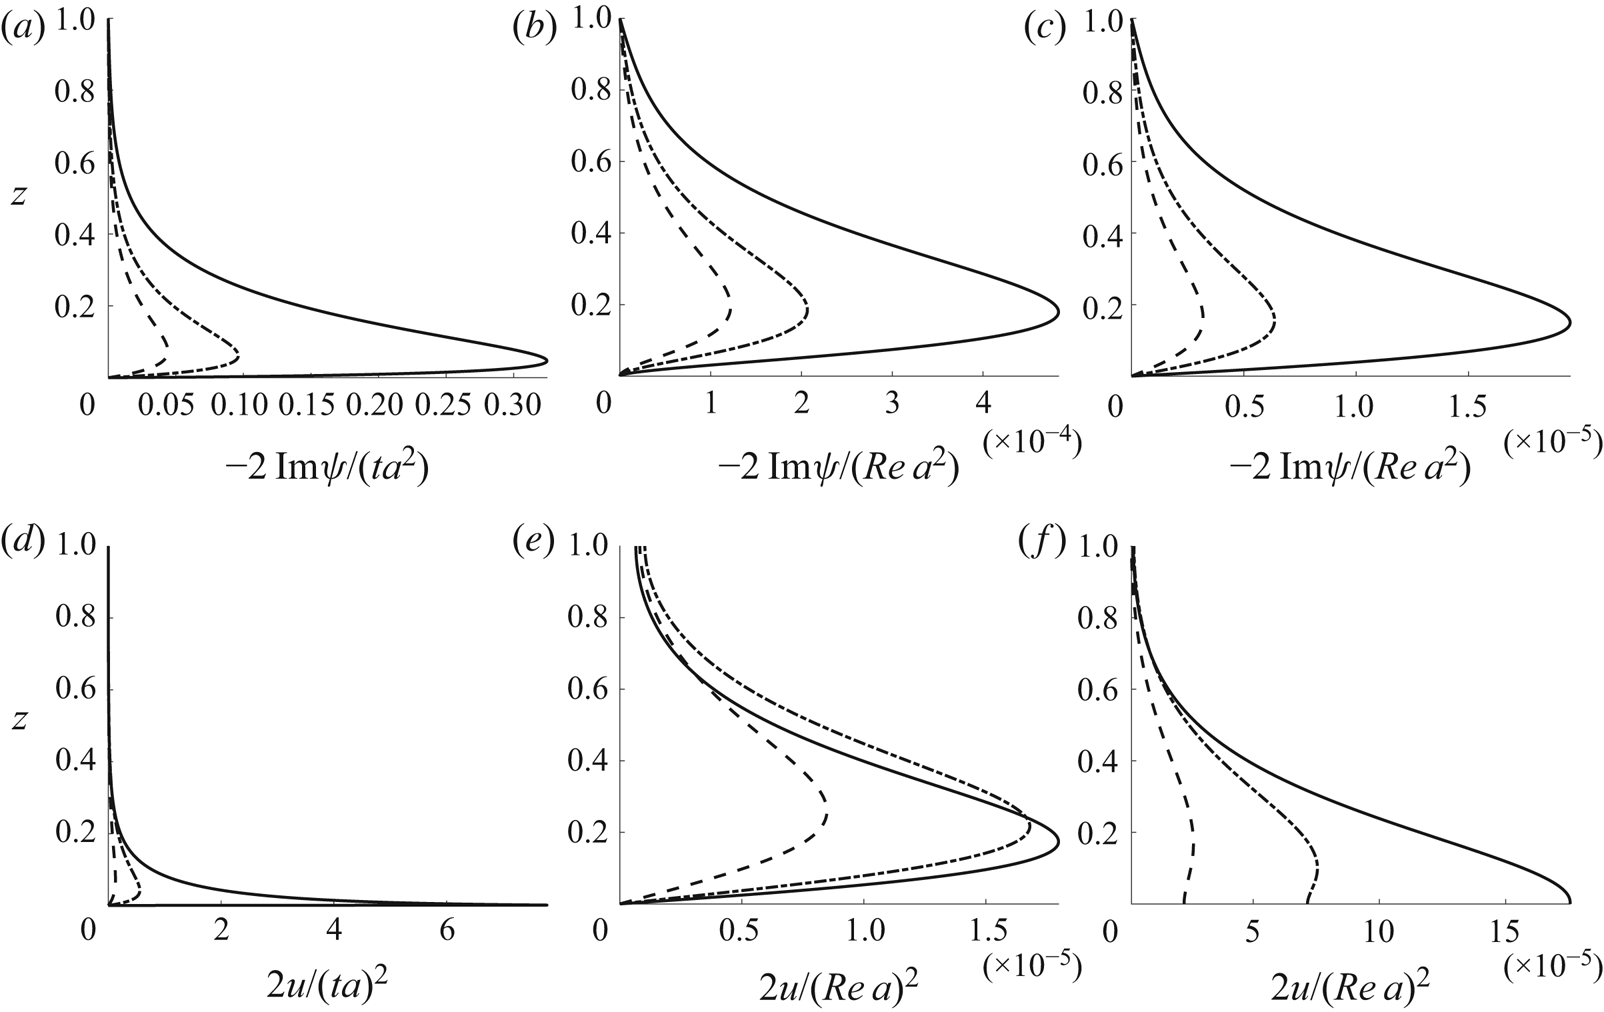
 $\delta = U_{\textrm {b}}^{1/q}/(1-U_{\textrm {b}}^{1/q})$. In figures 4–6 we compare the streamfunctions
 $\psi (z)$ and the streamwise velocity component
 $u(z)$ generated by these profiles. Three depths,
 $k_1 = 3\pi$,
 $\pi$ and
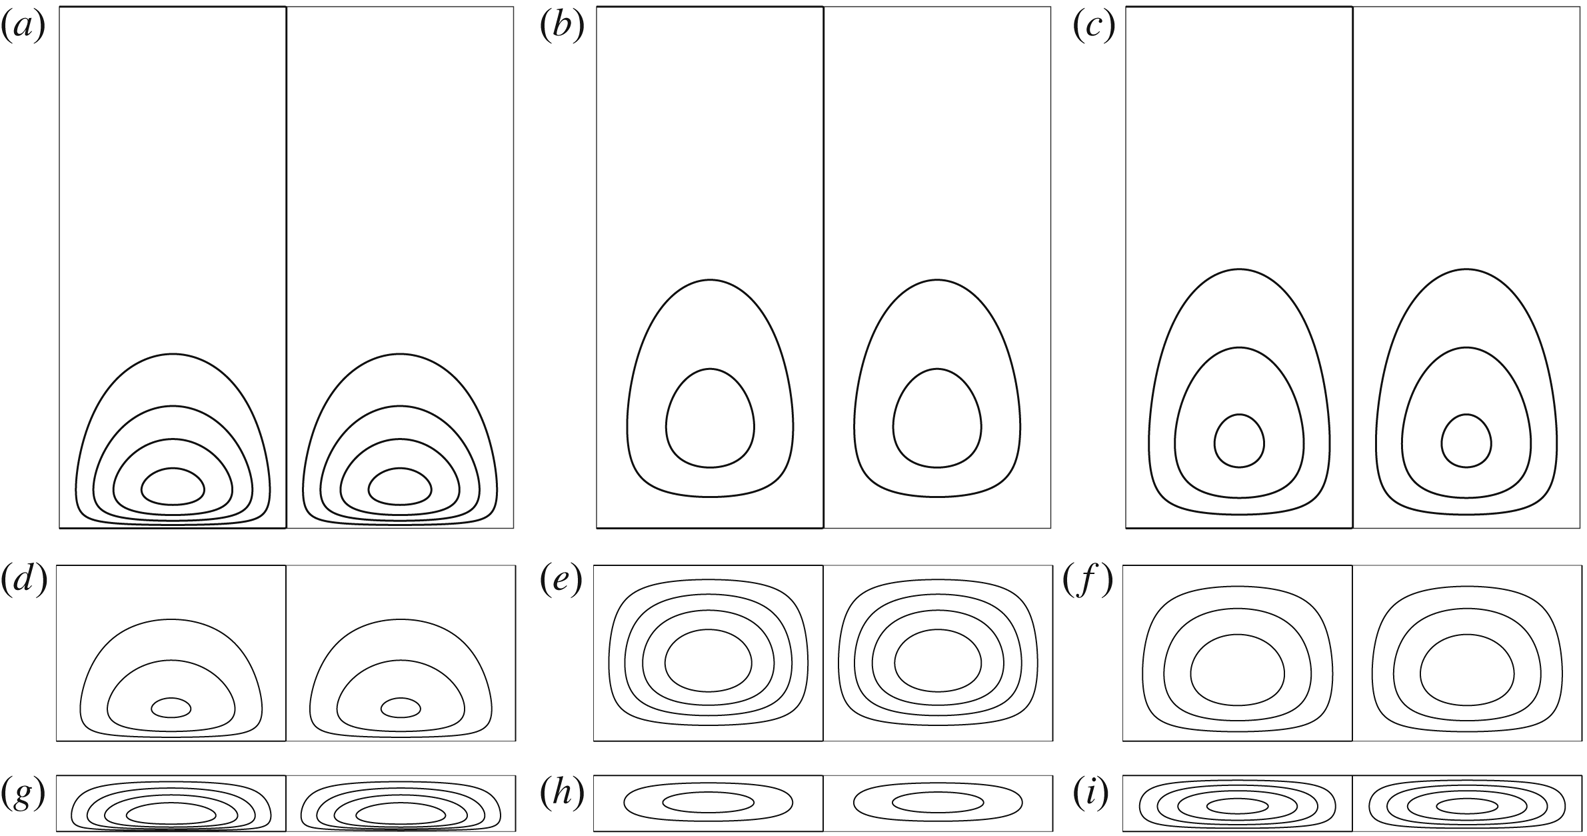
 $1$, are considered. These represent deep, intermediate and shallow water, respectively, as can be seen in the real-space streamline plots in figure 7. Note that
 $k_1 = 3\pi$ and
 $\pi$ can both be considered ‘deep’ in terms of the first-order Rayleigh wave, yet the Langmuir wave penetrates much deeper. This feature makes Langmuir circulation an effective mixing mechanism.
Primary flow profiles  $U(z)$ from (3.9a,b) with
 $\delta$ values such that
 $U(0) = 0.20$.

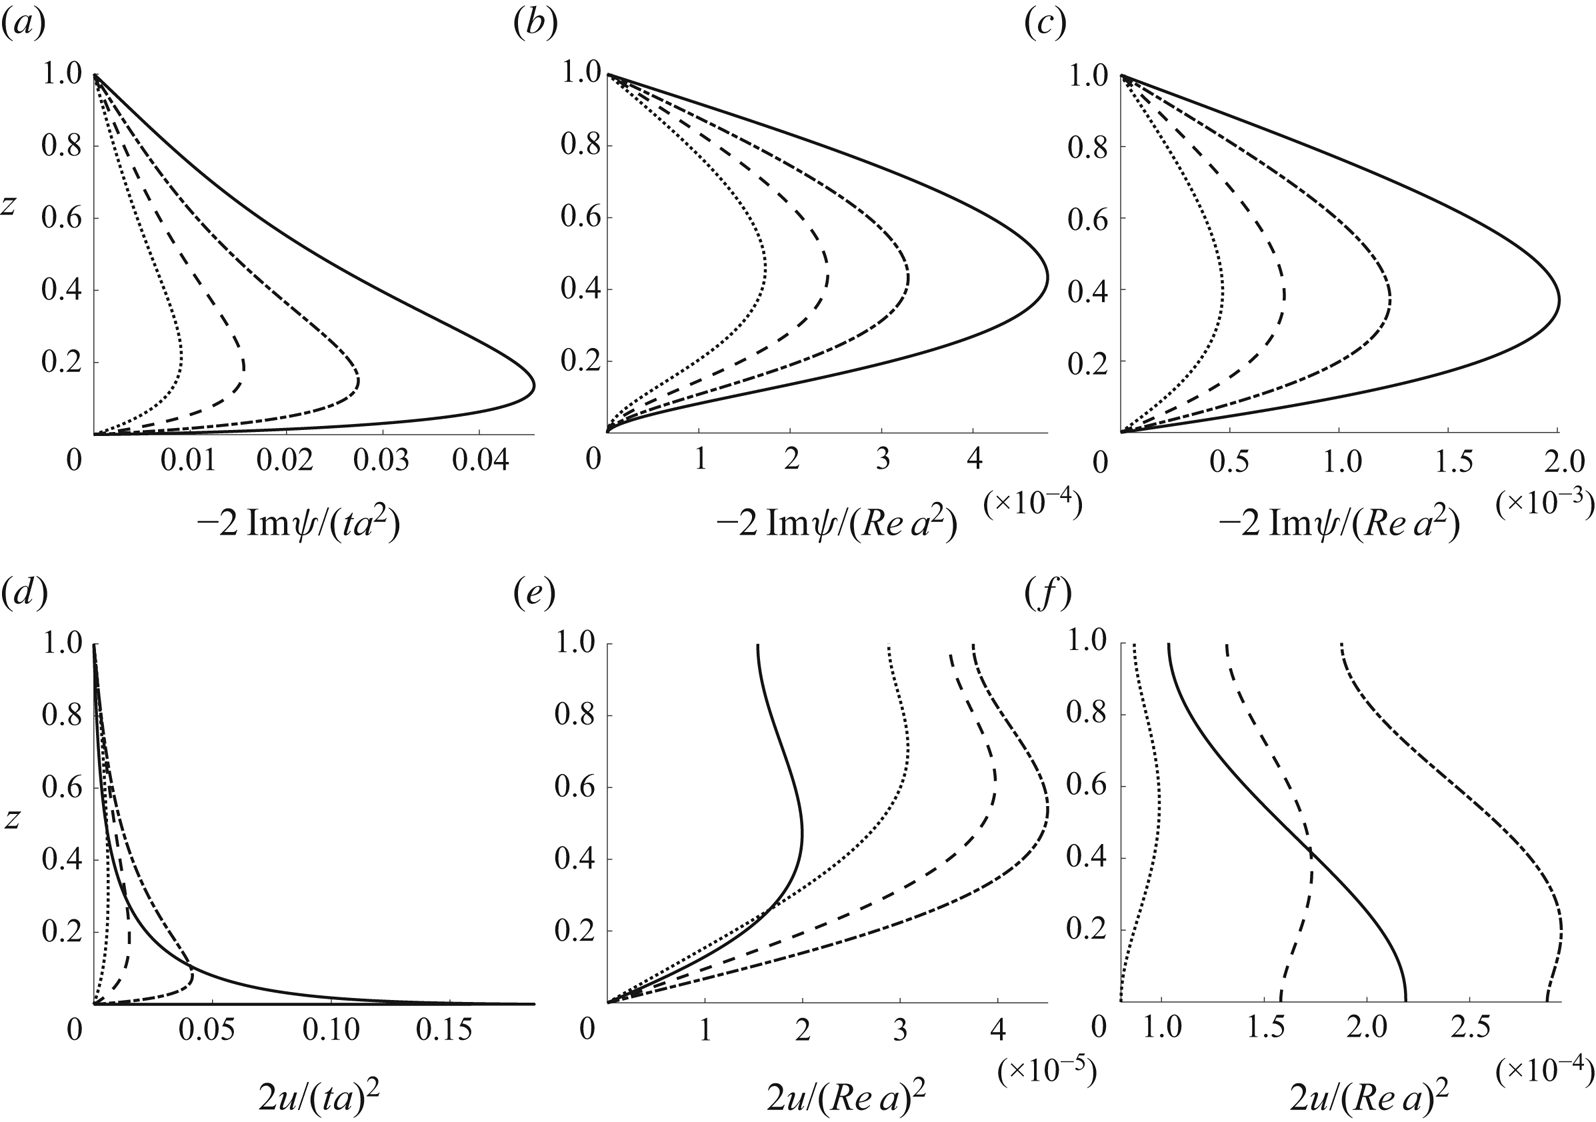
Free surface flow. Normalised streamfunction (a–c) and normalised streamwise velocity perturbation (d–f) as a function of vertical position.  $k_1=3\pi$,
 $\arctan (k_{1y}/k_{1x})=\pi /8$: (a,d) inviscid; (b,e) viscous, no-slip; (c,f) viscous, full-slip. Power-law (3.9a,b) primary flow profile; solid, dot–dashed, dashed and stippled dotted lines respectively show
 $q=0.1$ ,
 $0.5$,
 $1.0$ and
 $5.0$ with
 $\delta$ values such that
 $U(0) = 0.20$ (cf. figure 3).

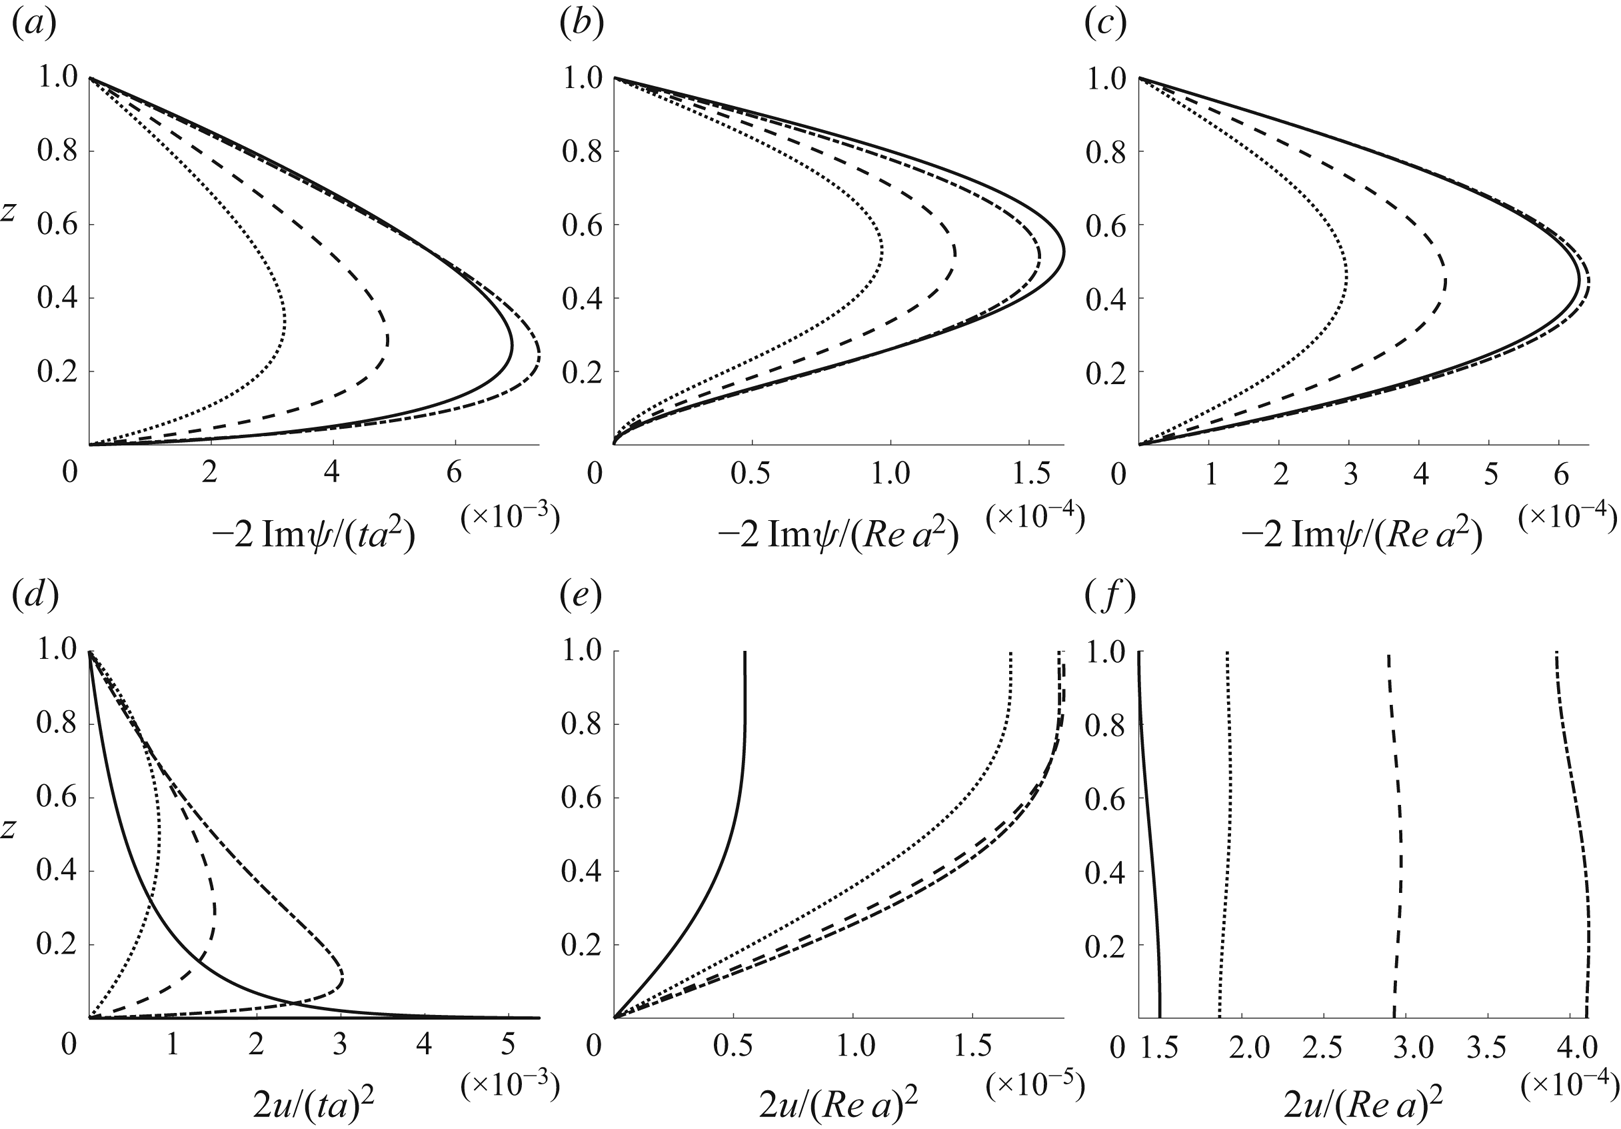
Similar to figure 4, but with increased wavelength (reduced depth)  $k_1 = \pi$: (a,d) inviscid; (b,e) viscous, no-slip; (c,f) viscous, full-slip.

Similar to figure 5, but with increased wavelength (reduced depth)  $k_1 = 1.0$: (a,d) inviscid; (b,e) viscous, no-slip; (c,f) viscous, full-slip.

Streamlines 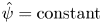 $\hat \psi = {{\rm constant}}$ in free surface flow for the
 $q=1.0$ power-law profile (cf. figures 3–6): (a–c)
 $k_1 = 3\pi$; (d–f)
 $k_1 = \pi$; (g–i)
 $k_1 = 1.0$. Here
 $\arctan (k_{1y}/k_{1x})=\pi /8$. Isoline values of
 $\hat {\psi }$ can be inferred from the graphs in figures 4–6 as these give the streamfunction values in a vertical line running through the vortex centre: (a,d,g) inviscid; (b,e,h) viscous, no-slip; (c,f,i) viscous, full-slip.

Vortex centres are vertically located at the extrema of the streamfunction  $\psi (z)$. An extremum of
 $\psi (z)$ serves as a measure of vortex turnover as it equals half the volume flux per unit along the
 $x$-axis through a cross-section passing from a vortex centre to one of the boundaries. (At the boundaries,
 $\psi (z)$ is chosen zero.) Vortex solutions are directly proportional to powers of
 $a$,
 $Re$ and, in the case of transient inviscid flow,
 $t$. We therefore adopt normalised streamfunctions
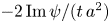 $-2\operatorname {Im} \psi /(t\,a^2)$ when inviscid and
 $-2\operatorname {Im} \psi /(Re\,a^2)$ for stationary viscous flow, and the normalised streamwise velocity perturbations
 $2 u/(t\,a)^2$ and
 $2 u/(Re\,a)^2$ in the same flows, respectively. This renders the normalised solutions independent of
 $t$,
 $Re$ and
 $a$.
Compared with the inviscid, transient case, an effect of viscosity is to push the vortex centres out away from the boundaries. This is expected and was also demonstrated by Craik (Reference Craik1970). In addition, the no-slip boundary condition is seen to significantly reduce the steady-state vortex intensity and also to push the vortex slightly further away from the lower boundary. No-slip conditions are appropriate for rigid walls and full-slip conditions for free surfaces.
Vortex intensity is governed by the presence of the two main ingredients for Langmuir circulation – the wave-like perturbation of current streamlines, proportional to the vertical velocity enforced by the bed, and the shear of the primary flow. Since the current profiles have been made to have the same velocity at the bed, the profile with the strongest shear near the bed (the lowest  $q$) has the greatest vortex intensity.
The power-law profile with a low exponent value  $q$ has historically often been used as a model for turbulent boundary layers. In fact, a general consensus has in recent years formed that the power law performs better than the log law over rough boundaries or at low Reynolds numbers (Barenblatt Reference Barenblatt1993; Djenidi, Dubief & Antonia Reference Djenidi, Dubief and Antonia1997; George & Castillo Reference George and Castillo1997; Bergstrom, Tachie & Balachandar Reference Bergstrom, Tachie and Balachandar2001). A range of exponent values have over the years been suggested for such flows, ranging between
 $1/3$ to
 $1/12$ depending on roughness and Reynolds number (Chen Reference Chen1991; Cheng Reference Cheng2007; Dolcetti et al. Reference Dolcetti, Horoshenkov, Krynkin and Tait2016). Models of varying sophistication for relating the power-law exponent to a particular boundary layer are available. For example, adopting the much celebrated model proposed by Barenblatt (Reference Barenblatt1993) (his equation (16) with a hydraulic diameter assumption), we compute that the example exponent
 $q=0.1$ is a suitable representation of a turbulent boundary layer of wall Reynolds number
 $2.8\times 10^4$.
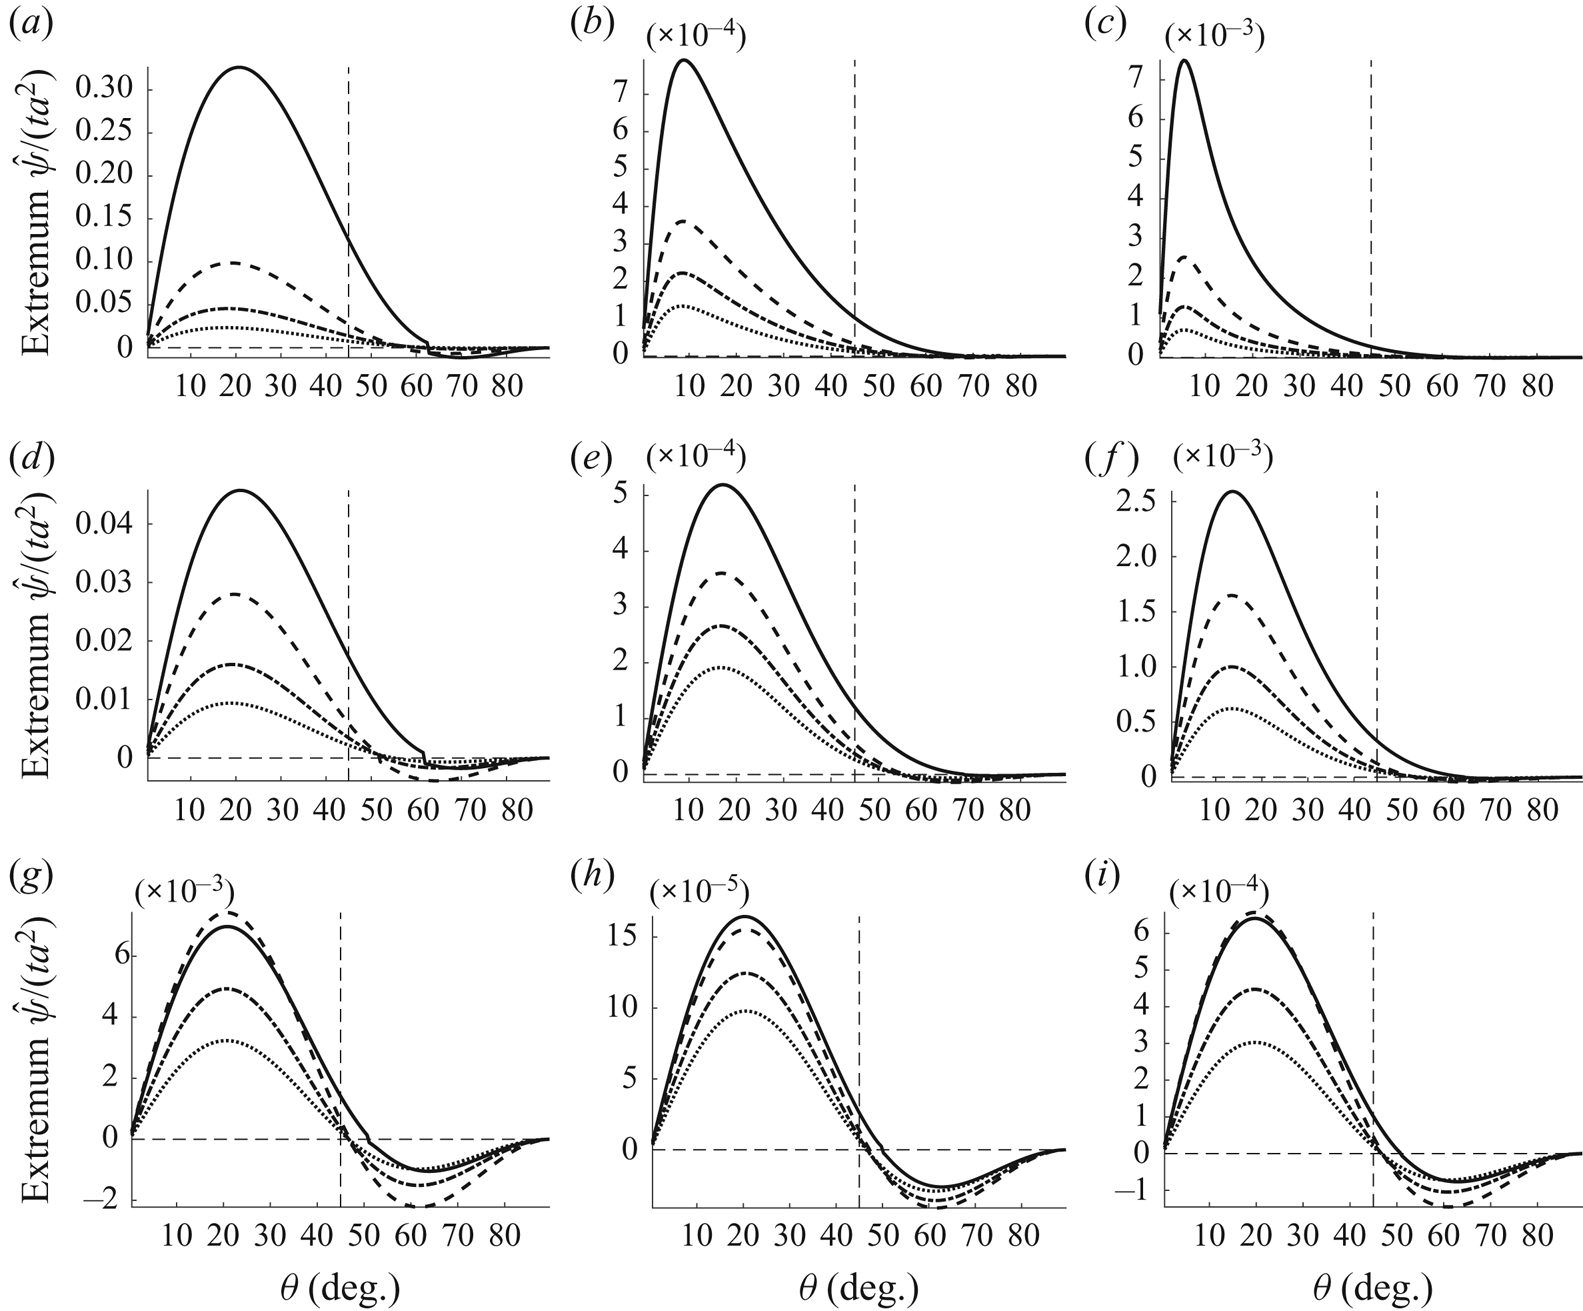
The influence of the angle  $\theta$ of
 ${\boldsymbol {k}}_1$,
 $\theta =\arctan (k_{1y}/k_{1x})$ is demonstrated in figure8, showing for fixed moduli
 $k_1$ peak values of
 $\psi (z)$ proportional to vortex turnover. Wavenumbers are
 $k_1=\pi$ and
 $1.0$ in the top and bottom panels, respectively. The strongest vortex intensity is typically observed within the range
 $10^\circ <\theta <25^\circ$ where
 $- \operatorname {Im}\,\psi >0$, meaning that zones of downwelling are aligned with extrema in the bathymetry such that vortex rolls push fluid down towards peaks and troughs in the bed topography. The streamwise velocity component
 $u$ is also positive in this range so that the strongest velocity perturbation in the downstream direction is found along the extrema in the bathymetry while the strongest counter-current perturbations lie above the ‘saddle-point ridge’. Naturally, vortex intensity approaches zero in the orthogonal orientations
 $\theta = 0$ and
 $90^\circ$.
Extremum of appropriate normalised streamfunctions as a function of the wave vector angle  $\theta =\arctan (k_{1y}/k_{1x})$ in free surface flow. This value is proportional to the vortex volume flow through a cross-section from the vortex centre out:
 $ (a\!-\!c) \ k=3\pi; \ (d\!-\!f) \ k=\pi; \ (g\!-\!i) \ k=1$. Power-law (3.9a,b) primary flow profile; solid, dot–dashed, dashed and stippled dotted lines respectively show
 $q=0.1$,
 $0.5$,
 $1.0$ and
 $5.0$ with
 $\delta$ values such that
 $U(0) = 0.20$ (cf. figure 3): (a,d,g) inviscid; (b,e,h) viscous, no-slip; (c,f,i) viscous, full-slip.

Circulation intensity increases with increasing non-dimensional wavenumbers modulus  $k_1$, which constitutes increasing the relative depth. Since depth is used as the normalisation length scale, increasing
 $k_1$ amounts to changing the wall undulation wavelength while keeping its amplitude and the water depth fixed. We have observed with the viscous flows that the increase in circulation intensity flattens out around
 $k_1\gtrsim \pi$, beyond which point the vortex motion is no longer restricted by the upper boundary. With the transient inviscid flows, the intensity of vortex wave growth continues to increase with higher wavenumber moduli.
Figure 8 reveals that the rotational direction of vortices relative to the bathymetry can switch as a function of  $\theta$, i.e. at a critical value of
 $\theta$ the extrema of
 $\psi (z)$ change sign. From (4.5) we see that the forcing term
 $\mathcal {R}(z)$ in the Rayleigh/Orr–Sommerfeld equation is always positive in the range
 $0^\circ <\theta < 45^\circ$ whenever
 $U(z)$ is monotonically increasing. The switch in rotational direction therefore occurs in the range
 $45^\circ <\theta < 90^\circ$. Furthermore,
 $\mathcal {R}(z)$ is directly proportional to
 $(p_1')^2$ at
 $\theta = 45^\circ$, which vanishes in the shallow water limit
 $k_1\to 0$ as the shallow flow becomes depth uniform. The critical angle is therefore always
 $\theta =45^\circ$ in the shallow water limit. Tests with a wide range of parameters indicate that the critical angle increases with increasing wavenumber and so does the relative difference in intensity between the two rotational orientations; in the deeper viscous flows (
 $k_1=3\pi$ and
 $\pi$), the ‘negative’ circulation at high
 $\theta$-values is orders of magnitude weaker than at the ‘positive’ peak in the
 $5^\circ$–
 $25^\circ$ range. Increasing the depth reduces the
 $\theta$ of strongest circulation.
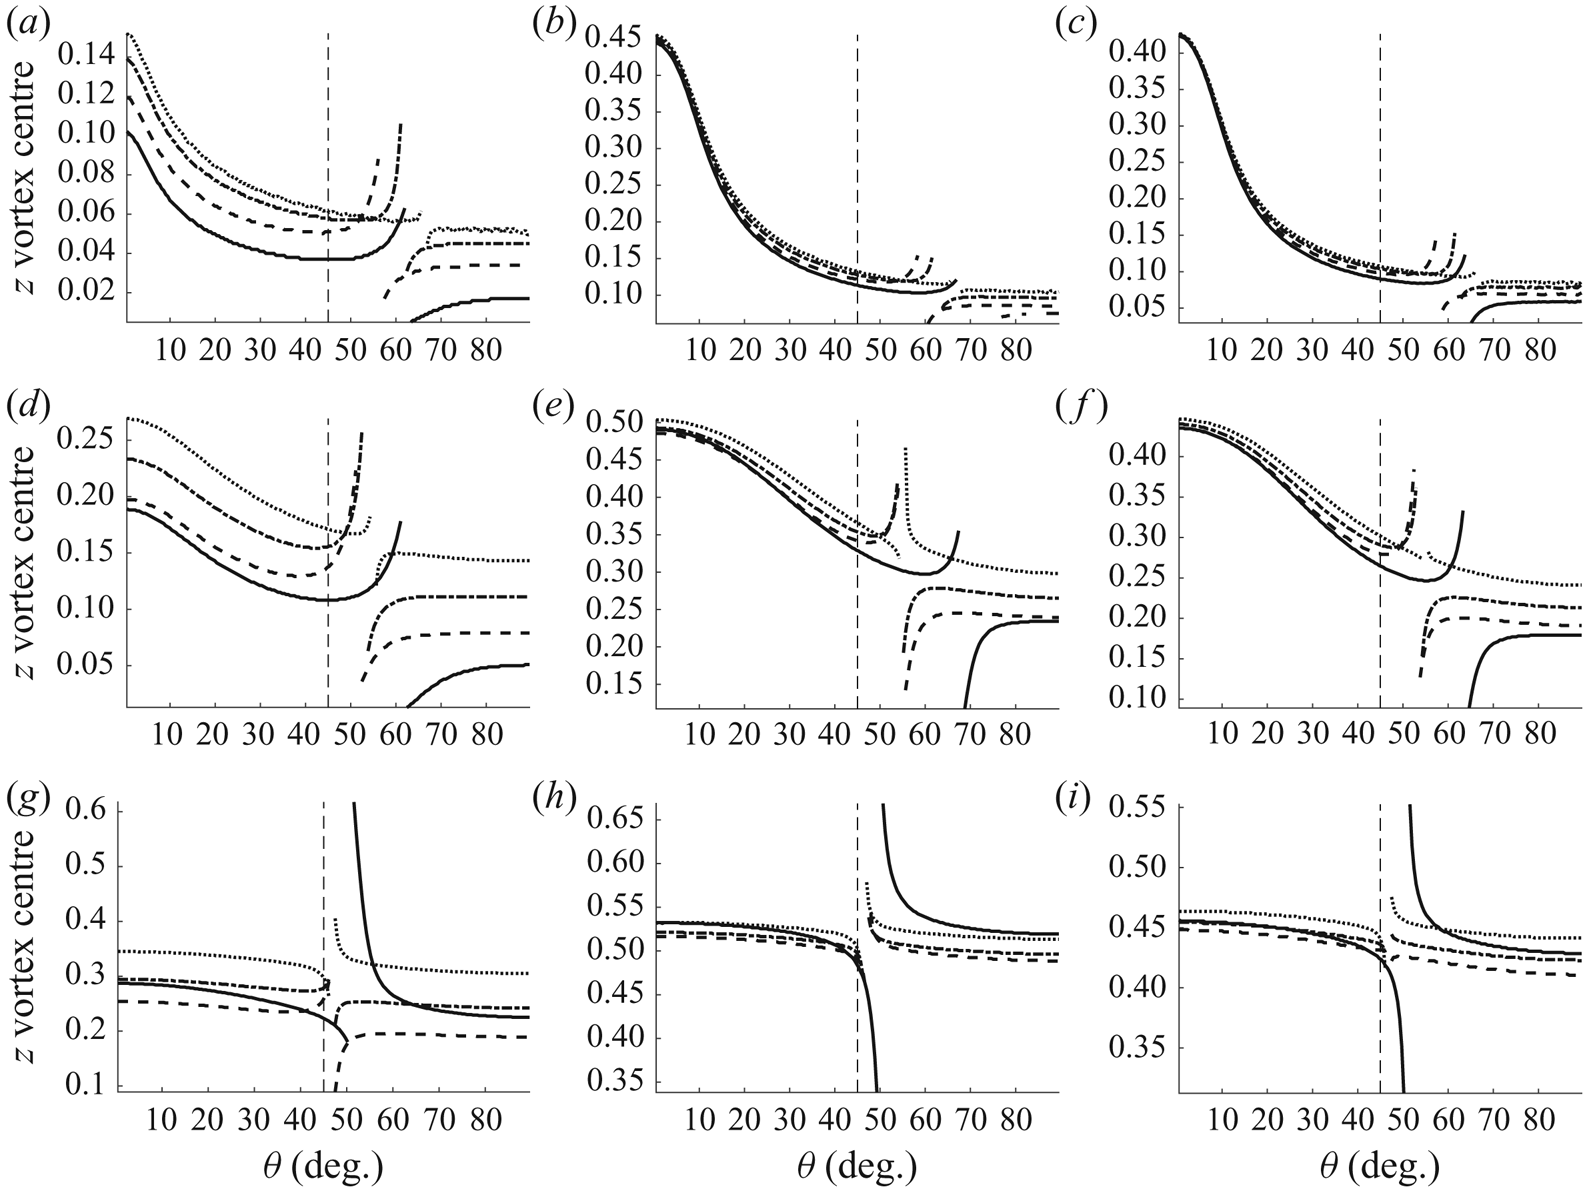
The vertical location of the vortex centres is depicted in figure 9, again as a function of  $\theta$. Locations are not strongly dependent on
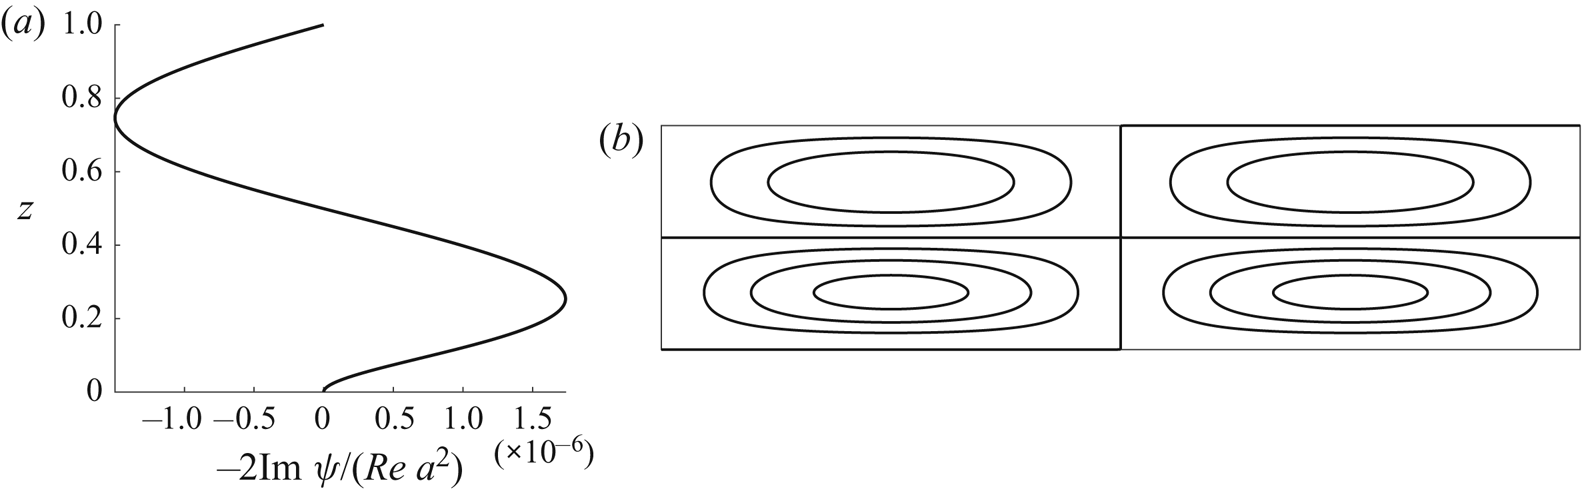
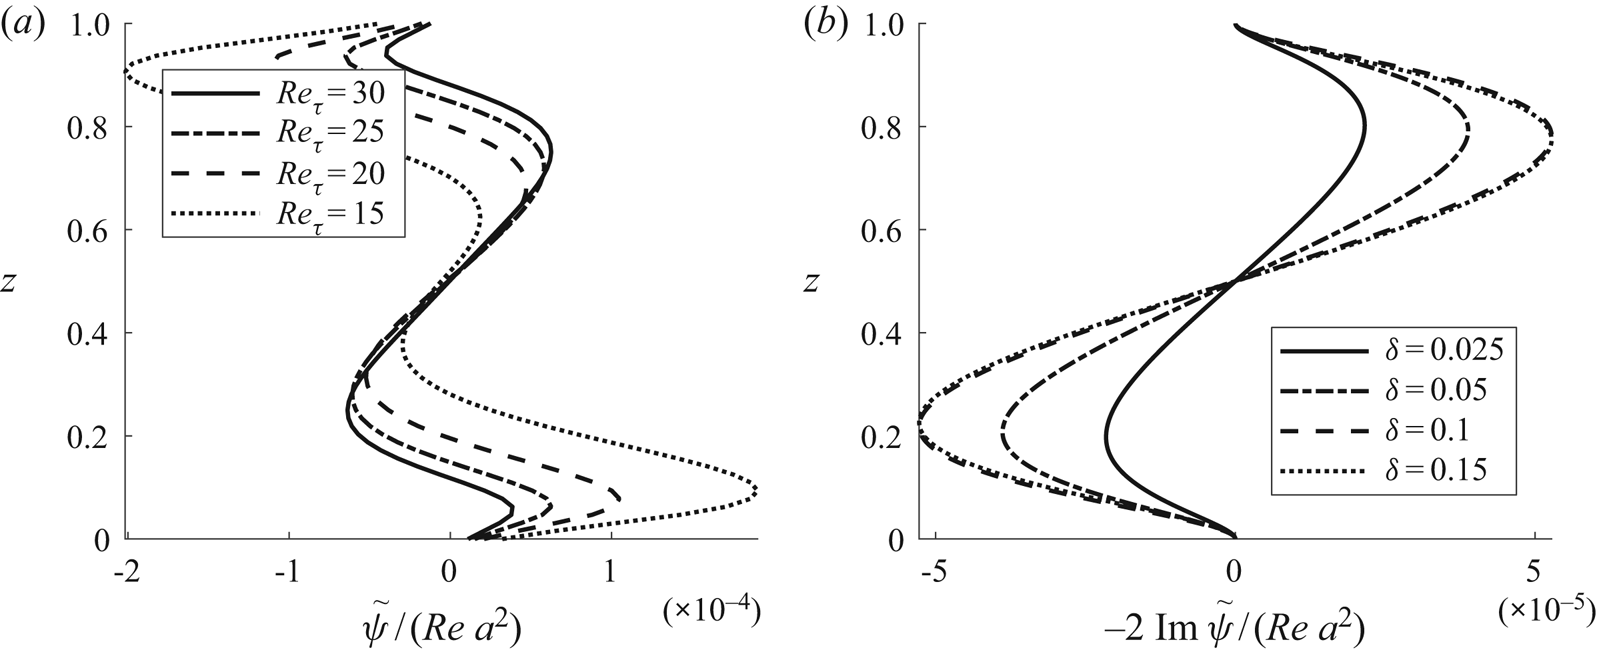
 $\theta$, but a sharp jump is observed where the switch in rotational direction occurs. This is because more than a single vortex, rotating in opposite directions, is present vertically in the region of this switch. These are both weak in intensity. The plot in figure 9 shows the location of the vortex whose magnitude is greater, hence there is a jump in location as a new vortex starts to dominate. To illustrate, figure 10 shows the streamfunction
 $\psi (z)$ at a state close to the directional switch; two extrema are present, meaning counter-rotating vortices aligned vertically.
Vertical position of vortex centre as a function of the wave vector angle  $\theta =\arctan (k_{1y}/k_{1x})$ in free surface flow: (a,d,g) inviscid; (b,e,h) viscous, no-slip; (c,f,i) viscous, full-slip. See caption of figure 8 for further details.

Normalised (a) streamfunction and (b) streamlines at a value of  $\theta$ near the point where the rotational direction of vortices switches. Viscous, no-slip case with
 $k_1 = 1.0$
 $\theta =50^\circ$,
 $q=0.1$ and
 $U(0)=0.20$.

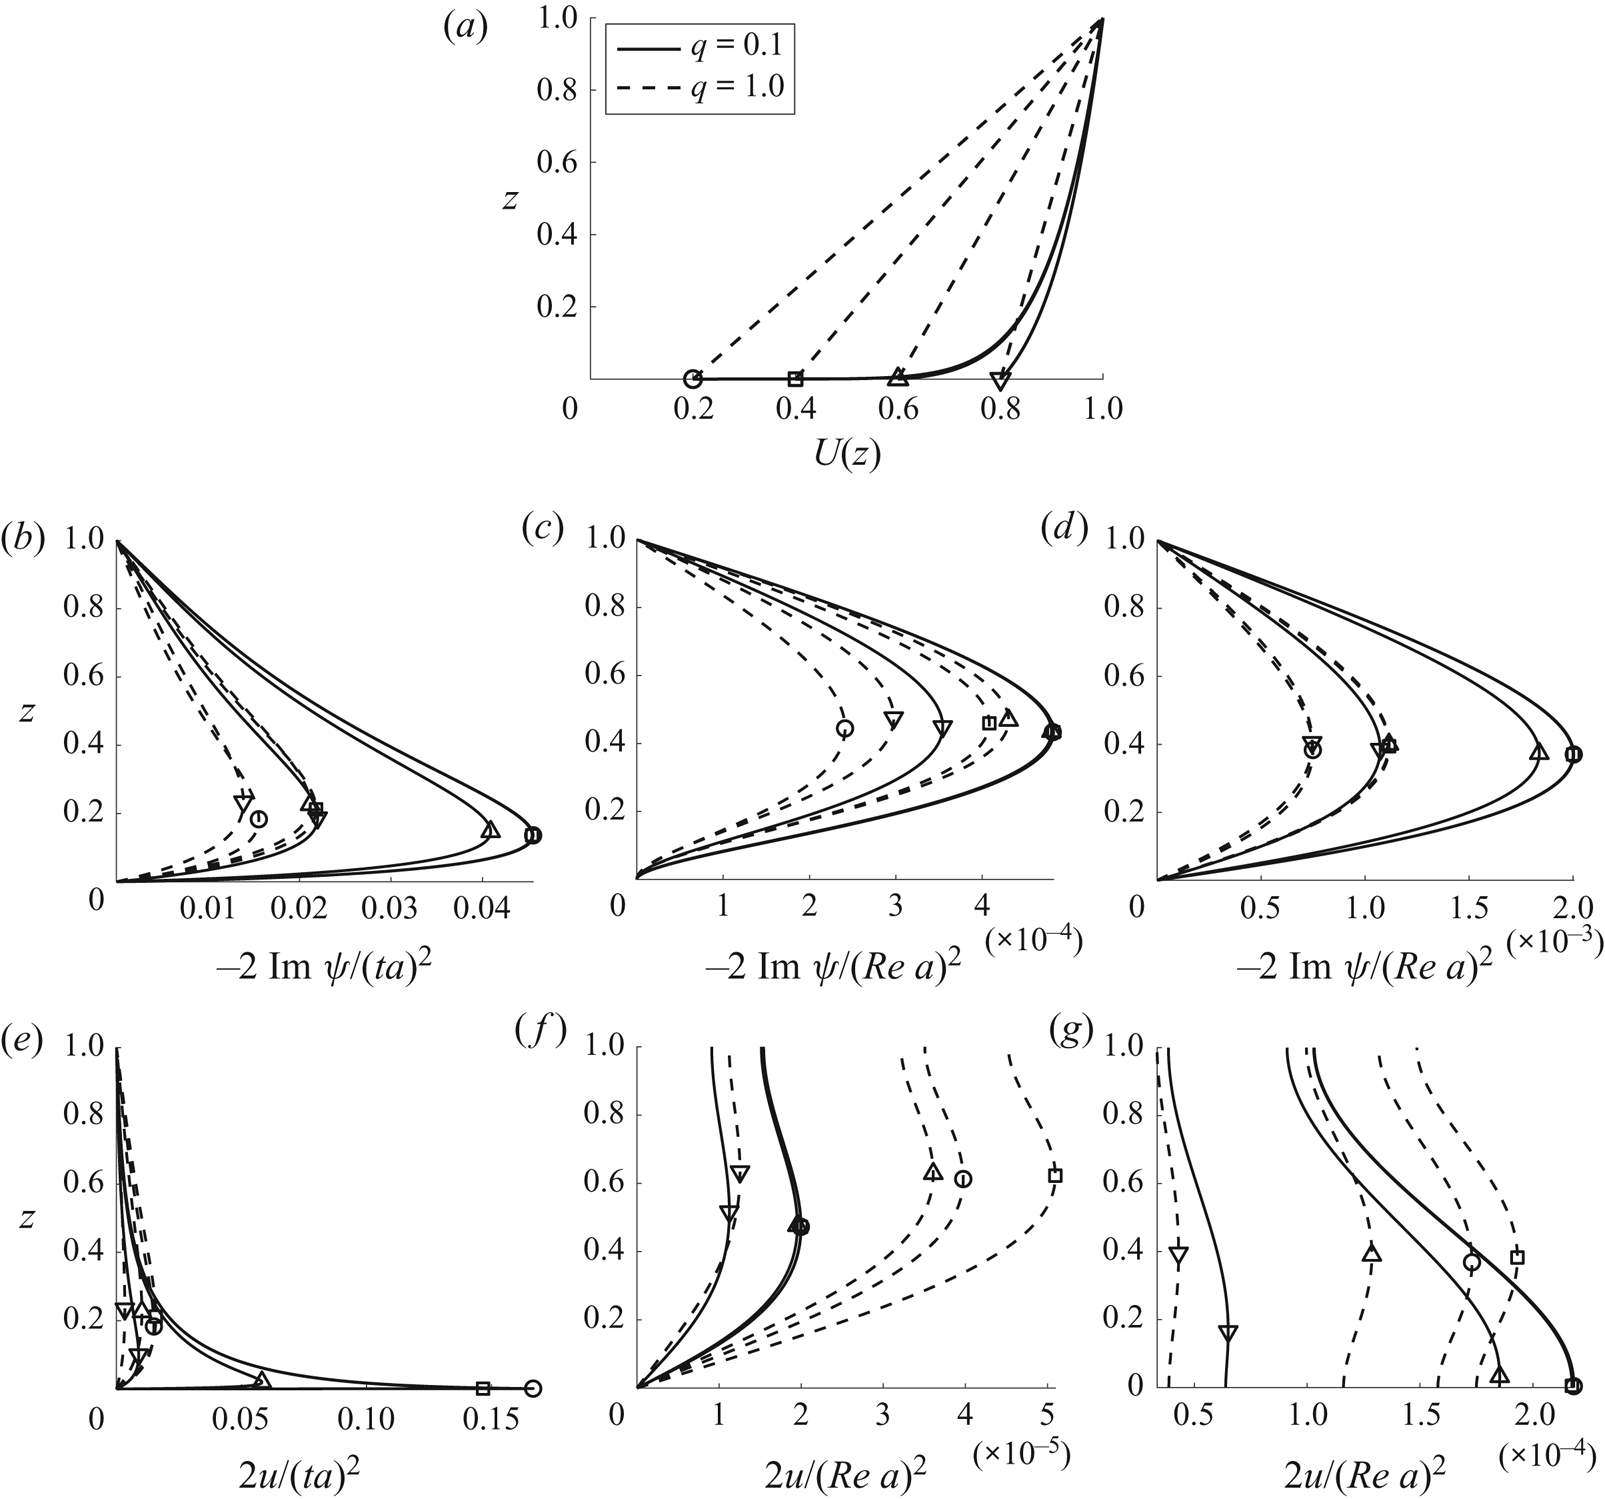
The sensitivity to the displacement parameter  $\delta$ is considered next. Figure 11(a) shows the near-logarithmic profile
 $q=0.1$ and the linear profile
 $q=1.0$ for
 $\delta$'s corresponding to
 $U(0) = 0.20$,
 $0.4$,
 $0.6$ and
 $0.8$. The other panels of figure 11 show
 $\psi$ and
 $u$ for the
 $k_1=\pi$ bed topography. The strongest circulation is sometimes observed at an intermediate
 $U(0)$-value since its intensity depends on both shear strength and current velocity at the wall. Notice that the near-logarithmic profile
 $q=0.1$ is fairly insensitive to
 $\delta$ for all but the largest
 $\delta$-value. We interoperate this as a balance in logarithmic profiles between decreasing (increasing) shear and increasing (decreasing) current velocity at the wall.
Free surface flow for varying values of displacement parameter  $\delta$ with
 $\delta$-values such that
 $U(0) = 0.20$,
 $0.4$,
 $0.6$ and
 $0.8$, respective markers indicated in (a). Solid,
 $q=0.1$; dashed,
 $q=1.0$. (a) Primary flow profiles U(z) from (3.9a,b). (b–g) Normalised streamfunction (b–d) and normalised streamwise velocity perturbation (d–g) as a function of vertical position, graphed for various values of
 $\delta$ with the power-law model (3.9a,b): (b,e) inviscid; (c,f) viscous, no-slip; (d,g) viscous, full-slip. Here
 $k_1=\pi$,
 $\arctan (k_{1y}/k_{1x})=\pi /8$. (Curves occasionally overlap.)

6.2. Wall-bounded laminar flow
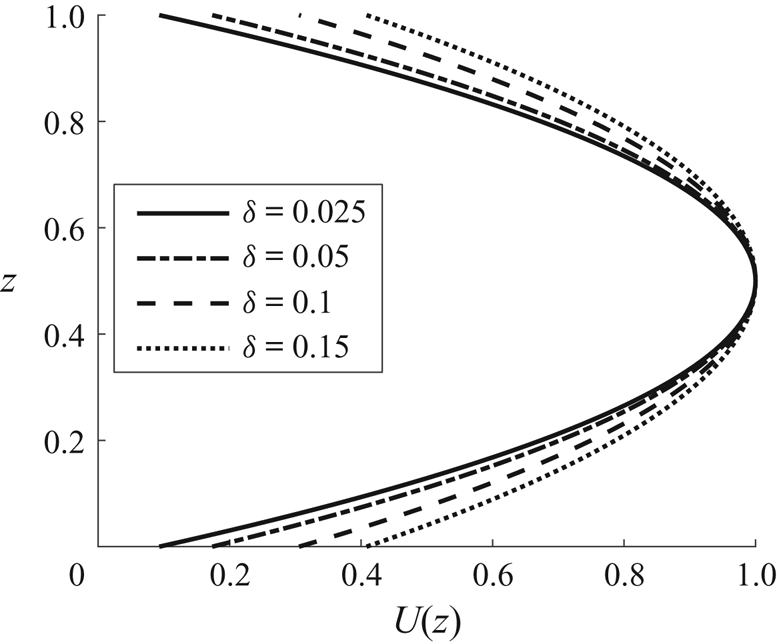
For the flow bounded by walls both above and below, we adopt a parabolic current profile
 \begin{equation} U(z) = 4 [1-\zeta(z)]\zeta(z); \quad \zeta(z) = \frac{z + \delta}{1 + 2\delta}, \end{equation}
representing the laminar flow sketched in figure 12. Numerical integration is employed for the first-order solution.
Parabolic current profile.

We can adjust the relative phase of the upper and lower boundary by allowing the mode amplitudes  $\eta$ to be complex; letting the boundary undulation amplitude be
 $a$ on both boundaries, we shift the phase of the upper boundary an angle
 $\pi + \vartheta$ in the
 $y$-direction by letting
 $\eta _\textrm {b}={a}/4$ and
 $\eta _\textrm {s}=-({a}/4) {\textrm {e}}^{\pm {\textrm {i}}\vartheta }$. We then have
 \begin{equation} \hat\eta_\textrm{s}= \sum_{s_x,s_y=\pm1}{ \left( -\frac{a}4 {\textrm{e}}^{{\textrm{i}} s_y \vartheta} \right) } {\textrm{e}}^{{\textrm{i}} (s_xk_{1x} x + s_yk_{1y} y)}=-a\cos (k_{1x} x) \cos(k_{1y} y+\vartheta), \end{equation}
while the lower boundary  $\hat \eta _\textrm {b}$ is still given by (4.1). Relative wall positions are sketched in figure 13.
Sketch of the relative wall phase shift when looking along the streamwise direction.

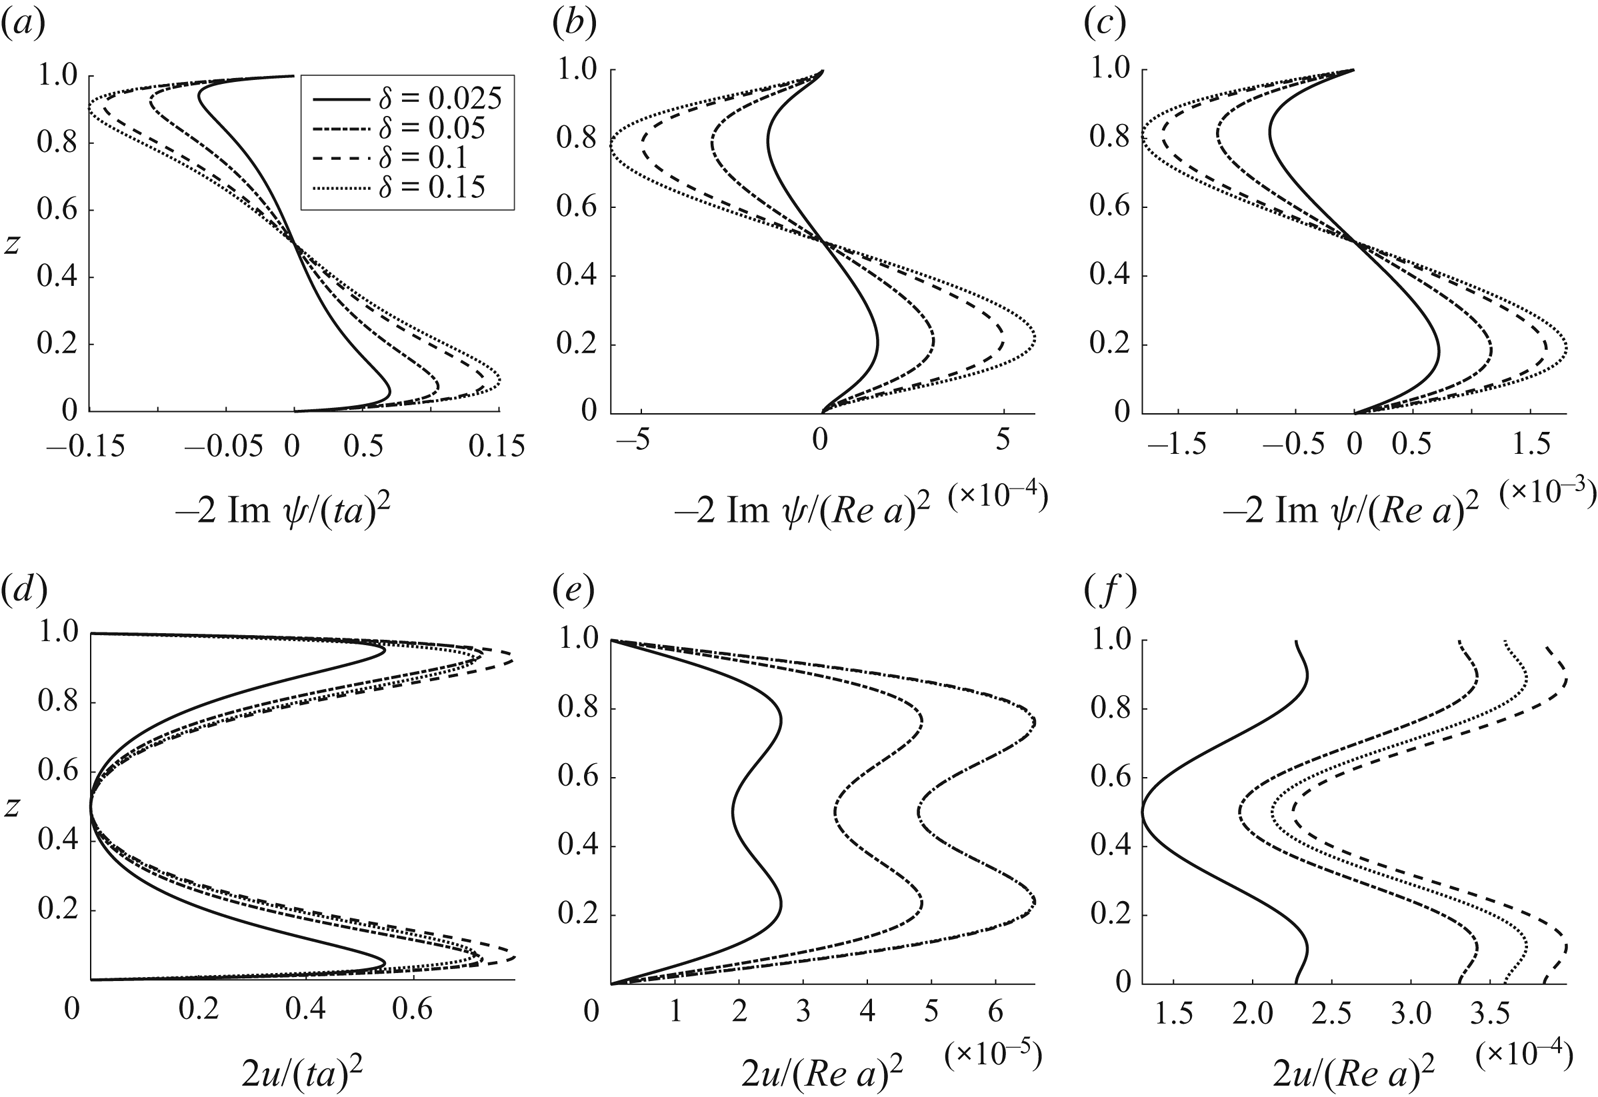
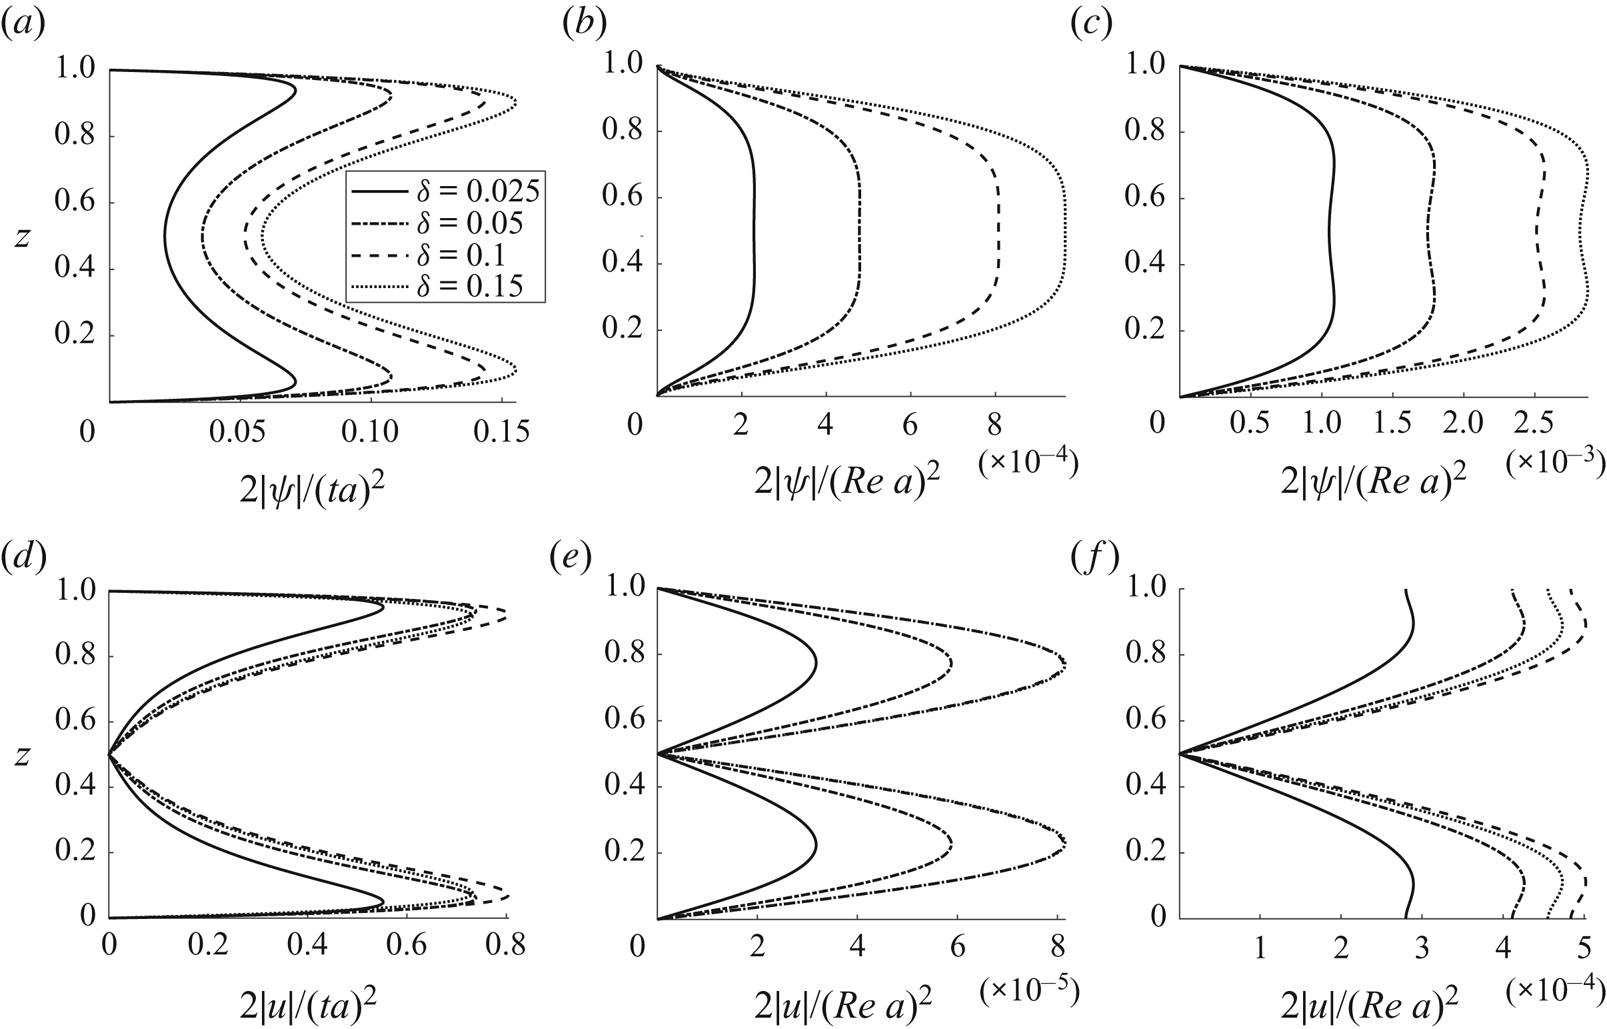
Similar to the previous section, amplitudes of the streamfunction and streamwise velocity component are shown in figures 14 and 15 as functions of  $z$ and
 $\delta$. Functions
 $\psi (z)$ and
 $u(z)$ each have both real and imaginary components whenever
 $\vartheta \neq 0$ due to the spanwise skewness induced (see (4.8)). Absolute values are therefore plotted when
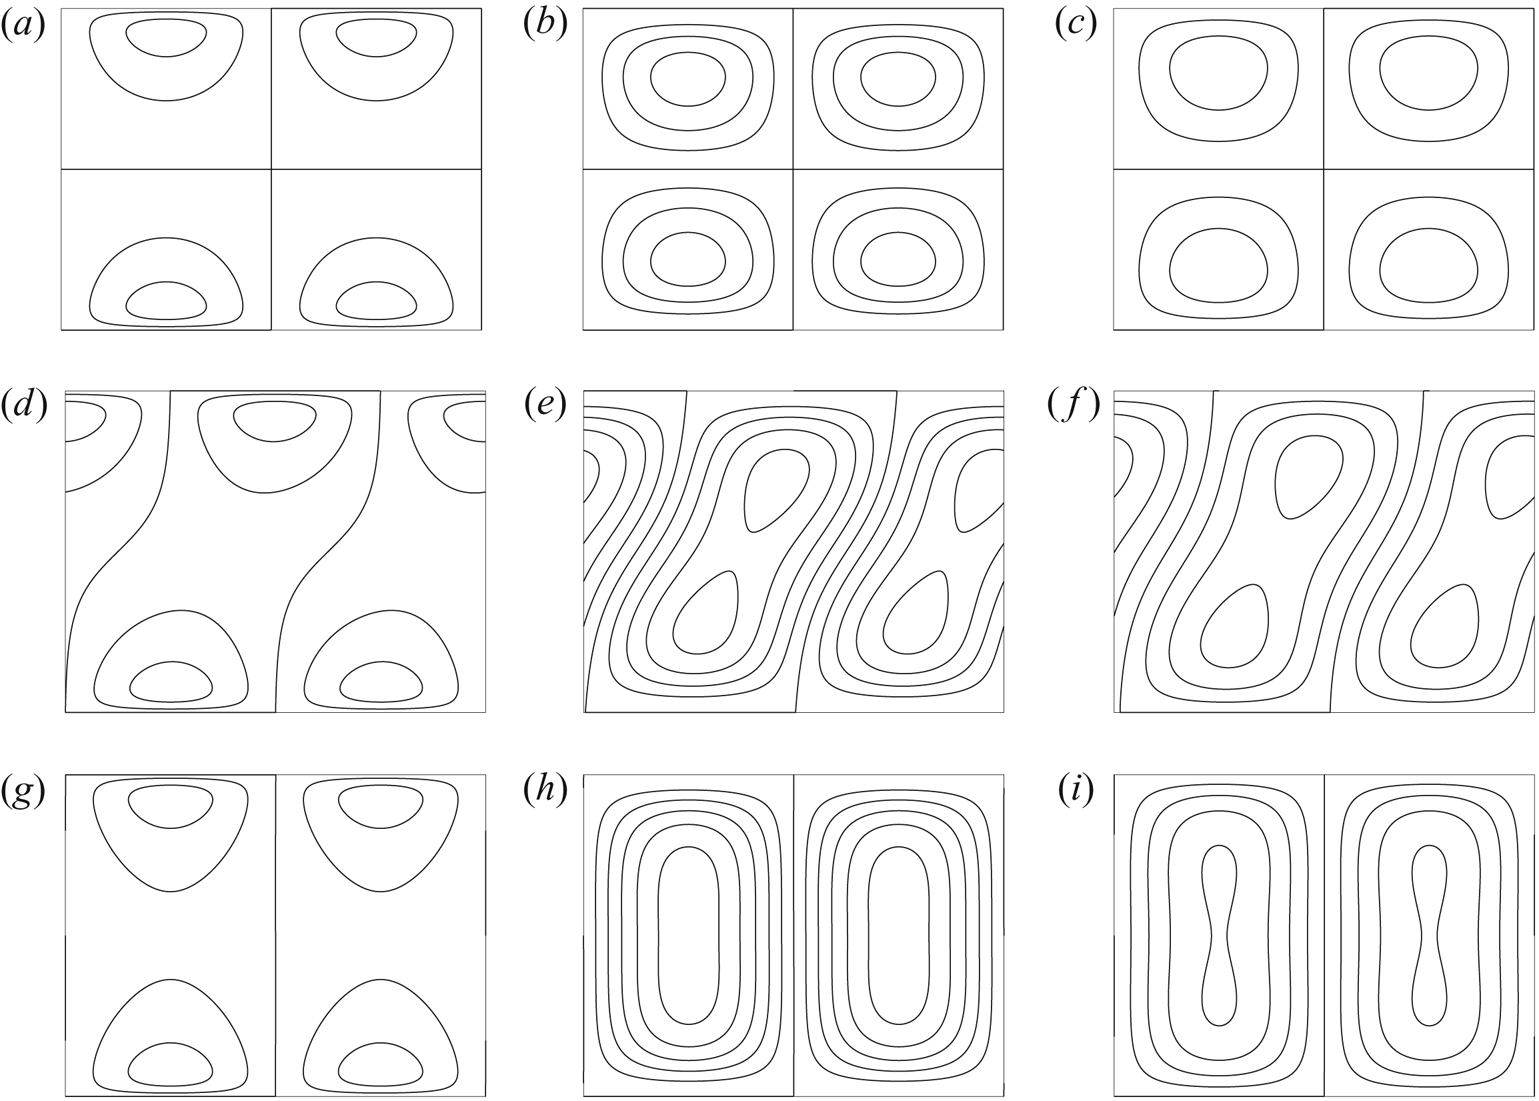
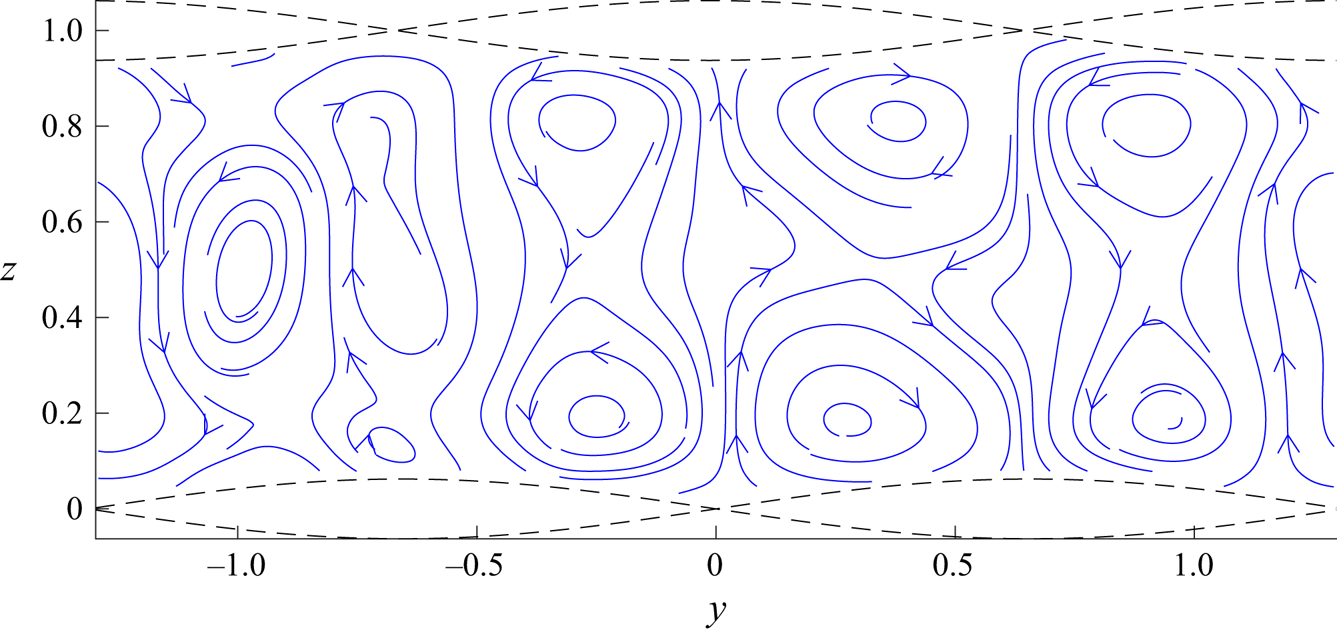
 $\vartheta \neq 0$. Streamlines, as they appear in physical space, are shown in figure 16. Figures 14–16 show that boundaries which are in-phase (
 $\vartheta =0$) generate vertical vortex pairs which rotate in opposite senses, generating horizontal jets in the cross-flow plane along the horizontal plane
 $z=1/2$. Conversely, boundaries which are shifted
 $\vartheta =\pi /2$ generate co-rotating vortex pairs. If sufficiently closely situated, these will negate each other's horizontal flow along the symmetry plane
 $z=1/2$ and merge into a single vortex spanning the cross-section. Such a single vortex generally generates stronger turnover than does a vortex pair. Also, we observe in numerous computations that the closer the vortices are squeezed together (the lower the value of
 $k_1$) the easier they merge into a single vortex spanning the vertical domain – more so for viscous flows than inviscid flows.
A doubly wall-bounded flow. Normalised streamfunction and streamwise velocity perturbation for three values of  $\delta$. Parabolic current profile (figure 12) and a wall-bounded domain with
 $\vartheta =0$ (see figure 13): (a,d) inviscid; (b,e) viscous, no-slip; (c,f) viscous, full-slip. Here
 $k_1 = 2\pi$,
 $\theta =\pi /8$.

Same as figure 14, but with  $\vartheta =\pi /2$: (a,d) inviscid; (b,e) viscous, no-slip; (c,f) viscous, full-slip.

A wall-bounded flow. Streamlines  $\hat \psi = {{\rm constant}}$ for
 $\vartheta =0$ (a–c; cf. figure 14),
 $\vartheta =\pi /4$ (d–f) and
 $\vartheta =\pi /2$ (g–i; cf. figure 15): (a,d,g) inviscid; (b,e,h) viscous, no-slip; (c,f,i) viscous, full-slip. Here
 $\delta = 0.05$ and
 $k_1 = 2\pi$,
 $\theta =\pi /8$.

7. Simulated laminar flow
The perturbation theory presented so far sheds light on the subject of structurally generated Langmuir circulation, yet a vital question still remains to be answered: What happens to the boundary layer? The presence of Langmuir circulation beneath free surfaces is of course well established, but these boundaries allow for a slip velocity whereas flow stagnation takes place at a rigid boundary. Will Langmuir circulation even appear near a no-slip boundary? We have so far circumvented the issue by assuming that the bulk current velocity  $U(z)$ does have some slip velocity at the reference planes
 $z=0,1$. This assumption is perhaps less alien when considering a turbulent boundary layer – assuming a slip governed by the ‘law of the wall’ is a common approach within turbulence modelling – but is not easily justified in laminar flows. We must then consider wall undulation amplitudes that penetrate some depth into the flow field, and these amplitudes must in turn somehow be related to the undulation amplitude
 $a$ and the displacement height
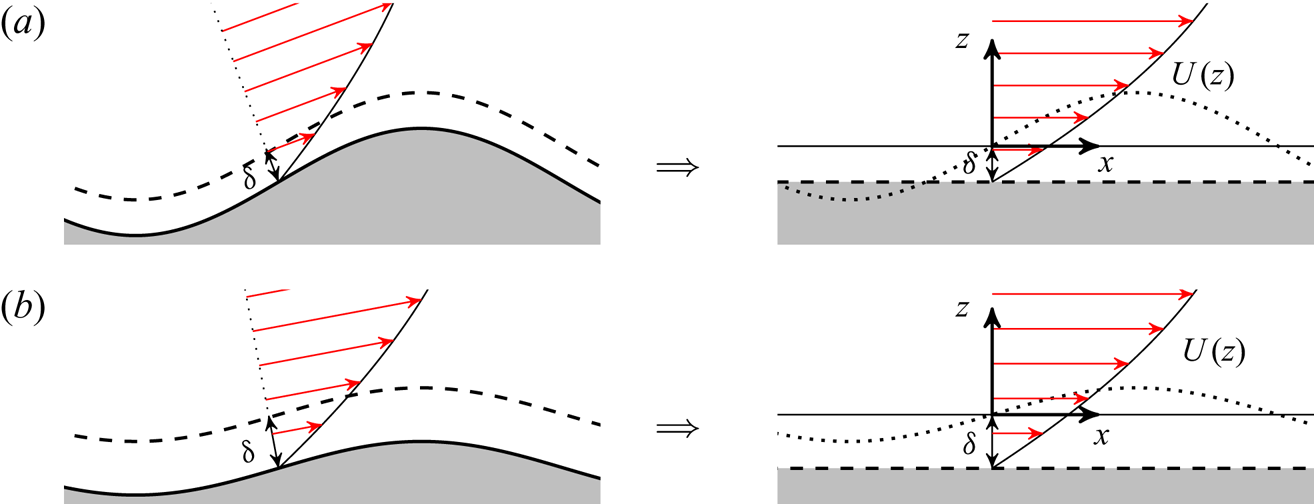
 $\delta$ introduced in the perturbation theory. A sketch is presented in figure 17 where we regard a streamsurface within the flow as the ‘seen’ surface. The closer this surface is to the actual wall (the smaller the
 $\delta$) the more the boundary undulations will resemble the actual known undulation of the wall. Further away the ‘seen’ amplitude will be smaller and less sinusoidal as also the opposing boundary contributes to compress the streamlines. On the other hand, the perturbation theory rests on the assumption that the variation in current velocity across the perturbation is small relative to the velocity at the reference plane, which improves in validity at larger
 $\delta$.
Conceptual representation near the boundary with no-slip at the walls with a slip velocity reference boundary located some distance  $\delta$ within the flow. Streamlines resemble the actual boundary curvature more closely when
 $\delta$ is smaller than the amplitude
 $a$ (a), although this makes the perturbation amplitudes large relative to the assumptions of the linear theory. The situation is the opposite if
 $\delta >a$ (b).

We have at our disposal a code for numerical flow simulations using the lattice–Boltzmann method, with which we have generated simulation results within the laminar flow regime for the purpose of demonstrating that the artefacts of our perturbation theory do in fact manifest in real, nonlinear flows. Although the lattice–Boltzmann method is usually not first choice in terms of accuracy and computational efficiency, it proved easily adaptable to the present problem since the undulated boundaries could be represented simply by marking nodes outside the flow domain as ‘solid’ nodes. The code has been validated against two- and three-dimensional lid-driven cavity flow cases. These benchmarks are presented in the supplementary material available at https://doi.org/10.1017/jfm.2020.490.
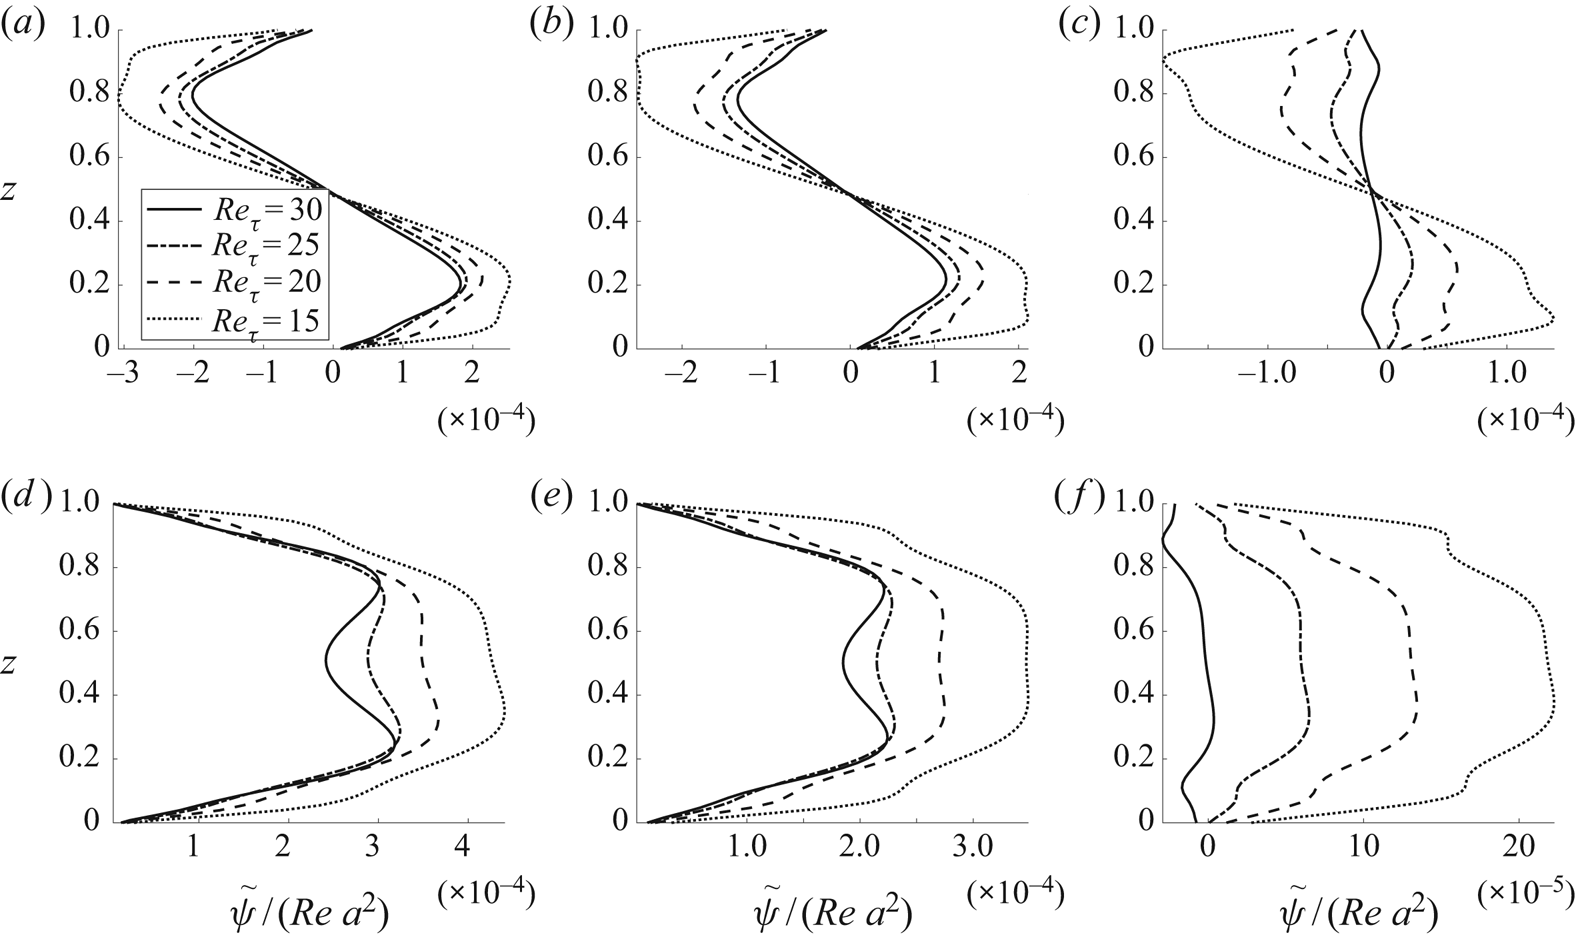
In order to compare the simulated flow field with our theoretical results, we compute an approximation of  $\psi$ from the streamwise averaged velocity field based on the principle of volume flux. Provided the vortices are not skewed (
 $\vartheta$ is a right or straight angle),
 \begin{equation} \tilde\psi(z) = \int_{0}^z \textrm{d} \xi \overline{\hat v}(y_0,\xi),\end{equation}
approximates  $\psi$,
 $\overline {\hat v}$ being the streamwise mean of the spanwise velocity component. Spanwise position
 $y_0$ is the spanwise coordinate of the vortex centre. We here assume
 $y_0=\pi /4k_{1y}$. Simulation results for a range of wall Reynolds numbers
 $Re_\tau = (h/2)u_* /\nu$, where
 $u_*=\sqrt {\tau _{\textrm {w}}/\rho }$, are shown in figures 18 and 19. The wall Reynolds number is here the appropriately fixed parameter (a measure of the flow forcing) and relates to
 $Re=h U_0/\nu$ as
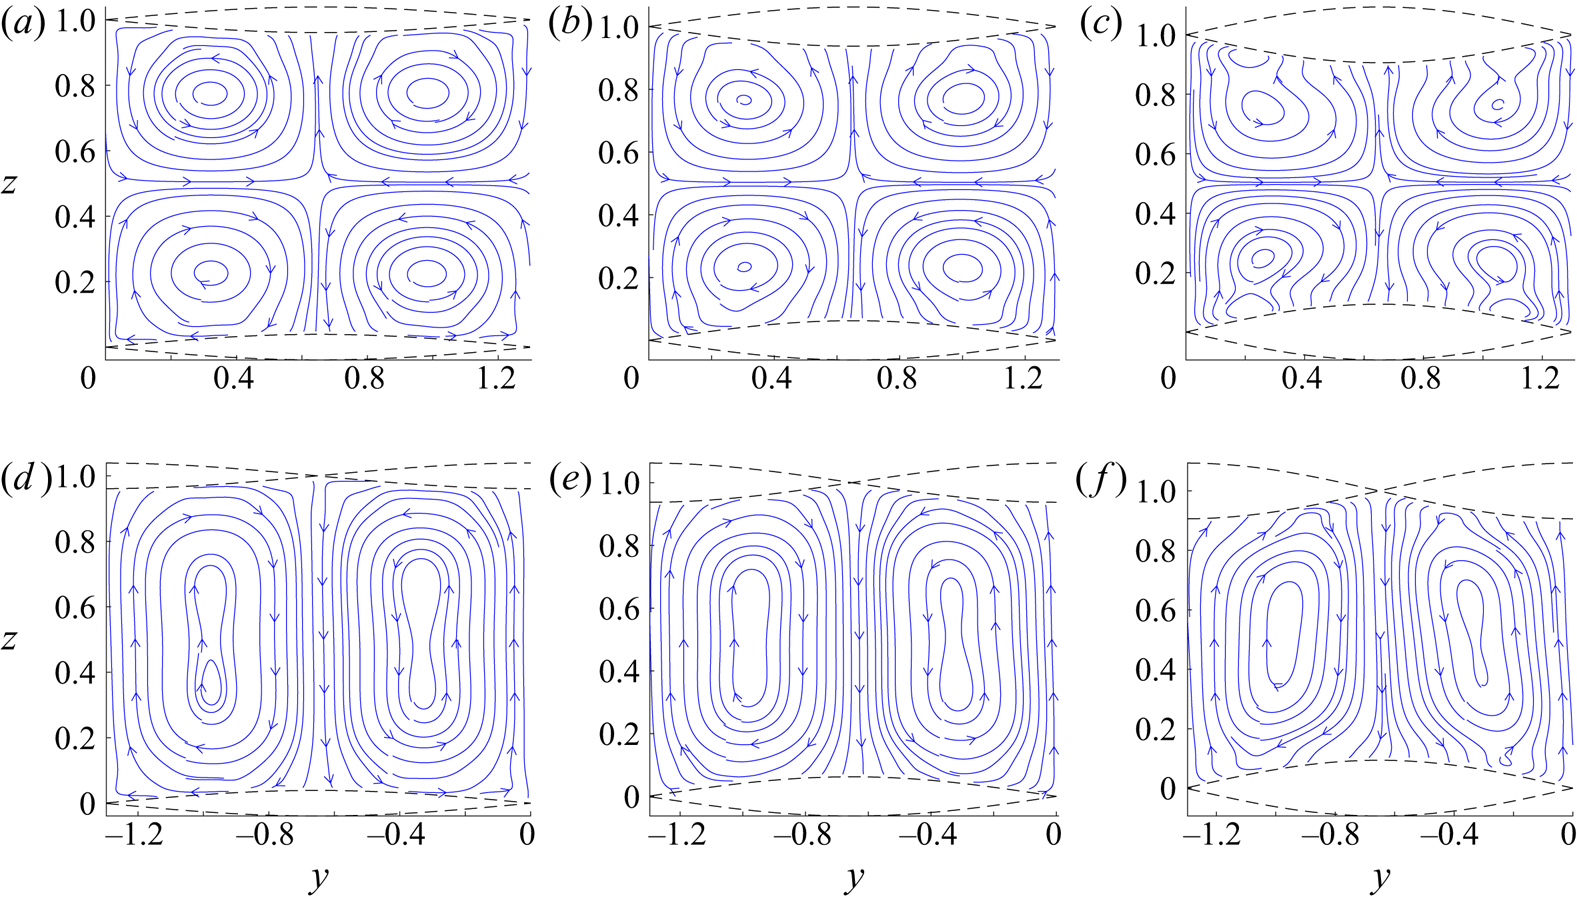
 $Re=Re_\tau ^2$ in the case of flat-walled, laminar Poiseuille flow. The figures show, when compared with the viscous, stationary results of figures 14–16, qualitative agreement between simulation and theory in terms of vortex orientation and rotational direction. Normalised steady-state quantities
 $\hat \psi /(Re\, a^2)$ and
 $\hat u/(Re\, a)^2$ are in the theory invariant to the Reynolds number, although Reynolds number dependency is evident in the simulation results, notably in the
 $\vartheta =\pi /2$ case where the value of the Reynolds number affects the degree to which vortices are merged to cover the cross-sections or exist as separate, co-rotating vortex pairs. It should also be noted that, contrary to the
 $\vartheta =0$ topography, the
 $\vartheta =\pi /2$ topography is not antisymmetric about the horizontal plain
 $z=1/2$. This generates some minor vertical asymmetry in each vortex due to dynamic effects. The asymmetry differs between the four vortices in each spanwise period; we here display the vortex centred at
 $y=\pi /4k_{1y}$.
A double wall-bounded flow. Normalised streamfunctions  $\tilde \psi /(Re\,a^2)$ estimated from the steady states of lattice–Boltzmann simulations using (7.1): (a)
 $\vartheta =0$,
 $a= 0.0391$, (b)
 $\vartheta =0$,
 $a= 0.0625$, (c)
 $\vartheta =0$,
 $a= 0.0938$, (d)
 $\vartheta =\pi /2$,
 $a= 0.0391$, (e)
 $\vartheta =\pi /2$,
 $a= 0.0625$, (f)
 $\vartheta =\pi /2$,
 $a= 0.0938$. Here
 $k_1 \approx 2\pi$,
 $\theta \approx \pi /8$.

Numerically computed streamlines of the two-dimensional velocity field obtained when averaging along the streamwise dimension: (a)  $\vartheta =0$,
 $a = 0.0391$, (b)
 $\vartheta =0$,
 $a = 0.0625$, (c)
 $\vartheta =0$,
 $a = 0.0938$, (d)
 $\vartheta =\pi /2$,
 $a = 0.0391$, (e)
 $\vartheta =\pi /2$,
 $a = 0.0625$, (f)
 $\vartheta =\pi /2$,
 $a = 0.0938$. Here
 $Re_\tau = 20$,
 $k_1 \approx 2\pi$,
 $\theta \approx \pi /8$.

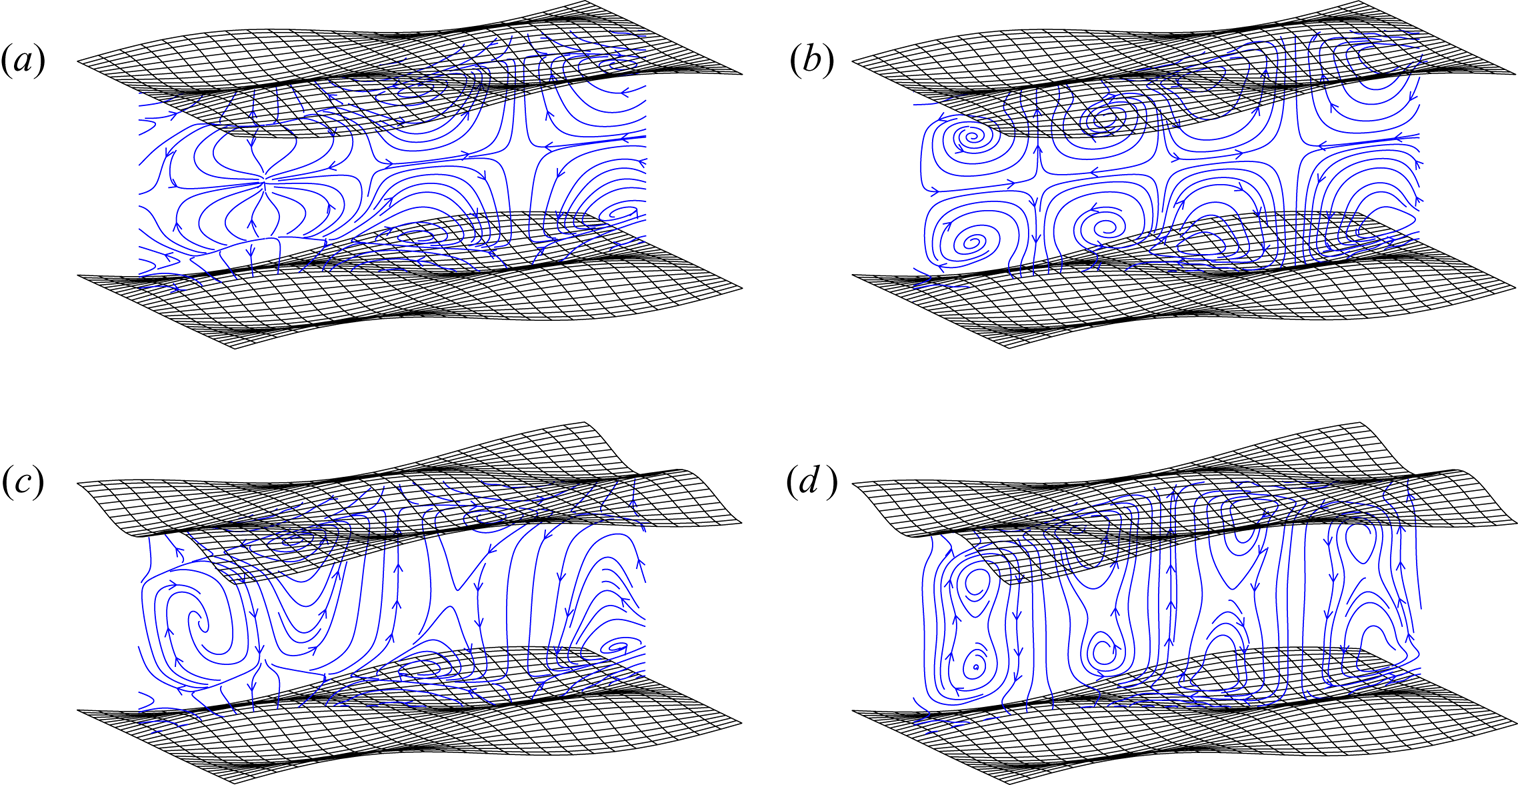
Figure 20 shows slices of the velocity field in the  $yz$-plane at a prescribed
 $x$-location. These are not averaged in the streamwise direction and so give an impression of the circulation strength relative to the first-order undulating motion. In the cases studied, the two types of motion are found to be of the same order of magnitude, with first-order motion dominating near peaks and troughs, and circulation dominating in the intervening regions. The slices shown in the plots of figure 20 are at the somewhat arbitrary location
 $x=\pi /6k_{1x}$. Circulation intensity relative to the undulating motion increases with increasing Reynolds numbers.
Streamline slices of a full three-dimensional flow field: (a)  $Re_\tau =15$,
 $\vartheta =0$, (b)
 $Re_\tau =30$,
 $\vartheta =0$, (c)
 $Re_\tau =15$,
 $\vartheta =\pi /2$, (d)
 $Re_\tau =30$,
 $\vartheta =\pi /2$. Here
 $a\approx 0.0625$,
 $k_1 \approx 2\pi$,
 $\theta \approx \pi /8$. Slice at
 $x=\pi /6k_{1x}$.

Quantitatively, the simulations most closely resemble the no-slip boundary condition cases where the value for  $\delta$ is small. This dependency escalates with increased wall undulation amplitude. For the sake of briefness and clarity, we have not attempted to adjust the simulation parameters to better accommodate our theoretical construct. Indeed, the undulation amplitudes used in the normalisation are the actual amplitudes and not an estimate of the streamsurface amplitudes seen by the flow above some displacement thickness. (Recall that the circulation is theoretically proportional to these amplitudes squared.) Likewise, the duct height
 $h$ is taken as the average distance between the actual walls.
Earlier, in § 6.1, we made the observation that large values of  $\theta$ (i.e. boundary undulations that are stretched out in the streamwise direction rather than the spanwise) can generate vortices which rotate in the opposite direction relative to the boundary topography (pushing fluid away from peaks and troughs as opposed to in towards them). Simulation results for such a case, where
 $\theta = 3\pi /8$ and
 $k_1=\pi$, are presented in figure 21 along with some corresponding theoretical streamfunctions. We observe that the rotation is indeed reversed in the bulk interior of the cross-section (compared with, for example, figure 18), although thin additional vortices appear close to the walls which still rotate in an unreversed direction. This may be an artefact of the dynamic stresses caused by the undulating boundaries which has not been incorporated into our kinematic theory. (The only means with which other harmonics are filtered out field is through averaging in the streamwise direction.) Viscosity serves to modify the first-order wave field and give a spanwise perturbation to the primary flow. Dynamic effects may generate circulation with its own rotational preference, as observed in turbulent flows by Anderson et al. (Reference Anderson, Barros, Christensen and Awasthi2015), Chan et al. (Reference Chan, MacDonald, Chung, Hutchins and Ooi2018), Yang & Anderson (Reference Yang and Anderson2018), Vanderwel & Ganapathisubramani (Reference Vanderwel and Ganapathisubramani2015) and Kevin et al. (Reference Kevin, Monty, Bai, Pathikonda, Nugroho, Barros, Christensen and Hutchins2017). Presumably, a dynamic rotational effect is always present, either assisting or impeding the Langmuir circulation.
‘Rotating the boundary topography’;  $\theta = 3\pi /8$. This will, according to theory, cause rotation in the opposite direction relative to the boundary undulations. Here
 $k_1=\pi$,
 $\vartheta = 0$. (a) Theoretical, viscous, no-slip and (b) simulated,
 $a = 0.0625$.

Secondary vortex motion, aligned with the flow, can be generated via spanwise intermittent roughness patches (Willingham et al. Reference Willingham, Anderson, Christensen and Barros2014; Anderson et al. Reference Anderson, Barros, Christensen and Awasthi2015) or streamwise-aligned obstacles (Sirovich & Karlsson Reference Sirovich and Karlsson1997; Vanderwel & Ganapathisubramani Reference Vanderwel and Ganapathisubramani2015; Kevin et al. Reference Kevin, Monty, Bai, Pathikonda, Nugroho, Barros, Christensen and Hutchins2017; Yang & Anderson Reference Yang and Anderson2018). Anderson et al. (Reference Anderson, Barros, Christensen and Awasthi2015) demonstrated that these structures are related to Prandtl's secondary flow of the second kind, driven and sustained by spatial gradients in the Reynolds-stress components.
Our simulations start showing signs of vortex instability at wall Reynolds numbers above 30. An example is shown in figure 22. The degree of instability also increases with increased boundary undulation amplitude and seems more unstable for  $\vartheta =\pi /2$ than
 $\vartheta =0$ as the former generate vortices which are more stretched out over the cross-section. Vortex instability manifests as the spawning of higher wavenumber vortices. These are naturally less steady as the Reynolds number increases. Longitudinal vortex instability is a well-studied phenomenon since their discovery by Craik (Reference Craik1977), and their effect on strongly sheared flows such as those considered here thoroughly investigated by Phillips and co-workers (Phillips & Wu Reference Phillips and Wu1994; Phillips & Shen Reference Phillips and Shen1996; Phillips et al. Reference Phillips, Wu and Lumley1996; Phillips& Dai Reference Phillips and Dai2014). Vortex instability is likely to play a decisive role in the evolution of flows over undulating topographies as we move towards the turbulent regime.
Unstable vortex field:  $Re_\tau = 40$,
 $\vartheta =\pi /2$,
 $\theta = \pi /8$,
 $k_1 = 2\pi$.

8. Summary and closing remarks
We have studied the creation of streamwise vortices in shear flows over a wall with a particular topography. The roll-like flow structures are closely analogous to Langmuir circulation created through a strong shear ‘CL1’-type mechanism for the algebraic instability of longitudinal vortices. Instead of a shear flow beneath the wavy free surface normally associated with Langmuir circulation, the same mechanism can be imposed on a flow by furnishing walls with a criss-crossing wavy pattern. Under sufficient influence of viscosity, the flow structures due to the CL1 instability will stabilise and form coherent longitudinal vortices whose transverse size matches the wavelength of the chosen wall topography. This mode of circulation requires no external forcing other than maintaining the ambient shear flow, but functions by redirecting the vorticity inherently present in the current itself.
Assuming a shear profile of arbitrary form  $U(z)$ when unperturbed, a resonant wave–current interaction is computed in two limiting cases: transient inviscid circulation and steady-state viscous circulation. The vortical motion in the cross-flow plane grows proportional to
 $a^2 t$ in the early, essentially inviscid stage (
 $a$, wave-pattern amplitude;
 $t$: time), and is proportional to
 $Re\,a^2$ in the latter, viscous steady state. The instability is algebraic in nature, growing linearly with time in the former case and to the Reynolds number in the latter. The streamwise velocity perturbations are respectively proportional to these quantities squared.
After the onset of the instability, at first purely kinematically driven and essentially inviscid, viscosity serves to push the vortex centres out away form the undulating boundaries. Vortex intensity is observed to be greatest in the wavelength range where vortex height and width are comparable. Circulation is also typically strongest when the half-angle  $\theta$ between the crossing plane waves making up the sinusoidal wall corrugations lies in the range
 $10^\circ <\theta <25^\circ$. A reversal of the direction of circulation is possible within the range
 $\theta >45^\circ$, albeit with weaker rotation strength. Several weak vortices can coexist vertically in the region where this switch of rotational direction takes place. For a channel flow between two similarly corrugated walls, the circulation generated near each wall can merge into single vortices spanning the cross-section, provided the two boundaries are suitably shifted relative to each other. Such a merger is more pronounced the closer the boundaries are situated relative to vortex wavelength.
The investigation has been supplemented with laminar flow simulations using a lattice–Boltzmann method. These simulations show that the forced circulation phenomenon does indeed take place also in laminar flows over no-slip boundaries, and that the resulting circulation is qualitatively similar to the results of the perturbation theory even though the latter conceptually assumes a current velocity at the walls. The laminar simulations furthermore show that circulation is quickly established relative to the time it takes for the primary flow to stabilise. The circulation intensity is comparable to the intensity of the first-order motion. Dynamic effects, excluded from the theoretical model, were here also observed in near-wall regions. Quantitatively, a degree of uncertainty is related to the closure assumption of a displacement height  $\delta$ adopted in the theory.
The practical potential of the mechanism here studied is as yet unexplored and subject to conjecture. Literature, as presented in § 1, suggests that longitudinal vortices can be beneficial in terms of turbulent drag reduction, although the divers mechanisms hitherto employed to create such vortices differ fundamentally from the Langmuir mechanism suggested herein. Therefore, studies of the continued development of CL1-type Langmuir circulation in the turbulent regime are desirable, particularly regarding the stability of the generated structures for increasing Reynolds numbers. The optimal scale of induced Langmuir vortices is an open question as vortices could be made to exist either as a tiny structure deep within the boundary layer, or as large structures reaching into the bulk of the flow, depending on the scale of the wall undulations. As indicated by the literature, tiny vortex structures could conceivably act to stabilise the transition to turbulence while large vortices could act to reduce drag in flows which are already fully turbulent.
Acknowledgements
The authors are grateful to the anonymous reviewers, one of whom in particular, for extensive contributions to this text. This work was funded by the Research Council of Norway (programme FRINATEK), grant number 249740.
Declaration of interests
The authors report no conflict of interest.
Supplementary material
Supplementary material is available at https://doi.org/10.1017/jfm.2020.490.
Appendix A. Integration constants for the viscous steady-state problem
Determining the integration coefficients in (4.14) subject to the full-slip/full-slip boundary conditions,  $w(0)=w''(0)=w(1)=w''(1)=0$, yields
 \begin{equation} w(z) = - \frac{2\kappa w_{\times}(1)- \nabla^2 w_{\times}(1)\coth\kappa}{2\kappa\sinh\kappa} \sinh \kappa z -\frac{\nabla^2 w_{\times}(1)}{2\kappa\sinh\kappa} z \cosh \kappa z+ w_{\times}(z), \end{equation}
where  $\nabla ^2 w_{\times } = w_{\times }''-\kappa ^2w_{\times }$. We have combined the
 $\exp (\pm \kappa z)$ terms in (4.14) into hyperbolic functions. Subjected to the no-slip/no-slip conditions,
 $w(0)=w'(0)=w(1)=w'(1)=0$, (4.14) reads as
 \begin{align} w(z) &= \frac{(\kappa \cosh\kappa + \sinh\kappa) \sinh\kappa z - \kappa z [\kappa \cosh \kappa(1-z) + \sinh \kappa \cosh \kappa z] }{\kappa^2-\sinh^2 \kappa} w_{\times}(1) \nonumber\\ &\quad +\frac{\kappa z \sinh \kappa(1-z) - (1-z)\sinh\kappa\sinh\kappa z }{\kappa^2-\sinh^2 \kappa}w_{\times}'(1) + w_{\times}(z). \end{align}
Mixed conditions, with no-slip at the lower boundary and full-slip at the upper,  $w(0)=w'(0)=w(1)=w''(1)=0$, gives
 \begin{align} w(z) &= \frac{\cosh\kappa\sinh\kappa z - \kappa z \cosh \kappa(1-z) }{\kappa-\cosh \kappa \sinh\kappa}w_{\times}(1) \nonumber\\ &\quad -\frac{\kappa(1-z)\sinh\kappa\sinh\kappa z-\kappa^2z\sinh\kappa(1-z)}{\kappa-\cosh \kappa \sinh\kappa}\frac{\nabla^2 w_{\times}(1)}{2\kappa^2}+ w_{\times}(z). \end{align}
Derivatives of  $w_{\times }(z)\,$ are, from (4.15a,b) and Leibnitz's rule,
 \begin{equation} w_{\times}^{(n)}(z)\, = \frac{Re}{2\kappa^3 }\int_0^z \textrm{d} \xi \mathcal{R}(\xi)\, \kappa^n G^{(n)}[ \kappa (z-\xi)];\quad [n=0,1,2,3] \end{equation}
since  $G^{(n)}(0) = 0$ for
 $n\leq 3$. Parenthesised superscript is here the derivative order.
Finally, horizontal velocity components (4.18) subjected to the full-slip condition  $u'(0)=u'(1)=0$, no-slip condition
 $u(0)=u(1)=0$ or mixed condition
 $u(0)=u' (1)=0$ get the homogeneous part:
 \begin{equation} \sum_\pm d_u^\pm {\textrm{e}}^{\pm\kappa z} = -\frac{Re}{\kappa}\int_0^1 \textrm{d} \xi U'(\xi) w(\xi) \times\begin{cases} \dfrac{\cosh\kappa(1-\xi)}{\sinh\kappa} \cosh\kappa z; & [\text{full-slip}],\\ \dfrac{\sinh\kappa(1-\xi)}{\sinh\kappa} \sinh\kappa z; & [\text{no-slip}],\\ \dfrac{\cosh\kappa(1-\xi)}{\cosh\kappa} \sinh\kappa z; & [\text{mixed}]. \end{cases} \end{equation}
The spanwise velocity component  $v$ is the
 $z$-derivative of the streamfunction (in either real or wave space) while the pressure can most easily be retrieved from the spanwise momentum, yielding
 \begin{equation} p = -\frac{1}{\kappa^2}(\partial_t-Re^{-1}\nabla^2)w' -\frac{(k_{1x}^2-k_{1y}^2)p_1^2+(p_1')^2}{k_{1x}^2U^2}.\end{equation}
This is an explicit expression with necessary  $w$-derivatives given by (A 2).