I. INTRODUCTION
Gallium nitride is an attractive material for high-power electronics because it has a large critical field, E C = 3.5 MV/cm,Reference Zolper1 and a reasonably high low-field mobility, μ = 930 cm2/V·s.Reference Saitoh, Sumiyoshi, Okada, Horii, Miyazaki, Shiomi, Ueno, Katayama, Kiyama and Nakamura2 These values compare favorably with those of SiC, where E C = 2.5 MV/cm (Ref. 3) and μ = 900 cm2/V·s.Reference Choyke and Pensl4 Seemingly small differences can be magnified by the specific on-resistance, R SP·ON = 4V b2/εμE C3, where a 40% increase in E C can lead to an almost 3-fold lower R SP·ON because of the cubic dependence. V b is the breakdown voltage. The factor εμE C3 is an important factor in high-power electronics, and it is often referred to as the Baliga figure of merit (FOM).Reference Baliga5
However, this assumes that breakdown will occur by avalanche breakdown in a uniformly doped active layer, usually a low-doped epitaxial film. Because most GaN films are grown heteroepitaxially on SiC or sapphire wafers, they usually contain 109–1010 dislocations/cm.2, Reference Vennéguès, Beaumont, Haffouz, Vaille and Gibart6 Some have suggested dislocations create states in the energy gap that can cause premature breakdown,Reference Northrup7 while others have suggested that the premature breakdown is caused by dopants decorating the dislocations and increasing the local electric field.Reference Arslan and Browning8 Point defects can also create states in the band gap that cause premature breakdown, and they can also create traps making it difficult to achieve the low doping, nd – na, required to achieve the desired V b. Background carbon from trimethyl gallium (TMGa) can be an issue because premature decomposition of the methyl groups is more likely to occur at the higher temperatures, 1000–1100 °C, used to grow GaN films.
In this article, we investigate the latter issues by fabricating and testing GaN Schottky diodes (SDs) primarily using GaN films grown by metalorganic chemical vapor deposition (MOCVD) on sapphire substrates. This is done by determining the net carrier concentration using capacitance–voltage (C–V) measurements and determining R SP·ON; the turn-on voltage, V ON, when the forward current density J F = 100 A/cm2; the barrier height, φ B; ideality factor, n; and V b from the current–voltage (I–V) measurements. The background C concentration, which is measured using secondary ion mass spectroscopy (SIMS), is varied by changing the growth pressure for the MOCVD grown films, and to a lesser extent by varying the V/III ratio.
II. EXPERIMENTAL PROCEDURE
The initial set of GaN films was grown unintentionally doped (UID) by MOCVD at a growth pressure of 100 Torr, growth temperature of 1050 °C, and a V/III ratio of 3200. Most of the films were grown on sapphire wafers, but a few were grown on GaN substrates that were prepared by growing thick GaN films using the hydride vapor phase epitaxy (HVPE) technique. One film was also purposely Si-doped using 5 ppm SiH4 at the lowest possible flow rate of ¼ sccm. Another set of films was grown at different pressures—100, 300, 500, and 650 Torr. The flow rates were approximately twice as large as those used in the initial experiments so that the growth parameters could be the same for all of the pressures, and the V/III ratio was 3525. The diode structures grown on sapphire were composed of a low-temperature GaN nucleation layer followed by 3 μm of highly doped n+ GaN using silane as the dopant source and a 5-μm UID layer. The films grown on the GaN substrates did not have a low-temperature nucleation layer. Films grown at Sandia and Penn State under conditions similar to those used for the lower flow rates were also obtained for the study. Atomic force microscopy was used to record the topology of the films primarily by measuring their root mean square surface roughness over 5 × 5 μm2 areas, and x-ray diffraction was used to monitor the crystal quality by measuring the full width at half maximum of the symmetric (0002) and asymmetric (10 2) rocking curves. The peaks were measured at four different points of each quarter of the 2’’ wafer. SIMS analysis was performed to track the incorporation of impurities where concentrations were averaged from a depth of 0.5 to 2 μm.
Front-side SDs with diameters of 30, 90, 185 or 280 μm metal anodes on 50, 100, 200, or 300 μm, respectively, etched mesas were fabricated on ¼ of a 2-inch sapphire wafer. A Cr/Ni etch mask was fabricated using standard lithography and lift-off techniques. Mesa structures were formed by inductively coupled plasma etching using a BCl3/CL2/Ar plasma chemistry. Heights of the vertical mesas were ∼6 μm. Standard photolithography, metal electron beam evaporation, and lift-off techniques were used to form the ohmic contacts consisting of Ti/Al/Ni/Au (300/1200/500/200 Å). Ohmic contacts were then rapid thermal annealed in nitrogen gas at a temperature of 750 °C for 30 s. The Schottky contacts were Ni/Au (500/1500 Å) fabricated using the same lift-off methods.
Capacitance–voltage (C–V) measurements were performed to determine the carrier concentration. I–V characteristics were measured with a probe station using both a semiconductor parameter analyzer for forward voltages and reverse voltages up to 100 V, and a curve tracer was used for reverse voltages >100 V. Most of the measurements were made at room temperature, but a few were made at elevated temperatures. Parameters such as the turn-on voltage, specific on-resistance, ideality factor, barrier height, and breakdown voltage were extracted from the I–V curves using standard linear curve fitting techniques to the diode equation, where the analysis is outlined elsewhere.Reference Sze and Ng9
III. RESULTS AND DISCUSSION
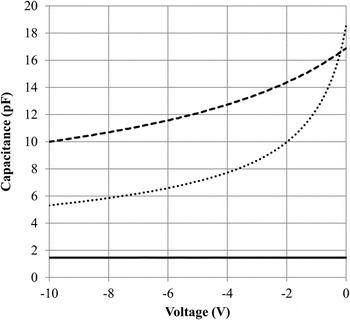
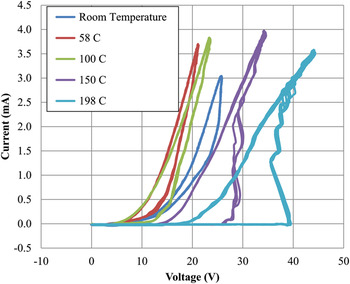
C–V results for diodes fabricated from films grown at 100 Torr on sapphire are presented in Fig. 1. The curve is a horizontal line indicative of a parallel plate capacitor with a capacitance of 1.4 pF, suggesting there are no mobile carriers or the drift region is fully depleted, and the film is insulating. Using the dielectric constant of GaN (10.4), the area of the diode (6.16 × 10⁻⁸ m2), and the thickness of the drift region (5.1 μm), we calculate a capacitance of 1.1 pF. Forward I–V curves for a typical diode fabricated on this film and measured at different temperatures using the alternating current polarity mode are shown in Fig. 2. Both the turn-on voltage and forward on-resistance are unusually high, and the I–V curves show a hysteresis. The measurements made at the lower temperature also show a “snap-back” effect each time the device is measured. That is, the initial turn-on voltage is larger than the voltage required to keep the diode turned on. For example, it could take a voltage of ∼40 V to turn on the diodes, and then it “snaps back” to a turn-on voltage of ∼10 V. The process is reversible in that when the same diode is retested, this snap-back effect is observed once again, suggesting this is a characteristic of the material, as opposed to a burn-in effect of the measurement. The hysteresis accompanying the snap-back effect suggests the filling of trap states must occur before the diode turns-on. These effects were also observed for diodes fabricated on films grown at Penn State and Sandia, so it is an inherent problem and not one associated with particular MOCVD growth systems. The effects were observed if the drift layer was grown on a GaN template prepared earlier by depositing a low-temperature nucleation layer and then growing a 1- to 2-μm GaN film at the normal growth temperature, so it is not likely that contaminants incorporated or deposited in the growth chamber during the low-temperature growth are responsible for them. We observed these effects for films grown at a number of institutions on HVPE GaN substrates; thus it is not likely they can be contributed solely to dislocations.
Capacitance–voltage (C–V) curves for samples grown at 100 Torr with a UID drift region (–), 100 Torr with a drift region doped with 0.25 sccm silane (·····), and 500 Torr with a UID drift region (----).

Forward current–voltage (I–V) curves for the Schottky diodes with films grown at 100 Torr at the lower flow rates.

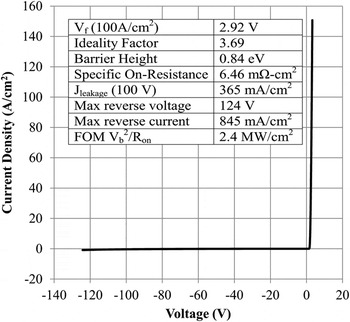
The lightly doped film was conducting, as is indicated by the C–V curve shown in Fig. 1. The I–V curve of a characteristic diode shown in Fig. 3 does not display a hysteresis/snap-back effect, but it did have an unusually high ideality factor of 3.69. Given that the net carrier concentration was 5.2 × 1016 cm−3, the breakdown voltage of 124 V is relatively low, the specific on-resistance of 6.46 mΩ·cm2 is high, and the resulting FOM of 2.4 MW/cm2 is low. Although lightly doping the drift region did remove the hysteresis/snap-back turn-on of the UID 100 Torr drift region diodes, it did not solve the underlying problem.
I–V curve for a typical Schottky rectifier with an intentionally doped drift region.

These results can be explained by the existence of electron traps. In the UID material grown at 100 Torr, the trap concentration exceeds the net background donor concentration creating a semi-insulating material. When a large forward voltage is applied, the trapped electrons can tunnel to the conduction band and snap the diode on. It will remain “snapped-on” until the forward voltage is turned off and the emptied traps fill back up.
A likely candidate for the electron traps is carbon with the likely source being carbon from the methyl groups in TMGa that decompose at the high growth temperatures required for the growth of GaN. This interpretation is supported by the work of Seager et al.Reference Seager, Wright, Yu and Gotz10 who saw similar effects when they increased the carbon concentration in silicon-doped films by reducing the growth pressure. Also, Hashimoto et al.Reference Hashimoto, Yoshizumi, Tanabe and Kiyama11 found that the diode current dropped off faster with a decrease in the silicon doping concentration in their GaN SDs fabricated on films grown on sapphire than it did on films grown on GaN HVPE substrates. They attributed this to carbon being more readily incorporated in GaN on a nitrogen site in the more defective films. Recently, Lyons et al.Reference Lyons, Janotti and Van de Walle12 determined through hybrid functional calculations that under n-type conditions carbon will occupy a nitrogen site and act as a deep acceptor 0.90 eV above the valence band. It has been shown in great detail that carbon does become incorporated in MOCVD-grown GaN in the range of 1016–1017 cm−3 under normal growth conditions and that its rate of incorporation decreases as the growth temperature, growth pressure, or NH3 flow rate increases.Reference Koleske, Wickenden, Henry and Twigg13
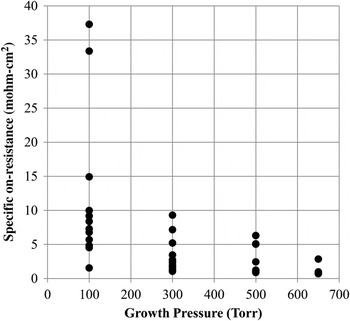
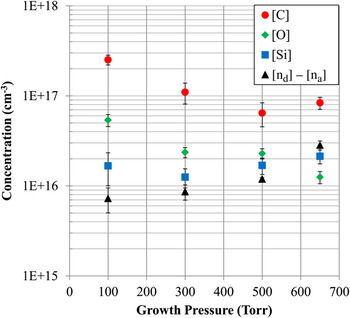
Diodes fabricated from the films grown at the higher flow rates and V/III ratio did not demonstrate hysteresis or the snap-on effect even when the films were grown at 100 Torr, indicating that the UID n-type doping concentration was greater than the electron trap concentration. The electron trap concentration appears to decrease with increasing growth pressure as is indicated in Fig. 4 by the reduction of R SP·ON with increasing growth pressures for the 90-μm-diameter diodes. Even though there is considerable scatter in the data, the trend is clear. This is consistent with the increase in the average net carrier concentration with increasing growth pressure shown in Fig. 5, where the values are 0.73, 0.86, 1.19, and 2.83 × 1016 cm−3 for the films grown, respectively, at 100, 300, 500, and 650 Torr.
The specific on-resistance plotted as a function of the growth pressure for the 90-μm diodes fabricated on films grown at the higher flow rates.

The carbon, silicon, and oxygen concentrations as determined by secondary ion mass spectroscopy and the average carrier concentration as determined by C–V for films grown at 100, 300 500, and 650 Torr.

The carbon concentration in Fig. 5 generally drops with increasing growth pressure as expected, but, interestingly, it is always greater than the sum of the silicon and oxygen concentration, also shown in Fig. 5, which are the likely UID n-type dopants (another likely donor VN was not measured). This implies that not all of the carbon occupies nitrogen sites acting as an acceptor. WrightReference Wright14 predicted that carbon can occupy an interstitial site generating midgap defect states. Also, Seager et al.Reference Seager, Wright, Yu and Gotz10 suggest that carbon can be a shallow donor occupying gallium sites. In all of these studies, the equilibrium site for the carbon is highly dependent on the location of the Fermi energy with the nitrogen site being favored in n-type material. If this is truly the case and the carbon concentration always exceeds 1016 cm−3, then it will be difficult to obtain controlled n-doping levels below this value unless the occupation state can be controlled kinetically.Reference Armstrong, Poblenz, Green, Mishra, Speck and Ringel15 This, in turn, will limit the maximum breakdown voltage in SDs fabricated from MOCVD-grown films to ∼1200 V.Reference Saitoh, Sumiyoshi, Okada, Horii, Miyazaki, Shiomi, Ueno, Katayama, Kiyama and Nakamura2 This assumes that the deep acceptor sites produced by the carbon do not themselves have a degrading effect on V b. Given that Bandic et al.Reference Bandic, Bridger, Piquette, McGill, Vaudo and Redwing16 and Zhou et al.Reference Zhou, Wang, Ahyi, Tin, Williams, Park, Williams and Hanser17 have found that comparably doped HVPE material with smaller dislocation concentrations has significantly larger V b and that has been our experience also, it appears that they do, in fact, have a degrading effect.
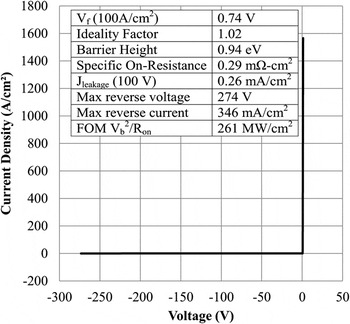
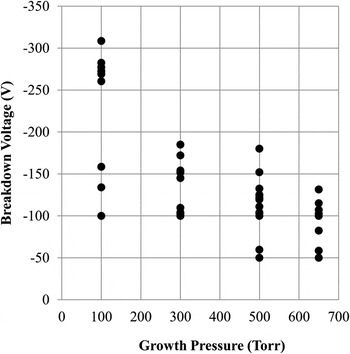
The I–V curve of a typical 30-μm diode grown at 500 Torr is displayed in Fig. 6 along with its electrical characteristics where it is seen that V b = 274 V and R SP·ON = 0.29 mΩ·cm2. Given that the carrier concentration is 1.2 × 1016 cm−3 as determined from the C–V curve in Fig. 1, Vb is disappointingly low. The V b for the 90-μm diodes grown at the higher flow rates and different pressures are shown in Fig. 7; again there is much scatter, but there is a clear trend. The average value of V b decreases as the growth pressure increases—the values are 188, 127, 113, and 99 V for the pressures 100, 300, 500, and 650 Torr, respectively—but they do not decrease as fast as predicted for the ideal diode for the carrier concentrations that were measured. Using 99 V as the base, the V b ratios are 1.90:1.28:1.14:1. The same ratios predicted by theory, given the measured carrier concentration, are 3.88:3.29:2.38:1 since V b is inversely proportional to nd – na. Evidence suggesting that diodes fabricated from the films grown at the higher pressures are superior is also reflected in the average FOMs, which are 5.63, 7.72, 9.52, and 12.03 MW/cm2 for the same four pressures. The diode ideality factor is also indicative of device quality, and its average values for the same four pressures are 1.82, 1.17, 1.10, and 1.12.
I–V curve for a typical 30-μm Schottky rectifier with drift layer grown at 500 Torr.

The breakdown voltages for the 90-μm diodes fabricated on films grown at higher flow rates at the different pressures.

Although carbon can account for some of the degradation in V b, it cannot account for all of it, as dislocations also contribute. Although it is not possible to quantitatively separate out the effects of carbon and the dislocations, one can see that qualitatively dislocations also have a debilitating effect. The variation in their concentration over the width of the diode can account for the large scatter in the measured values of V b shown in Fig. 7 and RSP·ON in Fig. 4. It will be difficult to separate out the effects of the carbon and the dislocations, as Hashimoto et al.Reference Hashimoto, Yoshizumi, Tanabe and Kiyama11 have shown that more carbon is incorporated in GaN films containing more dislocations. If the carbon is incorporated in the dislocation core, it is likely that its electrical properties are different than they would be, if it was located in the bulk. It could, in fact, account for the carbon concentration being larger than the donor concentration and yet the material is conductive, if the carbon tied up in the dislocation cores is not electrically active.
In addition to varying the carbon concentration, changing the pressure affects the growth properties and therefore can affect the topology and crystalline quality of the films. They, in turn, can affect the properties of the diodes as well. The average surface roughness increased slightly with the growth pressure from 0.196 to 0.226 to 0.219 to 0.229 nm as the pressure was increased from 100 to 300 to 500 to 650 Torr, respectively, which does not appear to be significant. On the other hand, the average symmetric (0002) x-ray rocking curve peak widths increased with the growth pressure from 247’’ to 310’’ to 332’’ to 339’’ for the same pressures. This could be due to the formation of larger grains at the higher growth pressures leaving fewer grains to accommodate the strain through their rotation. This explanation is consistent with the lack of change in the peak width of the (10 2) asymmetric peak, which is more sensitive to these rotations. The average values for the four pressures were 436’’, 472’’, 427’’, and 439’’. Although average structural changes in the films have occurred by growing them at different pressures, there is little evidence that these changes account significantly for the dramatic changes that occur in the I–V characteristics of the diodes fabricated on them. Moreover, the effects generally improve as the growth pressure is raised, and one would expect the opposite if average changes in the crystal quality were the dominant effect because one would expect the device properties to be poorer as the crystal quality degrades.
IV. CONCLUSIONS
The results of this study show that deep acceptor states associated with carbon lead to a high turn-on voltage and specific on-resistance in GaN SDs grown by MOCVD at 100 Torr. The diode I–V curves also display a snap-on effect and hysteresis. MOCVD growth at higher pressures reduces the carbon incorporation, but it still is >1016 cm−3 setting an approximate lower limit to the level GaN films can be doped and, therefore, an upper limit for V b of ∼1200 V for GaN SDs. V b will usually be lower than this because both the states created by the carbon impurities, as well as the many dislocations in the film, can cause premature breakdown. Epitaxial layers grown at system pressures ranging from 100 to 650 Torr had carbon concentrations ranging from 2.52 × 1017 cm−3 at 100 Torr to 1.19 × 1016 cm−3 at 500 Torr. As a result, C–V measurements show an increase in the net carrier concentration in the UID films with increasing growth pressure. SIMS results show that the carbon concentration exceeds the carrier concentration, indicating that not all incorporated carbon atoms create acceptor states. It is not known if the carbon occupies a gallium site acting as a donor, is an interstitial creating states near the midgap, and/or are tied up in the large number of dislocations where they could be electrically inactive. This is a complex problem that cannot yet be completely explained and requires further investigation. SDs fabricated on these films showed an increase in FOM for increasing growth pressure. Although the measured breakdown voltages were highest for the 100 Torr sample, these diodes had the lowest average FOM because the specific on-resistance was very high due to the higher concentration of carbon.
ACKNOWLEDGMENTS
The authors thank Dr. Steve Novak of SUNY-Albany for his assistance with secondary ion mass spectroscopy measurements and Dr. Andrew Allerman at Sandia and Dr. Joshua Robinson at Penn State for contributing some MOCVD-grown films. This work was supported in part by an appointment to the U.S. Army Research Laboratory Postdoctoral Fellowship Program administered by the Oak Ridge Associated Universities through a contract with the U.S. Army Research Laboratory.