Introduction
Over time and across countries, the variation in economic performance such as economic growth and the level of employment is substantial. Some countries, like Germany and the Netherlands, perform very well economically at particular points in time but much less so at other times. There are also countries, like the United States, which typically outperform other countries, like Spain, at all times. In the extensive literature focusing on economic performance, institutions (such as the degree of corporatism or consensus democracy) are often argued to (partly) explain the existing variation in economic performance. The question to what extent institutions matter in this respect is a central and contested issue in several literatures in comparative politics. Studies are often inconclusive about both the impact of these institutions on overall economic performance and their effect on separate indicators of economic performance (e.g. Lange and Garrett, Reference Lange and Garrett1985; Calmfors and Driffill, Reference Calmfors and Driffill1988; Lijphart, Reference Lijphart1999; Anderson, Reference Anderson2001; Hall and Gingerich, Reference Hall and Gingerich2004; Kenworthy, Reference Kenworthy2006; Soskice, Reference Soskice2007).
Against this backdrop, many studies extensively discuss the best conceptualization and operationalization of the so-to-speak crown-independent variable: the specific institutional arrangement. The dependent variable, economic performance, is typically ignored or at least not addressed in as much detail. Although the definition and operationalization of what exactly constitutes corporatism varies considerably among researchers (e.g. Lijphart and Crépaz, Reference Lijphart and Crépaz1991; Siaroff, Reference Siaroff1999; Molina and Rhodes, Reference Molina and Rhodes2002; Baccaro, Reference Baccaro2003; Compston, Reference Compston2003), most scholars classify the same countries as corporatist. Similarly, researchers disagree about the relevance of one of the two dimensions of consensus democracy proposed by Lijphart (Reference Lijphart1999): the federal-unitary dimension that refers to the constitutional setup of nation-states (e.g. Lane and Ersson, Reference Lane and Ersson2000; Vergunst, Reference Vergunst2004: 42). Again, however, most scholars agree on the classification of consensus democracies. This consensus indicates that despite differences of opinion about the correct conceptualization and operationalization of these key independent variables, a commonly accepted standard is available.
Remarkably, such a standard appears to be absent for the dependent variable of these studies: economic performance. A substantive or conceptual discussion of what constitutes economic performance is typically missing, especially regarding overall economic performance. Researchers often simply use a range of different and separate indicators that lack theoretical or substantive backing – except perhaps for the tacit understanding that the more indicators one uses, the more convincing the conclusions of the analysis become (e.g. Lijphart, Reference Lijphart1999: 266–267; Vergunst, Reference Vergunst2004: 120–122). This practice generates at least two problems (cf. Vis et al., Reference Vis, Woldendorp and Keman2007). First, researchers lump together indicators of economic performance (e.g. economic growth), indicators of policy performance (e.g. income equality), and indicators uncertain to what category of performance they belong (e.g. strike activity). Consequently, assessing the effect of various institutions on overall economic performance becomes problematic. Second, comparing the analyses’ findings is usually difficult because they examine different dependent variables.
In this paper, we set out to overcome these problems by proposing and assessing a substantively grounded conceptualization, operationalization, and measurement of overall economic performance. We consider the lack of such a dependent variable to be a weak spot in the research into the relationship between institutions and economic performance, which leads to the inconclusive and thereby contested results of these studies. We construct eight ideal types (models) of overall economic performance and examine how 19 capitalist democracies – all members of the OECD – fared for the period 1975–2005.Footnote 1 To assess the variation over time, we concentrate on four periods: 1975–1979, 1985–1989, 1995–1999, and 2001–2005. These periods represent distinct macroeconomic circumstances, allowing different countries to emerge as strong (or weak) economic performers.Footnote 2 We use fuzzy-set ideal-type analysis, a relatively new technique combining fuzzy-set theory and ideal-type analysis (Kvist, Reference Kvist1999; Vis, Reference Vis2007; Hudson and Kühner, Reference Hudson and Kühner2009)Footnote 3 to map these countries’ cross-national and longitudinal economic performance. The descriptive analysis reveals substantial variation across countries and over time. Using simple statistics, we assess to what extent this variation can be accounted for by means of the existing literature's key independent variables: corporatism and consensus democracy. We show that these two factors cannot adequately explain the variation in performance.
The paper has the following structure. The second section discusses the inconclusive results of studies on the relationship between corporatism, consensus democracy, and economic performance. The third section elaborates our conceptualization and operationalization of overall economic performance. The fourth section introduces fuzzy-set ideal-type analysis and examines the cross-national and longitudinal changes in the countries’ fit with the different economic performance models. The fifth section assesses whether corporatism and consensus democracy matter for overall economic performance. The last section discusses the results and concludes.
Institutions and economic performance: inconclusive evidence
A first strand of literature studying the relationship between institutions and economic performance concentrates on the effect of corporatist institutions. The argument in brief, which we label the corporatism hypothesis, is that countries with a corporatist institutional arrangement outperform those without corporatist institutions in terms of economic performance (e.g. Schmidt, Reference Schmidt1982; Czada, Reference Czada1987; Alvarez et al., Reference Alvarez, Garret and Lange1991; Crépaz, Reference Crépaz1992; Kenworthy, Reference Kenworthy2002; Wilensky, Reference Wilensky2006).
The definition of what exactly constitutes ‘corporatism’ varies across researchers. Siaroff (Reference Siaroff1999: 177), for example, suggests that the core features of corporatism may be ‘(…) the co-ordinated, co-operative, and systematic management of the national economy by the state, centralised unions, and employers (…)’. Somewhat more broadly, Baccaro (Reference Baccaro2003: 683) defines corporatism as a ‘(…) particular structure of the interest representation system, characterized by monopolistic, centralized and internally non-democratic associations’.Footnote 4 Nonetheless, there is agreement across researchers on the classification of countries as (clearly) corporatist and (clearly) non-corporatist,Footnote 5 which we adopt here.Footnote 6
As we stated above, a similar substantive conceptual discussion among researchers about what constitutes (overall) economic performance is remarkably absent. In the literature, there is broad agreement about the use of indicators like (un)employment, economic growth and inflation, either as separate indictors (like unemployment, see Schmidt, Reference Schmidt1982; Kenworthy, Reference Kenworthy2002), or as simple, albeit different, additive indices. There are also indicators that are less frequently used, like real wages (Czada, Reference Czada1987), labour productivity growth, capital investment, income inequality, social expenditure (Wilensky, Reference Wilensky2006), or strike rates (Crépaz, Reference Crépaz1992; Wilensky, Reference Wilensky2006). Especially the latter range of indicators represents in our view either government policy performance (income equality and social expenditure), or corporate policy performance (capital investment and labour productivity growth), factors which may or may not influence economic performance indicators like economic growth and employment. For other indicators (real wages and strike rates), it is unclear to what category of performance they refer.
The inconclusive evidence discussed above derives (at least partly) from the absence of a common standard of (overall) economic performance, the (related) use of separate and different indicators of economic performance, the various ways of measuring the indicators used, and the different time periods involved. Depending on the indicators used, the way these are measured and the time period involved, corporatist countries outperform non-corporatist ones, or not. For example, between 1960 and 1990 corporatism had a positive (lowering) effect on unemployment (Schmidt, Reference Schmidt1982; Alvarez et al., Reference Alvarez, Garret and Lange1991; Crépaz, Reference Crépaz1992; Kenworthy, Reference Kenworthy2002), but in the 1990s this positive effect disappears (Kenworthy, Reference Kenworthy2002). The positive effect of corporatism on economic growth and inflation is linked with openness in the 1970s (Czada, Reference Czada1987). In the 1970s and 1980s, corporatism has only a weak positive effect on economic growth, but a strong positive effect on inflation (Crépaz, Reference Crépaz1992); or a strong positive effect for both economic growth and inflation (Alvarez et al., Reference Alvarez, Garret and Lange1991). Wilensky (Reference Wilensky2006), finally, shows that between 1950 and 2000, there are different (corporatist) routes to good (economic) performance, represented by unemployment, economic growth, and inflation, plus an extensive range of quite different indicators (see above).
The same inconclusiveness applies to those scholars criticizing the corporatism hypothesis. For example, Woldendorp (Reference Woldendorp1997: 62, 67–68) shows that the macroeconomic performance of corporatist countries does not co-vary with the level of corporatism of these countries between 1970 and 1990 (when looking at various indicators like economic growth, inflation, unemployment, budget deficits, public debt or trade balance). Flanagan (Reference Flanagan1999: 1171), conversely, focusing on inflation, unemployment, the aggregate real wage level and wage dispersion, finds that corporatism may have had some positive effects in the late 1970s and early 1980s, but that effect disappears in the 1990s and may not have existed in the 1960s.Footnote 7
A second body of literature examining the link between institutions and performance focuses on the cross-national variation in types of democracy. The thesis in brief, which we label the consensus democracy hypothesis, is that the consensual model of democracy is conducive to a better (‘kinder and gentler’) economic performance than the majoritarian (Westminster) model of democracy (e.g. Lijphart, Reference Lijphart1999: 263–270). Consensus democracies are characterized by proportional representation, a multi-party system, and coalition politics in government. Majoritarian democracies are typified by plurality electoral systems or majority representation in politics, leading to a two-party system in which government alternates between the two dominant parties within the party system (Lijphart, Reference Lijphart1999: 9–21, 34–41, 312ff.).
The scholarly debate on the conceptualization and operationalization of the types of democracy centres on one of the two dimensions proposed by Lijphart (Reference Lijphart1999: 312) to assess whether a country is a consensus democracy or a majoritarian one. The first dimension is the executive-party dimension and refers to the electoral system (proportional representation or majority voting), the party system (multi-party or two-party), and the type of government (coalition or single party majority). The second dimension is the federal-unitary dimension and refers to the constitutional setup of nation-states. While the first dimension is largely uncontested (but see Armingeon, Reference Armingeon2002), the second attracts criticism. Lane and Ersson (Reference Lane and Ersson2000) and Vergunst (Reference Vergunst2004: 42), for example, argue that this dimension is less important for explaining consensus or majoritarian democracy than the first one. This idea is enhanced by the fact that among the federal states, there are consensus democracies (Austria, Germany, and recently Belgium) as well as majoritarian ones (Australia, Canada, and the United States). Still, many students agree on the classification of countries, and we follow this classification here.Footnote 8
As with corporatism, there is no substantive conceptual discussion of (overall) economic performance. Instead, separate indicators for performance are used, especially economic growth, inflation, unemployment, strike activity, and budget deficits (Lijphart, Reference Lijphart1999: 266–267). Lijphart concludes (1999: 270; also see Crépaz, Reference Crépaz1996) that consensus democracy had no positive effect on economic growth between 1970 and 1995, had ‘a slightly better record’ for unemployment, strike activity and the budget deficit, and ‘a significantly better record’ on inflation. By testing the relationship between consensus democracy, inflation, and unemployment specifically, Anderson (Reference Anderson2001: 442–443) shows that these positive results should be attributed to either corporatism (unemployment) or corporatism plus central bank independence (inflation) rather than to consensus democracy (as represented in particular by the executive-party dimension). Armingeon (Reference Armingeon2002: 95–99), examining inflation, unemployment, economic growth, and debt, shows that consensus democracy does not lead to a better performance compared to majoritarian democracies.
The absence of a common standard of (overall) economic performance and the use of separate and different indicators for economic performance that are not substantively grounded also produces inconclusive evidence as to the relationship between consensus democracy and economic performance.
To conclude, the relationship between corporatism or consensus democracy and economic performance can be clarified further when a substantively grounded common standard of (overall) economic performance is conceptualized and operationalized. The absence of such a common standard has the effect that at present economic performance can be literally all things to all (wo)men.
Overall economic performance
Which indicators to select to tap overall economic performance? The selection obviously depends on the specific research question. Scholars who are interested in the effect of institutions on a particular indicator for economic performance will investigate the relationship between the selected institution(s) and that particular indicator. However, we argue that offering a substantive conceptualization of economic performance prior to operationalizing separate empirical indicators for that performance is an important addition to the literature. Related, conclusions about the effect of institutions on overall economic performance may best be based on a combination of indicators that is rooted in such a substantive notion of overall economic performance.
As indicated above, many scholars employ separate indicators to measure economic performance or construct additive indices that have no origin in a substantive notion of economic performance, let alone of overall economic performance. It is noteworthy that, although, for instance, Wilensky (Reference Wilensky2006: 338) considers it an advantage that his index ‘(…) avoids arguments about what is important – controlling inflation, good growth, or low unemployment’, we propose that all components matter. For a country to perform excellently in economic terms, it needs to excel on all relevant indicators simultaneously.
We follow Vis et al. (Reference Vis, Woldendorp and Keman2007) and conceptualize overall performance as the combination of economic growth (measured as the percentage of gross domestic product (GDP) per capita in real terms to the previous year), total employment (as a percentage of the total population aged 15–64 years), and the level of gross public debt (as a percentage of GDP). We base the selection of economic indicators on a review of the ‘miracle’ debate concerning economic performance in the late 1990s and 2000s (e.g. Visser and Hemerijck, Reference Visser and Hemerijck1997; Delsen, Reference Delsen2002; Keman, Reference Keman2003; Becker and Schwartz, Reference Becker and Schwartz2005). Although scholars disagree on what exactly constitutes an economic miracle, three types of indicators are most commonly used: various measures of (un)employment, economic growth, and budget deficits or public debt.Footnote 9 We prefer public debt over the budget deficit because public debt is a more appropriate indicator of economic performance.Footnote 10 The budget deficit, conversely, is more an indicator of policy performance. Budget deficits can be lowered relatively easy if and when the policy decision has been taken to do so – leaving aside the fact that it may be difficult to ‘sell’ the perhaps unpopular policy to the electorate. Arriving at a reduction of public debt, however, requires a sustained effort over time to reduce expenditure and deficit and to create a surplus whilst upholding economic growth and employment. Therefore, although public debt is more closely tied to the policy actions of governments than are growth or employment, it remains an indicator of economic performance.
Obviously, there is a fine line between government policy performance and economic performance. Over time, government policy outputs can have a direct impact on economic performance, such as on economic growth, total employment, and public debt, as well as an indirect impact through corporate policy performance (e.g. private investment, labour costs and productivity, or innovative capacity). However, the substantive argument for these three indicators of overall economic performance is that it is very difficult for governments to positively influence or manipulate them simultaneously. Furthering economic growth by lowering government expenditure (and thus giving more room for corporate policy performance) may increase economic growth, but at the same time hinders efforts to reduce government deficits and create surpluses in order to reduce debt over time. It can also have a negative effect on total employment, especially when public employment accounts for a sizeable part of total employment, like in some Scandinavian countries. Conversely, furthering economic growth by increasing expenditure (public investment) may have a short-term positive effect on economic growth and total employment, but can also jeopardize government finances (and corporate policy performance) in the longer term. Boosting total employment by creating more public jobs may have a negative impact on economic growth or government finances (and corporate policy performance), as expenditure has to increase by increasing taxes or government loans. Lowering debt by a sustained effort over time to reduce public expenditure may either foster or hamper economic growth (and corporate policy performance), but will certainly reduce public employment and, hence, total employment. Therefore, for a country to score well on these three indicators simultaneously is not a measure of government policy performance but of economic performance. To a large extent, overall economic performance so defined is independent of short-term government policies. If overall economic performance was a simple matter of government policy performance, directly or indirectly through corporate policy performance, countries would not experience economic cycles and for all countries the normal situation would be a continuous ‘miracle’ (high economic growth, high total employment, low debt) that would not at all count as a miracle but simply as a matter of fact.
Our indicators for overall economic performance, therefore, include total employment, economic growth, and public debt. Substantively, the argument is that to perform economically strong overall, a country should perform well on all three indicators at the same time.
Inflation
Let us elaborate why our measure of overall economic does not include inflation. Such a discussion is warranted since inflation is often employed as an indicator of economic performance.Footnote 11 We do not include inflation by itself in the combined measure because inflation is an indicator for policy performance (as is government expenditure) rather than for economic performance. Since the 1980s, the rate of inflation has been reduced in all countries we focus on due to the monetary policies of increasingly independent central banks. This reduction empirically indicates that inflation is in fact controllable if and when the policy decision has been taken to do so. Low inflation is therefore an indicator of central banks’ policy performance, the institutions entrusted with this policy goal by national governments, and not an indicator of economic performance (e.g. Iversen, Reference Iversen1998; Franzese and Hall, Reference Franzese and Hall2000; Anderson, Reference Anderson2001; Traxler et al., Reference Traxler, Blaschke and Kittel2001).
An empirical study of the International Monetary Fund (IMF, 2009: Ch. 3) supports this argument. In its research into asset busts between 1970 and 2008 in our sample of 19 countries (plus Japan and Switzerland), the IMF concludes, first, that inflation is not a leading indicator for these asset busts. This means that the rate of inflation is not related to a country's economic performance. The second conclusion is that central banks’ monetary policies to keep inflation low have been very successful since the 1980s, even in liberated financial markets in the 1990s and 2000s. This suggests that inflation can indeed be controlled if and when the policy decision has been taken to do so and has been executed.
An additional reason not to include inflation is that the theoretical argument regarding the trade-off between inflation and (un)employment belongs more to the 1970s and early 1980s then to the period after that. According to this trade-off high inflation and low unemployment (i.e. high total employment) used to go together, as did low inflation and high unemployment (i.e. low total employment; e.g. Hall and Franzese, Reference Hall and Franzese1998; Iversen and Soskice, Reference Iversen and Soskice2006). Since our measure includes one term of this trade-off (total employment), by definition it also includes its counterpart (inflation).
Fuzzy-set ideal-type analysis of economic performance
How to assess a country's economic performance cross-nationally and over time? Fuzzy-set analysis combined with ideal-type analysis – that is, fuzzy-set ideal-type analysis – offers a new and innovative approach to examine qualitative and quantitative changes within countries, across countries, and over time and is therefore particularly apt for answering this question. Fuzzy-set ideal-type analysis makes use of the ‘corners’ of the multi-dimensional property space (Barton, Reference Barton1955). If there are k sets (here k = 3: growth, employment, and debt), the property space has 2k corners, which are the ideal types (i.e. eight models). Thereby, these ideal types can be seen as idealizations of reality, construed for the purpose of comparison. The closer a case is to a corner, the larger the degree of membership of that ideal type. An important feature of fuzzy-set theory is that cases’ membership of the different sets (and thus also of the ideal types as these are combinations of sets) can vary – anything between full and no membership is possible. Whereas traditional quantitative variables are calibrated according to means and/or coefficients of variation, fuzzy sets are calibrated in line with theoretical and substantive knowledge (Ragin, Reference Ragin2000: 169; 2008: Chs 4 and 5).
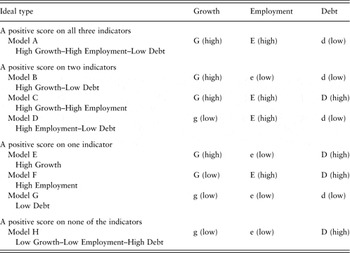
The researcher establishes two qualitative breakpoints, 1 and 0, to determine when a case is, respectively, ‘fully in’ or ‘fully out’ of a set. An important question in fuzzy-set ideal-type analysis is therefore how to operationalize these sets. In this paper, we employ continuous fuzzy sets, meaning that all scores between 0 and 1 are possible (see Ragin, Reference Ragin2000: 158–160). Another question is where to establish the qualitative breakpoints 1, 0, and 0.5 (the crossover point) and how to transform the raw data into fuzzy sets (i.e. calibrating the fuzzy set). Appendix 1 discusses the selection of the qualitative breakpoints and the calibration procedure. On the basis of the three indicators (economic growth, total employment, public debt), we develop the multi-dimensional property space consisting of eight ideal types of economic performance, each showing a different combination, or configuration, of the three indicators. Table 1 displays these models.
The ideal types of economic performance

Note: Growth, Employment, and Debt represent the three dimensions of the eight possible combinations. Capital letters denote in the set of Growth, Employment, or Debt (i.e. high), whereas lowercases denote out of the set (i.e. low).
Table 1 demonstrates that the ideal type of best overall economic performance (‘miracle’) combines being ‘fully in’ the sets of economic growth and of total employment and ‘fully out’ of the set of public debt (High Growth–High Employment–Low Debt model). The ideal type of worst overall economic performance (‘disaster’) combines being ‘fully out’ the sets of economic growth and of total employment and ‘fully in’ the set of public debt simultaneously (Low Growth–Low Employment–High Debt model). In the fuzzy-set ideal-type analysis, we assess how close the empirical correspondence of each of our countries is to these ideal types. Next to the ideal types of best and worst overall economic performance, we identify six other in-between models. Although seeing these models as ideal types may be harder, they are useful for our analysis because they allow us to establish where a country is located empirically when it does not correspond to either the miracle or the disaster model. The first three of these in-between ideal types have in common the fact that they perform perfectly on two of the three indicators (e.g. ‘fully in’ the set of growth and ‘fully out’ the set of debt); the second three ideal types perform excellently on only one of the three indicators. The eight ideal types of overall economic performance in Table 1 therefore represent both a rank order of performance and provide substantive information about the nature of that performance:
1. Model A – a positive score on all three indicators;
2. Models B, C, and D – a positive score on two indicators (three different combinations);
3. Models E, F, and G – a positive score on one indicator (three different combinations);
4. Model H – a positive score on none of the indicators.
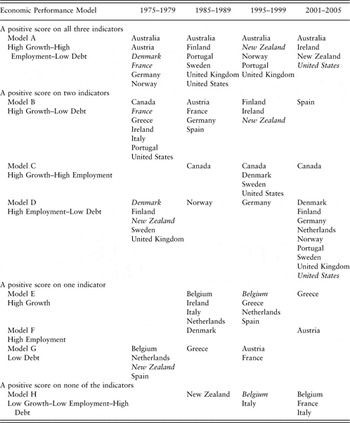
Table 2 summarizes the results of the fuzzy-set ideal-type analysis. As indicated, this method allows the straightforward mapping of the variation across countries and over time for both levels (number of indicators) and types (which configuration) of economic performance. Australia, for example, performs excellently throughout; the Netherlands moves up over time from scoring positive on only one, albeit different indicator (Low Debt or High Growth), to scoring positive on two indicators (High Employment and Low Debt), indicating improving performance; and Germany falls over time, from scoring positive on all three indicators to scoring positive on two different indicators (High Growth–Low Debt and High Employment–Low Debt), revealing weakening performance over time. Appendix 2 displays the full results of the analysis, including the precise degrees of membership.
Countries’ economic performance, 1975–2005

Note: Countries in italics score 50/50 in two models and are included in both models for the descriptive analysis. A score of 0.50 is a problem when fuzzy-set analysis is used to identify sufficient conditions for an outcome, as those cases are not included in the analysis. It is not a problem in fuzzy-set ideal-type analysis where the researcher establishes the location of a case in the multi-dimensional property space by means of the minimum principle (the minimum score of the sets involved). This can be 0.50: Denmark, France, New Zealand (1975–1979); Belgium, New Zealand (1995–1999); United States (2001–2005).
Table 2 indicates that in all four periods more countries are members of the ‘miracle’ model of excellent overall economic performance (Model A) than the ‘disaster’ model of worst performance (Model H). This suggests that excellent overall economic performance is not exceptional, contrary to what the body of work focusing on economic miracles may imply (e.g. Visser and Hemerijck, Reference Visser and Hemerijck1997; Becker and Schwartz, Reference Becker and Schwartz2005).
Additionally, Table 2 shows increasing divergence between countries over time, contrary to the hypothesis in the convergence literature (e.g. Castles, Reference Castles2004). In the 1970s, all countries have membership in only four of the eight possible models of economic performance. In the 1980s, countries have membership in all eight models, albeit five models only include one country. In the 1990s, countries have membership in seven models and only one model includes one country. Finally, between 2001 and 2005, countries also have membership in seven models, but now four models include only one country.Footnote 12 To what extent can differences in institutions, specifically corporatism and consensus democracy, account for the variation found in Table 2?
Institutions and economic performance: pattern or randomness?
Recall that both corporatism and consensus democracy are put forward as institutions that positively influence economic performance. In this section, we use the pattern found by the fuzzy-set ideal-type analysis to examine the relationship between economic performance and the institutional setup. The results suggest hardly any association between the two.
The corporatism hypothesis
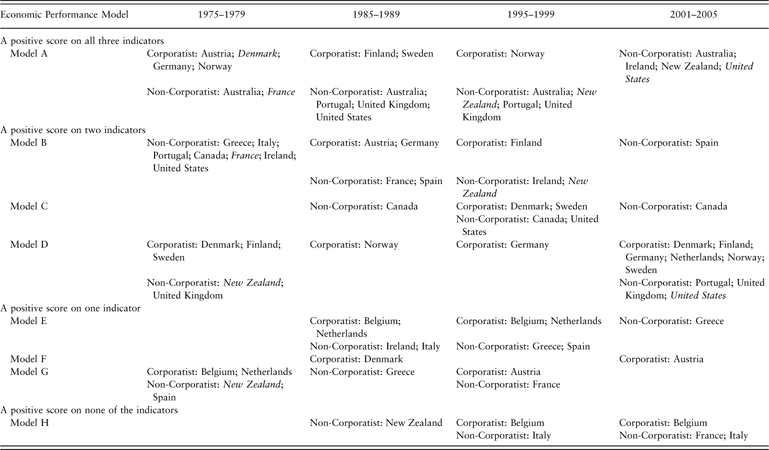
Table 3 demonstrates that there is no systematic difference in overall economic performance between corporatist and non-corporatist countries, thereby failing to support the corporatism hypothesis that corporatist countries outperform non-corporatist countries in terms of economic performance. Some corporatist countries even perform less well than some non-corporatist countries. Over time, the number of corporatist countries with membership in the ‘miracle’ model (High Growth–High Employment–Low Debt) declines to zero, while that of non-corporatist countries remains stable from the 1980s onwards. Moreover, although both types of country have membership in the worst performing or ‘disaster’ model (Low Growth–Low Employment–High Debt), the number of weaker performers is higher among the non-corporatist countries. In general, the findings suggest that the institution of corporatism is not univocally linked to overall performance.Footnote 13
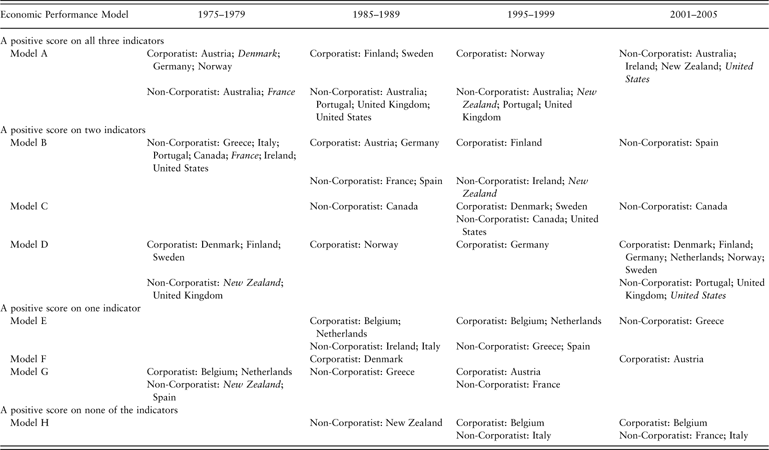
Table 3 not only confirms the weakness of the corporatist hypothesis, but also indicates that an alternative explanation is not plausible either. An example hereof is a hump-shape relationship with highly centralized industrial relations systems or highly decentralized ones performing better than the intermediate in-between cases (e.g. Calmfors and Driffill, Reference Calmfors and Driffill1988; Hall and Gingerich, Reference Hall and Gingerich2004, see Kenworthy (Reference Kenworthy2006) for a refutation of the hump-shape relationship). Corporatist institutions thus do not appear to matter directly for a country's overall economic performance. Corporatism may facilitate policy-making processes, but it has no systematic bearing on overall economic performance.
The consensus democracy hypothesis
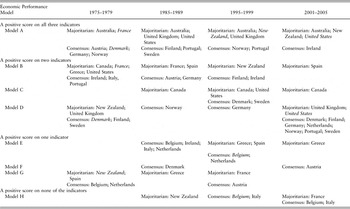
As with the corporatism hypothesis, the outcomes of our fuzzy-set ideal-type analysis fail to support the consensus democracy hypothesis that consensus democracies outperform majoritarian ones. Table 4 reveals the lack of difference regarding overall economic performance between consensus democracies and majoritarian ones. This observation appears valid for the federal dimension as well. If anything, the outcomes suggest that (some) consensus democracies perform less well than (some) majoritarian democracies. Over time, the number of consensus democracies with membership in the ‘miracle’ model (High Growth–High Employment–Low Debt) declines, while that of majoritarian democracies remains stable. Both types of democracy have equal membership in the ‘disaster’ model (Low Growth–Low Employment–High Debt). Regarding the other economic performance ideal types, no systematic difference exists between consensus democracies and majoritarian ones here either. On the contrary, Table 4 shows an increasing divergence of economic performance within these types of democracy. All in all, the institutional setup of consensus democracy seems to have no systematic bearing on the overall economic performance (also see Roller, Reference Roller2005).

To conclude, for both the corporatism hypothesis and the consensus democracy hypothesis the outcomes of our analysis suggest the absence of a systematic direct relationship between institutional setup and overall economic performance. The outcomes also indicate that excellent overall economic performance (Model A: High Growth–High Employment–Low Debt) is not exceptional, contrary to what the body of work focusing on economic miracles implies (e.g. Visser and Hemerijck, Reference Visser and Hemerijck1997; Becker and Schwartz, Reference Becker and Schwartz2005). Finally, the findings reveal increasing divergence over time, suggesting that specific factors within a country may be more relevant for the level and type of economic performance. This is also the conclusion of a recent critical review of the variety of capitalism literature (Becker, Reference Becker2009: Ch. 6; also see Kenworthy, Reference Kenworthy2006).
Discussion and conclusion
In this paper, we contribute to the scholarly debate on the relationship between institutions and economic performance by focussing on the dependent variable. We argue that the lack of conceptualization and operationalization of overall economic performance is a shortcoming in this body of research. To solve this lacuna, we put forward an approach to identify overall economic performance cross-nationally and over time: fuzzy-set ideal-type analysis. We argue that – instead of looking separately at indicators – focusing on the combination of a country's development on economic growth, total employment, and public debt helps one to assess the level of overall economic performance and to inspect its relationship with institutional setups comparatively.
The fuzzy-set ideal-type analysis of economic performance in 19 OECD countries between 1975 and 2005 reveals substantial cross-national variation in both the level and type of economic performance. This variation also proves to increase over time, that is to say, there is divergence. Moreover, the results suggest that there is no systematic direct relationship between a country's institutional setup – represented by corporatism or consensus democracy – and economic performance (also see Kenworthy, Reference Kenworthy2006; Becker, Reference Becker2009: Ch. 6). The results also show that there is no trade-off between the three indicators of economic performance – economic growth, total employment, and public debt – as over time different countries have membership in the ‘miracle’ model of excellent economic performance (Model A), for which countries must have positive scores on all three indicators simultaneously. Finally, the results reveal no systematic direct relationship between corporatism or consensus democracy and one or more particular indicator(s) since divergence in the membership of models of economic performance increases over time. These findings, as well as the observation that economic ‘miracles’ occur more frequently than economic ‘disasters’, suggest that other factors are apparently more relevant to understand economic performance than the institutional setup of corporatism and consensus democracy.
An interesting question for future work is then how to explain the variation in overall economic performance across countries and over time? The political economy literature suggests some factors that would be a good starting point for such research, such as leftist government partisanship (e.g. Hibbs Reference Hibbs1977; Alvarez et al., Reference Alvarez, Garret and Lange1991), the degree of central bank independence (e.g. Hall and Franzese, Reference Hall and Franzese1998; Anderson, Reference Anderson2001; Vergunst, Reference Vergunst2004: 109ff.; Iversen and Soskice, Reference Iversen and Soskice2006), and openness of the economy (e.g. Sachs and Warner, Reference Sachs and Warner1995; Anderson, Reference Anderson2001; Vergunst, Reference Vergunst2004: 109ff.; Calderón and Fuentes, Reference Calderón and Fuentes2006). On the basis of this study's findings, we do not expect these factors to have an independent effect on overall economic performance, but rather that they work through (different) combinations and/or with corporatism or consensus democracy. A possible way to assess the conjunctural effect of conditions are case studies (e.g. Bennett and Elman, Reference Bennett and Elman2006). However, when conducting (in depth) case studies, the number of cases cannot be very large. Therefore, when the aim is to account for a fairly large number of countries over a fairly large period of time, fuzzy-set qualitative comparative analysis (fsQCA, see Ragin, Reference Ragin2008; Rihoux and Ragin, Reference Rihoux and Ragin2009) is more useful. This technique allows for the identification of necessary or sufficient (combinations of) conditions leading to an outcome, such as ‘miraculous’ overall economic performance or ‘disastrous’ performance, as it enables the identification of different routes to a specific kind of overall economic performance. The latter is particularly useful as research demonstrates that there are indeed different roads to, for instance, good economic performance (e.g. Wilensky, Reference Wilensky2006). Institutional factors such as corporatism and consensus democracy are perhaps best viewed as so-called ‘remote’ factors that are relatively stable over time – as opposed to ‘proximate’ factors that result from (the actions of) human agency such as leftist partisanship – when it comes to accounting for overall economic performance. Consequently, Schneider and Wagemann's (Reference Schneider and Wagemann2006) two-step fsQCA approach may be the best option for scholars who want to explain the variation in overall economic performance.
Our paper shows that there is indeed a lot of variation to account for, which also increases over time. Furthermore, it demonstrates that corporatism or consensus democracy have little to do with this pattern. However, these institutional conditions could very well have an effect in conjunction with more ‘proximate’ conditions. This study's overview of countries’ overall economic performance in eight models or ideal types and in four periods of time therefore offers the groundwork for further research into the (combinations of) conditions fostering different kinds and degrees of economic performance.
Acknowledgements
The authors thank the three anonymous reviewers of European Political Science Review for their helpful and constructive comments. Barbara Vis' research is supported by a Veni grant from the Netherlands Organisation for Scientific Research (NWO, Grant no. 451-08-012).
Appendix 1 Qualitative breakpoints and the calibration of the fuzzy sets
Economic growth
The first qualitative breakpoint 0 (fully out the set) is placed at ⩽0%. Zero or negative economic growth is not conducive to a country's overall economic performance and, additionally, negatively affects the level of employment (directly) and the level of public debt (indirectly, as it is harder to curtail public debt when economic growth is negative). The second qualitative breakpoint 1 (fully in the set) is placed at ⩾5%. Economic growth of 5% or more implies an above average performance given the fact that for the countries under review here the annual economic growth averaged 3% between 1965 and 2005 (calculation based on Armingeon et al., Reference Armingeon, Leimgruber, Beyeler and Menegale2009; also see OECD, 2005b). To transform the raw data into fuzzy sets, we first recode all raw data below or above the qualitative breakpoints, that is <0 and >5 as follows (see Ragin Reference Ragin2006): lowest through 0, new value 0; 5 through highest, new value 5. The new minimum and maximum are 0 and 5. Then, the fuzzy set is computed by taking these transformed raw data and subtracting the lower limit (here 0) from each score and then dividing the result by the [upper limit−the lower limit], here 5–0 = 5. In formula: fuzzy-set score = [transformed raw data−lower limit]/[upper limit−lower limit].Footnote 14 In continuous sets, the upper and lower limits that the researcher establishes, that is, where he or she assigns the fuzzy scores 1 and 0, should be justifiable as the point of maximum ambiguity (Ragin Reference Ragin2006). Consequently, the crossover point is the score in the middle of this upper and lower limit. In formula: upper limit plus lower limit divided by 2; here (5 + 0)/2 = 2.5.
Total employment
For total employment (OECD, 2005b), we place the first qualitative breakpoint 0 (fully out of the set) below 50%. The argument here is that having more than half of the population between 15 and 64 years of age out of a job signifies an unhealthy labour market that puts a strain on welfare state expenditure (the revenue base decreases and expenditures – like transfer payments to individuals – will increase). We set the second qualitative breakpoint 1 (fully in the set of employment) at ⩾80%. The reasoning behind this is that having ⩾80% of the population between 15 and 64 years of age in a job constitutes a real achievement given the number of people in that age group who are normally enrolled in education, the army or who are otherwise temporary or permanently unavailable for the labour market (sickness and health problems, imprisonment, see Layard et al., Reference Layard, Nickell and Jackman1994).
Public debt
Concerning gross public debt (OECD, 2005a, b), we put the first qualitative breakpoint 0 (fully out of the set debt) at 38.4% of GDP. Econometric research demonstrates that a public debt ratio of 38.4 is optimal for fostering economic growth (Hsing and Smyth, Reference Hsing and Smyth1995). This finding implies that a debt level below 38.4% has a less positive effect on the level of economic growth. Nonetheless, we argue that less is (still) better, as a lower debt burden allows governments to use their revenues for something other than debt management. We place the second quantitative breakpoint 1 (fully in the set of debt) at ⩾100%. The argument is that if a country's debt ratio is ⩾100%, it would mean that it will no longer be able to meet its liabilities in the near future.
Conclusion
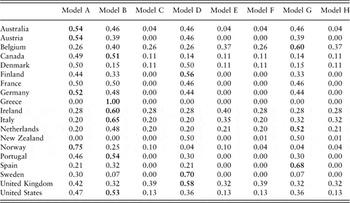
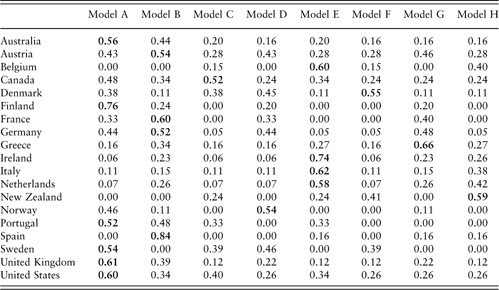
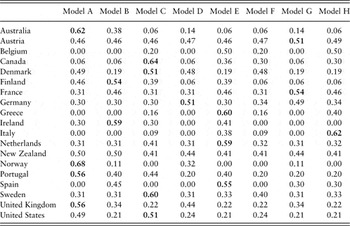
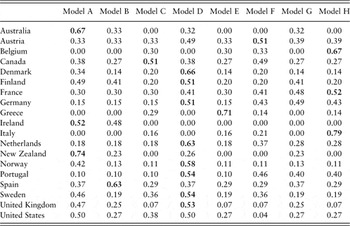
All three indicators are equally important for economic performance. This is expressed in the eight possible models of economic performance discussed in Table 1. However, the actual level of membership of countries in a particular model of economic performance may vary between 0.51 and 1.00. These scores are listed in Appendix 2.
Appendix 2 Results of the fuzzy-set ideal-type analysis, 1975–2005
Table A1Table A2Table A3Table A4
Fuzzy-set membership scores 1975–1979

Note: a higher score indicates more correspondence to a particular model. The model in which the case is ‘in’ (>0.5) is indicated in bold face. The data used to calculate the membership scores are available from the authors upon request.
Fuzzy-set membership scores 1985–1989
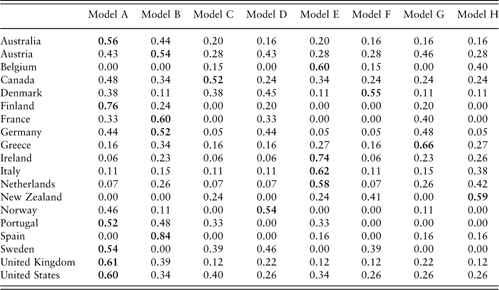
Note: see Table A1.
Fuzzy-set membership scores 1995–1999

Note: see Table A1.
Fuzzy-set membership scores 2001–2005

Note: see Table A1.