


Introduction
Digital methods have made rapid progress in humanistic scholarship, including in the study of Chinese history. In digital methods, sources—textual or cartographic—are translated into data that can be analyzed computationally. Data implies number, which can be large. Until a few decades ago, literary scholars and most historians avoided research that depended on the massive amounts of data; for many a careful reading of a few sources yielded ample insight. Confirming that insight, however, may require data and analysis. Consider the following two hypothetical examples: one from literature, the other from history. Imagine a dispute over the attribution of a Tang poem. Was it by Li Bai, Du Fu, Wang Wei, or an unknown poet? Converting all Tang poetry into machine-readable text (as has already been done) and applying standard text-analysis tools (as is less often done) may give an answer. And if not, the data—now searchable, tabulated, and analyzed—can speak to other questions concerning the poetics of the period. In Chinese history consider the rule of avoidance, in which officials were not to be appointed to their native jurisdiction. How consistent was this practice during the Song dynasty? With the geographic analysis of data on appointments such a question can readily be answered.
Scholars whose research deals with modern and contemporary China face the contradictory dilemmas of insufficiency and over-abundance. Too much data is inadequate, unreliable, or inaccessible. China's control of politically sensitive data—for example, the number of deaths during the Cultural Revolution or at Tiananmen Square in 1989—is draconian, but control can be strict, if less systematically applied, even in less politically sensitive areas such as the general population's ethnicity and religious affiliation, or the distribution and economic status of residential types. At the other end is the flood of data from the new information technologies, embraced alike by government, commercial companies, and ordinary citizens. Consider, in images and in words, the trillions of photos made available by street-view surveyors, drones, and smartphones, and the immense amount of social media captured on a daily or hourly basis in response to events both trivial and momentous. The abundance and variety of data can overwhelm and confuse, but if selected judiciously with a particular task in mind, they offer a new opportunity to resolve issues that had been set aside for lack of evidence or excessive heterogeneity.Footnote 1
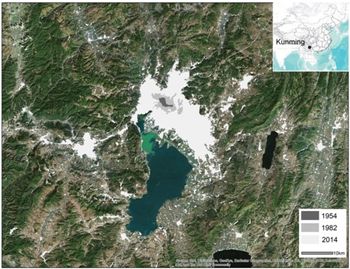
My goal in this article is to demonstrate how we can use a variety of sources and technologies to gauge the social and political statuses of communities in Chinese cities using the emerging metropolis of Kunming as a case study (Figure 1). In its deficiency of statistical information, Kunming resembles many metropolises in contemporary China and, indeed, in developing countries worldwide. Kunming's population, only 147,000 before the Sino-Japanese war, swelled as refugees from occupied north China sought shelter there.Footnote 2 After the Communists’ occupation of the Chinese mainland in 1949, Kunming returned to its backwater status in remote southwestern China, its growth sporadic and spatially uneven, and this remained the case into the 1980s. From the late 1980s onward the economic boom gave rise to explosive population growth that completely transformed the urban scene. By 2013, Kunming had become a megalopolis of 6.53 million people,Footnote 3 and yet, for all its size and for all the skyscrapers that make Kunming look modern and efficient, official statistics and maps of communities (or land use maps) are unavailable or grossly uninformative.Footnote 4 Official maps, for example, almost never show districts dense with temporary dwellings, yet a stroll even in cosmopolitan Beijing and Shanghai reveals them in all their shabbiness and poverty. Field observation will yield the necessary information, but unless it is conducted by a small army of trained observers, it doesn't give the extent and distribution of urban blight.
Study Area

Understanding the socio-political scene in China requires an understanding of Chinese cities, which in turn requires an understanding of urban communities. In this article, I use Kunming to demonstrate how a detailed and accurate map of its communities can be produced. The method I use for Kunming is applicable to other Chinese cities and, indeed, to all information-poor cities in the developing world. Such maps provide an enormous amount of information that was hitherto deficient or unavailable. This article explains how it can be extracted and given easily readable visual form. I weave into this discussion issues of definition in land use categories that can radically alter the cartographic outcome. My broader ambition is to show that big data has the power, when properly harnessed, to address a wide range of questions raised in the social sciences and the historical disciplines.
Large Data from Unofficial Sources
I now turn to the technical issues in mapping communities in Kunming. I begin with Kunming in the period from 1988 to 2014, when residents witnessed the most change in their urban communities. Mapping these is a daunting task, because archives and documents that trace them to the early years are mostly missing. New and not yet officially designated communities also lack data. The official and unofficial maps I have managed to obtain show well-planned, geometrically arranged boulevards, public squares, and development zones, but I was forced to a very different conclusion when I visited the city and saw slums and communities of highly mixed land use, completely at odds with what the government conceived. I therefore turned to other sources, including satellite images from the US scientific agency, points of interest (POIs, xingqu dian) from commercial mapping companies, geotagged social media posts from smartphone Weibo users who live in Kunming, e-commerce data from online real estate and consumer electronics companies, and street view data from surveying companies. Data from these alternative sources, which are massive, require digitization, computation, and verification.Footnote 5 In what follows, I will use a data-empowered framework to incrementally analyze the urban communities by employing computational algorithms capable of extracting the necessary information.
Satellite images come from NASA Landsat. At 30-meter resolution, they can distinguish such categories as built-up areas, forests, and water bodies. Other strengths are that the images have had the same spatial resolution since the 1980s; that the time span coverage is consistent and has a temporal interval of sixteen days,Footnote 6 short enough to show phases of building construction, which is important to my study; and that the images are free and open access. These strengths together mean that the times of ground-breaking of constructions can be identified, which indicates age of the construction. To better obtain information concerning human activities, I collected satellite-generated digital elevation model (DEM) at 30 meters as auxiliary datasets. The topography of these datasets helped me select training samples semi-automatically, a procedure that in turn allows me to infer human activities from the detailed patterns of land use.Footnote 7
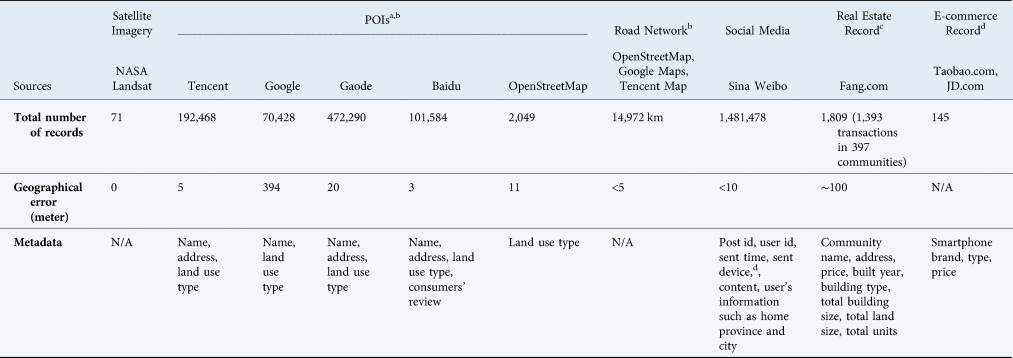
I also collected the Points of Interest (POI) in 2013. A point of interest is a picture of a part of the city that appeals to visitors. In the old days, peddlers sold paper maps that showed points of interest. The internet age has generated maps of far greater appeal and accuracy. Since 2005, mapping and navigation companies, outstandingly Google, Baidu, Tencent, and Gaode have produced information for millions of places (Table 1). Similarly, the volunteer organization OpenStreetMap that supports open data also provides POIs and detailed road networks. These organizations rush to digitize all the POIs as precisely as possible so that they can provide turn-by-turn navigation and other location-based services to consumers. Furthermore, these digitized POIs provide details such as type of business, telephone number, and opening hours, all with a mere click. These kinds of information with such easy availability have never been available before.
Data Sources

a Geographical coordinates are corrected from GCJ-02 to WGS-84. POIs by each company are evaluated with 10 random sample respectively.
b Geographical coordinates are corrected from BD-09 to GCJ-02, then further corrected to WGS-84, which ends up with an error that is less than 5 meters due to this correction.
c All real estate records are geocoded according to their addresses, which leads to a small geographical error that is about 100 meters. Consider the size of the real estate communities, the error is negligible.
d E-commerce record of mobile devices of major brands are collected in May 2014 to match those used in Weibo. Some hundreds of small brands are generalized as phones under 1,000 RMB.
POI data adds specificity to type of urban communities and land use in Kunming, but, although such data can pinpoint the location of an establishment, it cannot delineate its size and boundary. Also, POIs are subject to the state's baneful influence. For example, Google Maps provide fewer POIs in China than in other countries, perhaps because, after the company retreated from China in a row over internet censorship in 2010, it has not kept up with POI digitization.Footnote 8 Another baneful state influence is the adding of algorithmic offsets on all versions of POIs. I have been able to remove these, however, by using computational algorithms devised by computer engineers.Footnote 9 I have also collected all POIs through their respective Application Programming Interfaces (APIs, see details of data collection in Appendix A). POIs from different companies, to the extent that they complement one another, can be used to produce more information. I then check their completeness and preciseness by comparing their geolocations and associated metadata. Compared with Google and OpenStreetMap, Baidu Maps, Tencent Maps, and Gaode Maps are more competitive in that they have been expanding their POIs to provide turn-by-turn navigation and locational based services.Footnote 10 Moreover, POIs from these companies have increased the specificity of the information they offer. With the Tencent Map, for example, every POI is labelled at three levels: “Food” at level 1, “Restaurant” at level 2, and “Cantonese cuisine” at level 3.Footnote 11 In trying to see what Kunming looks like “from above,” I have obtained complete sets of POIs from these three companies. After data collection and pre-processing, I then compare the results thus obtained with hundreds of places that I have validated through field work and close examination of Google Earth images, known for the dependability of their locational information as compared with images derived from other sources.Footnote 12 A locational error of less than 30 meters makes my dataset of POIs comparable in accuracy to those derived from Landsat images. I gain further precision by consulting road networks collected from Tencent Maps (after correction) and OpenStreetMap.
POIs are one source of data for constructing the social and political statuses of urban communities in Kunming. Another source are the geotagged posts sent from smartphone social media users throughout the city. Sina Weibo, the Chinese equivalent of Twitter, has smartphone users in the hundreds of millions.Footnote 13 I designed a fishnet of points that covers my study area, Kunming, and with it I collected all posts dispatched from November 2013 to July 2014, using Weibo Place Nearby API (Appendix A). The geographical coordinates of posts, as given by the GPS module on smartphones, are highly accurate, with error ranging from 2 to 10 meters.Footnote 14 Such a margin may be considered negligible when the resolution of a Landsat image may be in error by 30 meters. Because the geotagged posts can indicate how citizens move at precise time and location, I aggregate them to avoid privacy concerns.Footnote 15
The fourth source of data is non-spatial, for example, the price of a mobile device as it is listed on Chinese e-commerce websites (e.g. Taobao.com and JD.com, the Chinese equivalent of Amazon.com), price being an indicator of the social media user's socioeconomic standing.Footnote 16 Another type of data is information concerning housing projects such as the number of stories of buildings, number of bedrooms and living rooms in a sample of units, the selling price and price per square meter of old and new units, be they residential, office, or commercial, as listed on Chinese real estate sale and rental websites on the same date (e.g. Fang.com, the Chinese equivalent of Zillow.com).
Lastly, regarding the visual data, I have also collected street view images in Kunming from Tencent through its API (Appendix A). The street view images provide visual information about exterior appearances that can help distinguish between urban community types, such as urban villages and gated communities. For purposes of comparison and evaluation, I have consulted Google Earth historical images and street views from Tencent Map and georeferenced urban planning maps of Kunming made by the government at various dates.
Steps to Identify Urban Communities
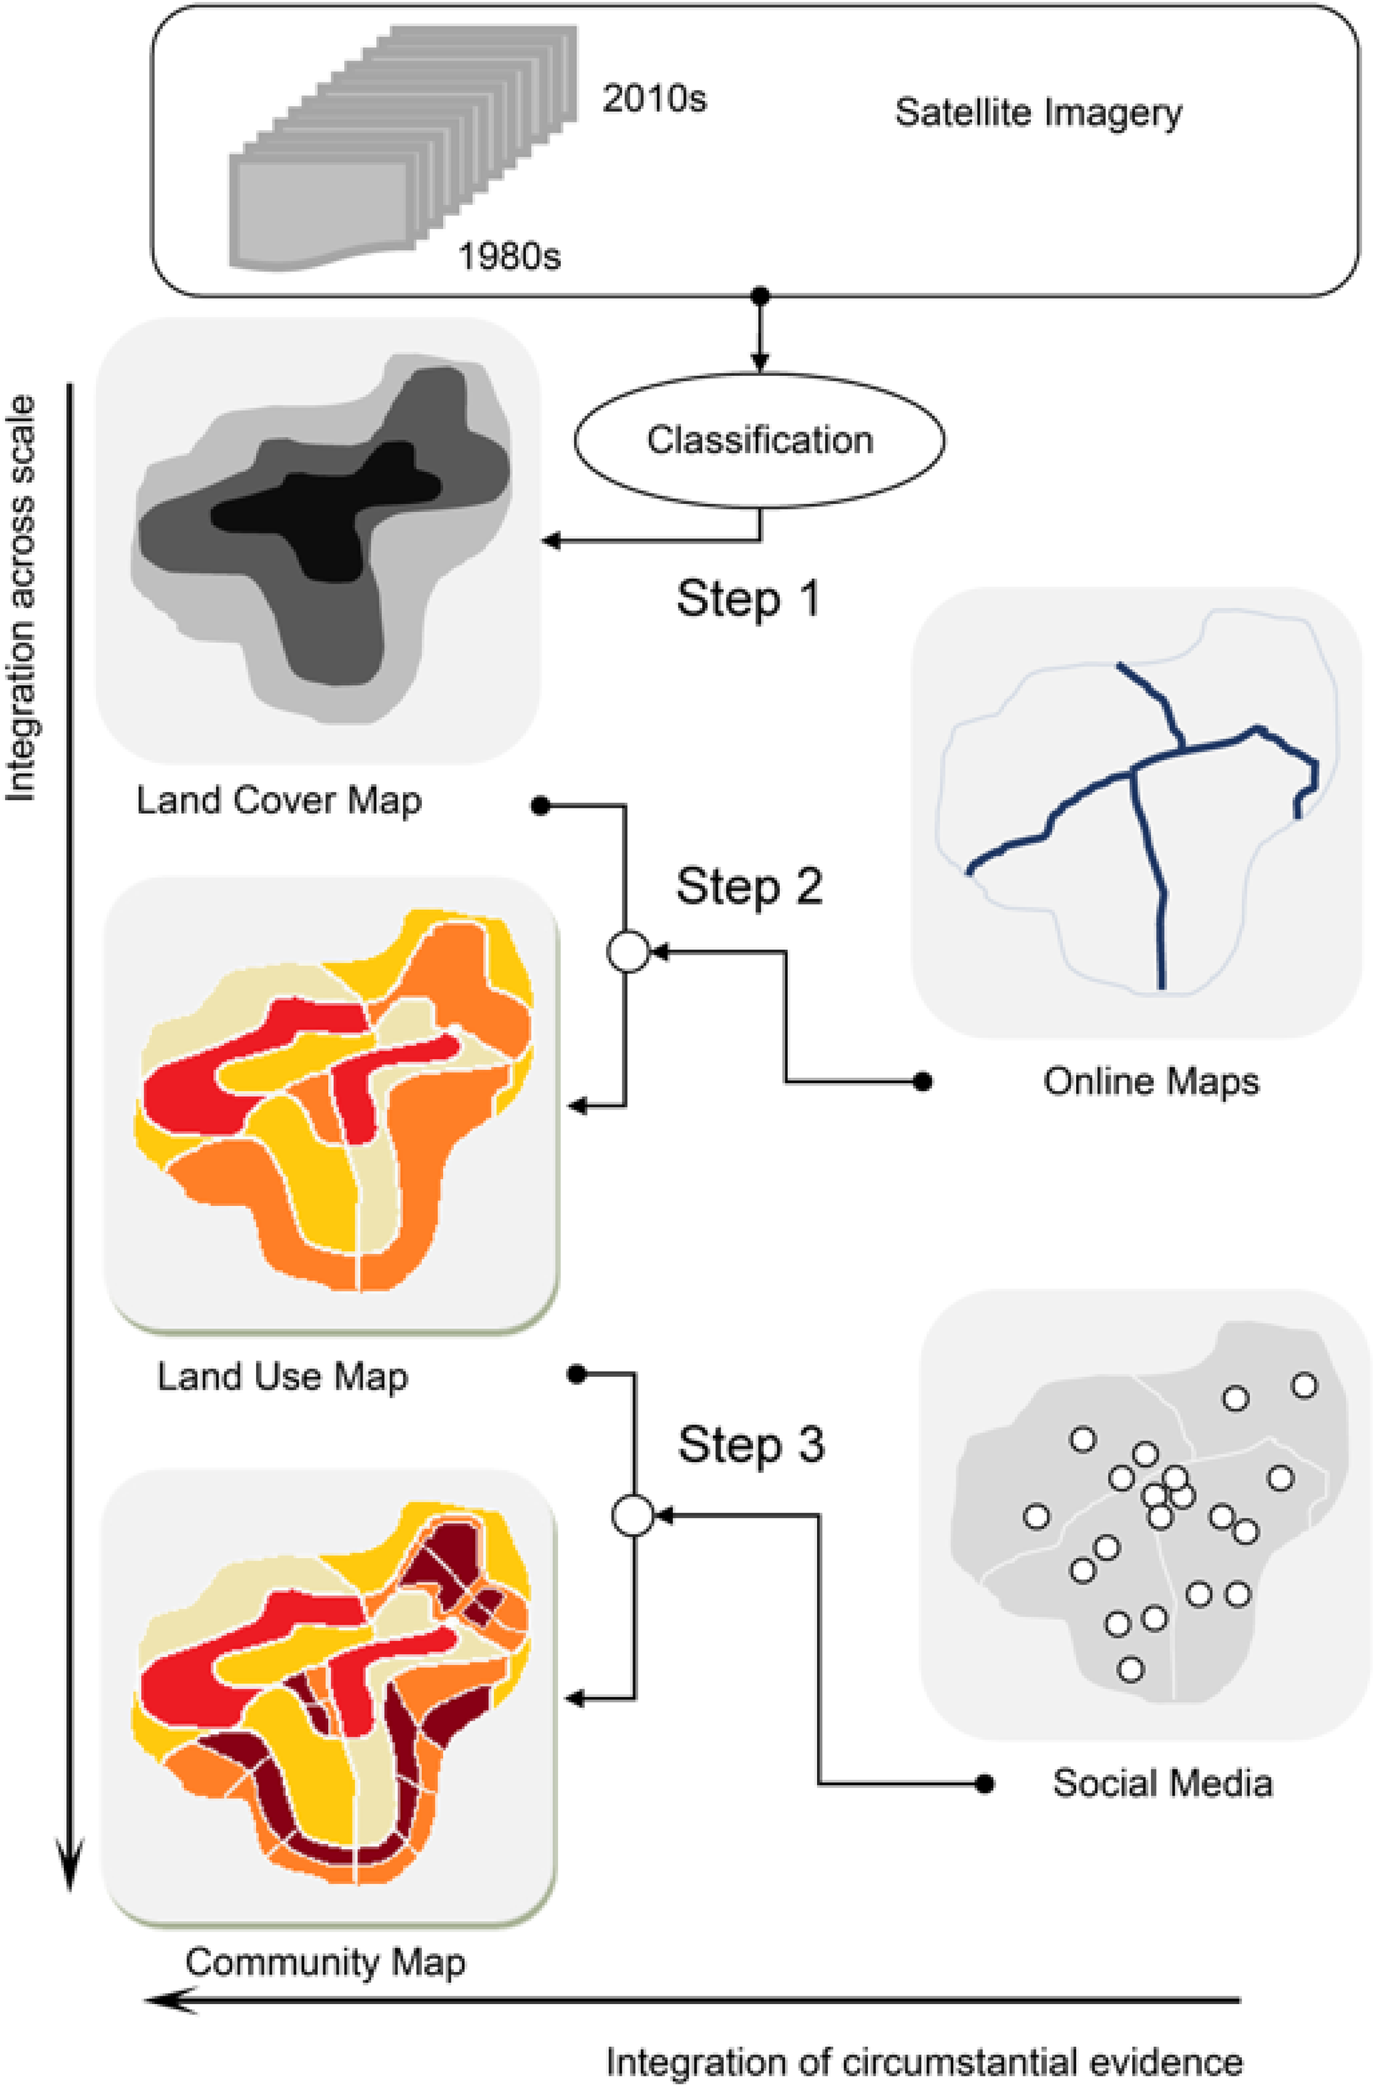
With all the data collected, I map the location, size, and type of communities in Kunming in three steps. Each step incrementally enhances the measurement by integrating information across scales. The first step maps the size, location, and construction year of the land on which the communities are established. To do so, I use satellite images, DEM, e-commerce data, and road networks. The second step maps the primary land use categories: residential, manufacturing, commercial, transportation, office, and recreational. No primary category is pure, however, in the sense that it designates exclusively one use. A residential community may have shops at its margins and a commercial area may include residences for its employees. The third step maps urban communities of different socio-political statuses. This step is particularly important for Chinese cities because of China's highly mixed urban land use. Here I give two examples. One is the residential category, which has been clustered into four hierarchical socioeconomic statuses: urban village, government residence, gated community, and Soviet-style apartment block that was or is a part of a work unit. I choose to map the residential subcategory to illustrate the power of a method, but also, as I shall show later, because residences of different quality reflect the socioeconomic standing of their residents. The other is to separate primary land use category of different political statuses. This includes distinguishing within the office category between commercial offices and the government compounds and, in addition, distinguishing governmental offices within government compounds from the residential areas where many civil servants and tenants live who are unaffiliated with the government.
The three steps I have just sketched correspond with a coordinated effort to extract and integrate information across successive scales. Information at each finer scale offers more detail than the previous one, thanks to information transferred to it. The process is captured in a pictograph in which each applet refers to a step (Figure 2). The rest of this section will give a more comprehensive account of the process.
Workflow

First Step: Size, Location, and Construction Year of Built-Up Areas in Kunming
I identify the size and location of communal land, using as my main source more than 70 Landsat satellite images of Kunming, taken at different times in the past three decades. Satellite images provide spectral information of locations and times that indicate the type of land cover: for instance, if an image shows an area to be green in the summer, I read it as covered with trees or grass. To use a computational method for such identification requires the following procedure: define major classes; map the defined classes using a supervised machine-learning algorithm; and evaluate the result to ensure that the quality of mapping is satisfactory.
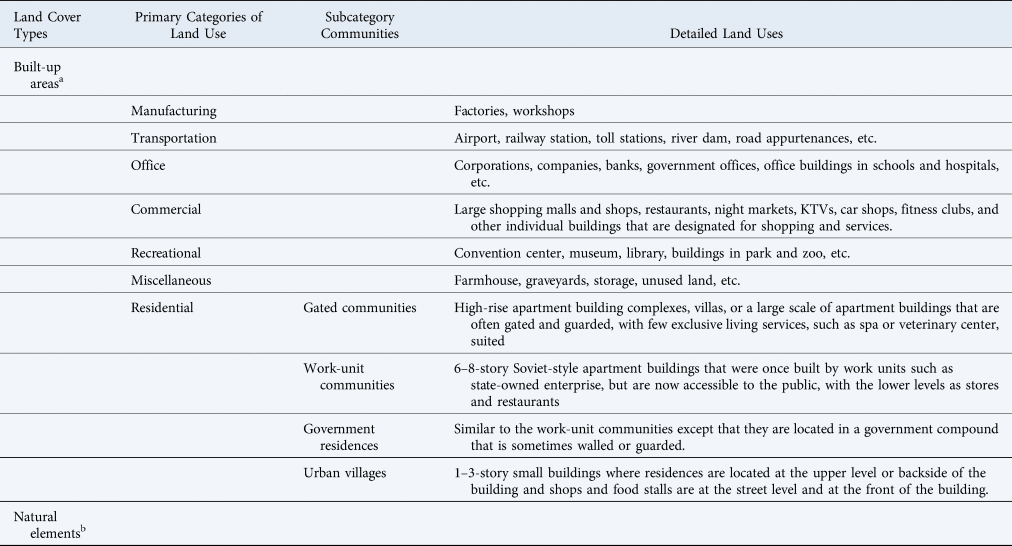
The major types of land cover are built-up areas and natural elements (Table 2). Built-up areas are useful markers in that their annual expansion indicates the size and location of other types of land cover. After economic reform in the 1980s, Kunming expanded rapidly in the next quarter century to more than 70 percent of today's built-up area. This entire period was covered by satellite imagery. Other types of land cover, rather than being combined and labelled as non-built-up, are included in the classification as separate land cover types. Doing so can improve the accuracy of each type and avoid the possibility of misclassifying areas that have been built on.

a “Built-up areas” refers here to the land surface that is manufactured and can be detected using remote sensing images, regardless of specific human use. In contrast, major land use categories refer to the human use of urban land, roughly corresponding to the major categories of zoning ordinance and urban planning practices.
b Natural elements co-exist as various detailed land uses in the urban environment. However, I do not discuss them in detail in this research.
I classify the land cover change using a supervised classification method. First, I create training samples that are representative of the entire population of the subjects to be classified. I select the training samples using a semi-automatic method with the assistance of terrain information (e.g., DEM), the latest road network, and seasonal vegetation (e.g., the composite monthly Normalized Difference Vegetation Index). I detail the steps and some results in Appendix B.
With all training samples selected, I am able to classify images into land patches of major cover types at a very fine spatial (30 meters) and temporal (mostly annually) scale. I then use a supervised machine learning method—Support Vector Machine (SVM)—to classify all the satellite images using the training samples. In comparison with other widely used methods, SVM is superior in its classification accuracy (Appendix B). The classified land forms the basis of land parcels for my other steps, because the farmland developed in the same year in a continuous area is likely to share the same use after urban development. This can be done because in China land cover change is largely in one direction, from non-built-up to built-up.
One remaining challenge is the downtown area, in which change is from built-up areas to built-up areas. I take further steps in inferring circumstantial data: one is to annex single pixels to adjacent continuous pixels in the same urban block if the changes have occurred in recent years. The annexation is based on the rationale that these single pixels register mostly construction extensions of major buildings. In planning, Chinese cities are unlikely to allow single-family houses the size of single pixels to be constructed separately from such extensions. Another application of this inference is to enlist POIs and the construction years of buildings in the real estate website to infer the approximate year when the renewal occurred.
With the built-up land successfully mapped, I can now lay the foundation for delimiting the size and location of major land use groups and urban communities, within which land cover has changed from non-built-up to built-up in the same year. The method cannot discriminate between adjacent land parcels that have different land uses, however, because these parcels were built in the same year and, moreover, were built in an urban area that had existed for a long time. To surmount these difficulties, I make use of the current road networks, which are especially dense in the downtown area, for two reasons. One is their relative pattern persistency and the other is that they dissect the urban core area into blocks and further split the land parcels built in the same year along two sides of the road. At the end of all these classificatory procedures, I am ready to consider land parcels, either the small pieces of land developed in the same year or the blocks in the downtown area that have dense road networks, as the basic spatial pattern of land parcels that have the same use.
Before the land cover map can be used, its accuracy needs to be carefully evaluated (Appendix B). Evaluation suggests that my method's first step, which requires digitization of built-up areas on a yearly basis, is successful. Expansion in the peri-urban area, displayed at 30m pixel-size and at one-year or minimal years intervals, accurately shows the size and location of land parcels that are one-time conversions from non-built-up to built-up. The use of phenology, topography, and road network to infer land parcel size and location—a process I have called data-driven—has demonstrably born fruit. Pre- and post-classification processing enables me to capture the change of built-up areas consistently and with an accuracy of annual change achieving 78 percent in the peri-urban area (Appendix B). Cumulatively, by early 2014, the end of my research period, accuracy was above 90 percent.
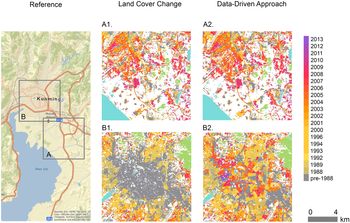
To visually compare the results from the traditional approach (i.e. merely relying on satellite images) and the data-driven approach I have just noted, in which I rely on a wide variety of data, I selected two typical areas in an urban corridor that stretches from downtown to peri-urban area and the countryside. These are an area at the city center that has undergone periodic renewal (Figure 3A), and a peri-urban area that has undergone rapid expansion (Figure 3B). My data-driven approach produces consistent results across space, which suggests that it can exploit the feature distinctions across training samples.
Land Cover Change in Downtown and Peri-Urban Areas

Second Step: Primary Categories of Land Use
Before I proceed to identify the primary categories of land use, I need to draw attention to how my classification differs from those produced by the Chinese government and leading web mapping companies. I take this step to avoid confusion and to point out certain weaknesses in existing categories. In the past three decades, the Chinese government has periodically updated their definition of land use type in a direction closer to standards set in the US and Europe. Nonetheless, the newer Chinese versions still show the government's proclivity to confuse or distort. True, one sees the commonly accepted categories of residential, commercial, manufacturing, public services, and transportation, but government mapping may conflate political agencies with civil services or omit some unwanted categories altogether.Footnote 17 For example, residences of high- and low-level civil servants are collapsed into one category, masking stark differences in their prestige and power. To give another example, urban villages can be picturesque tourist attractions, but they can also be slums that are damaging to the image of political leaders, and for that reason omitted. In contrast to the government's proclivity to collapse or omit, web mapping companies boast hundreds of land-use categories, reflecting business needs and consumer demands. Thus, locations of eating places—from food stalls to the most luxurious restaurants—are listed, as are shopping amenities that range from old-fashioned stores to the fanciest boutiques. Ever more discriminating definitions of the categories are introduced to keep up with ever growing consumer appetite for variety in goods and services. But, again, urban villages are not acknowledged. They seem an embarrassment to both government and merchant entrepreneurs.
To circumvent these interests and biases of both business and the government, I define categories by an interest—even bias—of my own, which is the political, economic, and social significance of urban life. For this reason, rather than map specific types of land use, I map primary categories, for these most clearly indicate the hierarchical standing of the people who work or live there. That hierarchical standing, revealed in the ways the rich and the poor, the politically important and unimportant, live apart and yet intermingle is unique to China, for reasons of recent history. After land reform in the 1950s, land was owned collectively. In the 1980s, land and property rights were restored, but even so, new uses of land still showed vestiges of communal use, outstandingly, in the new offices and factories of a designated development zone, but also in residential communities that were rapidly expanding. I outline seven primary categories in Table 2 and Figure 4. They show the political, economic, and social forces at work.
Layout and views of typical land uses and communities

With the primary categories of land use thus defined, how are they to be identified? To address this question, I use the parcels of land and their positions with respect to POIs in the seven categories that are shown in Table 2. Often a land parcel is overlaid with or surrounded by several POIs, each of which carries descriptions of land use in the same three-layered (political, economic, social) structure. It is precisely the political, economic, and social forces that shape the urban space and turn the urban development into a variety of communities and entities. To identify the land parcels from the previous step with the correct primary land use category, I make use of the massive amount of POIs that I collect. I code the POIs in a hierarchy of political, economic, and social structure as well as their physical interpretation in assistance of categorizing primary land uses.
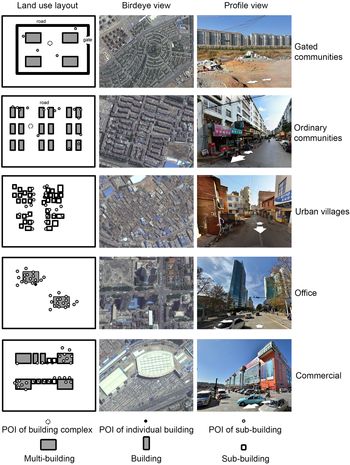
To code the POIs, I summarize them by their physical size, the spatial relations corresponding to each land parcel, and suggested land use types from their metadata. Based on the size of POIs, I categorize a POI as consisting of building complexes, individual buildings, and sub-size buildings. For instance, a POI of a real estate gated community indicates a large area that contains not only residential buildings, but also other types of building (e.g., bank or shop). By contrast, a POI of a hair salon only indicates a tiny store among other stores on the first floor of a building. In a similar way, a POI that indicates an airport is drastically different from a POI that indicates an ATM. Only a handful of POIs fall under the category of building complex—a category that includes factories, real estate communities, and airports, some of which may cover acres or occupy an entire city block. Other than building complexes are stand-alone buildings such as museums, libraries, and gymnasiums. Most POIs co-occupy a single building and belong to the sub-building category of store, restaurant, hair salon, and so forth.
I also use the information of distance to POIs in the consideration of land use identification. Rather than using all POIs and giving them equal weight, I designate a threshold of distance to each type and size of the POIs near a land parcel and use the distances as features in the later steps of classification. Specifically, I estimate one feature as to whether a land parcel is located within 500 meters of a POI that indicates a building complex, and another feature as to whether the land parcel is within 150 meters of a POI of an individual building. Moreover, the distance to different types of POIs can be indicative of land use. For example, a parcel of land that is close to shops and real estate POIs is more likely to be residential than commercial. Moreover, I calculate the number of POIs in the types of shops and offices positioned directly on a land parcel. The idea is that the POI of a real estate community surrounded by several restaurants and shops still warrants its being classified as residential; likewise, an office complex that has mostly offices but also a few shops remains an office complex. I include these binary distance features for the POIs of recreation, transportation, manufacturing, office, and miscellaneous types in my classification step (see Appendix C).
Lastly, I extract features from the land use types defined by the commercial mapping companies in the metadata of POIs. As I previously noted, commercial mapping companies all have the proclivity to over-produce POIs for business in pursuit of profit. Nonetheless, these POIs, with their types numbered in hundreds, still can be useful to identify the primary land use categories that I am interested in. I coalesce multiple types of urban land use to simply seven primary categories corresponding to Table 2. To eliminate potential bias of one particular mapping company, I use both Tencent and Baidu to extract features of land use types. Outstandingly, Tencent Maps provide a broad 20 categories for all its POIs, ranging from healthcare to cultural venues. Baidu Maps, in contrast, offers more POIs of the same establishment at multiple locations to deliver its spatial granularity. For example, a real estate community may have its four gates, on the north, south, east, and west, respectively earmarked on the Baidu Maps. I therefore code the categorical information associated with Tencent Map as a feature and calculate the number of POIs from the Baidu Map on each land parcel as other features.
Altogether, I have 23 features defined for each parcel of land: the distance to six sizes of POIs respectively, the distance to eight different types of POIs respectively, the number of POIs in shopping and small business respectively positioned on each parcel, the year of development from the first step, and the size of the parcel. Having all these features prepared, I use a supervised machine learning algorithm, a Logistic Regression Classifier, to categorize the primary use of land according to them. In lieu of the first step, it also takes three steps: identifying training samples, using the machine learning algorithm for classification, and evaluation. I discuss the technical details of the machine learning algorithm in an appendix (Appendix C).
I evaluate the map's accuracy by using the testing sample. The results of my evaluation show that land use classification reaches an acceptable level of accuracy. Overall, it reaches 78 percent. Variation from one category to the other is large, however. Thus, in commercial, office, recreational, and residential categories, accuracy reaches levels of 88 percent, 60 percent, 67 percent, and 80 percent respectively. This is satisfactory, but in manufacturing and transportation, it is lower.
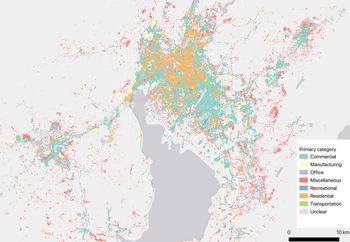
To help inspect the evaluation's results visually, I make a map that covers both the downtown and peri-urban areas of Kunming in major land use categories (Figure 5). It is quickly obvious that the downtown area is primarily for residential use with other uses such as upscale commerce, office, and recreation mixed in. The area reserved for recreation includes buildings of historical significance, for the city's draw goes beyond mere housing. Outward from downtown, land uses are mixed and include residences and industries that have had to move out when the urban core expanded, newly built residences for new residents, new commerce and industries, as well as old stores and factories that have somehow escaped removal. Still farther out from the city core is the peri-urban area where land uses are even more mixed and include villages, isolated farmsteads, new communities, offices and industries that seek not only cheaper land but also escape from the governmental regulations that apply to the urban core. Residential use being dominant in the city, the relative value of its subdivisions provides an index to the socio-economic status of the people who live there.
Primary Land Use in Kunming

Third Step: Urban Communities with Different Socio-Political Statuses
I turn to residential land use's subcategories, which are gated communities, work-unit communities, urban villages, and government residences. Gated communities are mostly walled estates, inside which are either high-rise buildings or small condo apartments, surrounded by grassy lawns or landscaped gardens.Footnote 18 Architecturally distinctive, gated communities symbolize high social status to the Chinese nouveau riche. Work-unit communities are apartment buildings of six to eight stories, built in the Soviet-era style and compactly arranged.Footnote 19 They once catered to workers who belonged to work units, but now are largely transformed into tenement housing for people of modest income. Urban villages are groups of small houses of one to three stories, confined in small urban spaces, and of substandard construction. Some of them were once villages surrounded by farmland but became engulfed by new urban development. Others were built in the process of urbanization, as the demand for affordable housing surged and the supply for it was lacking. Urban villages frequently turn into havens for migrant workers, students with a degree and little else, and the unemployed—in short, a ragtag assortment of people trying to make ends meet.
Where and how people live matters, yet this topic is underrepresented in works by scholars of modern China. The reasons? Residential communities are poorly documented, including by internet maps. Not all urban communities have POIs. Even if they do, their size and location remain uncertain because their POIs are not indicative of their size and boundaries. In some work-unit communities and in almost all urban villages, there are no POIs to draw attention to. For example, dormitories in schools, hospitals, and state-own enterprises are often left out. POIs exist for these institutions, but not necessarily for their dormitories. In government compounds, there are residences that were once exclusively used for government officials but are now open for sale or rental to others. These, too, cannot be taken as government offices. In the same manner, the residential part of small restaurants, convenience stores, and hair salons in urban villages is edged out by a multitude of commercial uses and are often neglected in government statistics.
I first classify residential use into gated communities and work-unit communities, based on their physical characteristics as well as their price and the availability of services. To locate and map gated communities, I use detailed information from a number of sources, including (1) the sale and rental record on a real estate website that supplies information on basic construction type, whether the buildings are villas or high-rise (>10 stories), price of an apartment, number of bedrooms and living rooms in a unit; (2) POIs that provide supplementary information which, by indicating the type and number of surrounding services, can change a community's classification from gated residential to work-unit residential, or to some other category altogether. The information on the gated communities and work-unit communities listed on the real estate website, including the addresses and size of the urban community, often have been verified by the commercial companies and are thus accurate. On the other hand, the number of POIs that indicate shops and small businesses on the land parcel can identify the work-unit communities, for these communities often have a large number of shops and services at the ground floor. This helps identify gated communities and work-unit communities. Dormitories in the government compounds are also identified.
The information about urban villages is less accurate for the reason noted earlier: documentation of these communities, even on commercial websites, is quite often incomplete and lacking. For this reason, I incorporate social media data and obtain from it the temporal pattern for each land parcel. The temporal pattern of social media posting at residences may confidently be assumed to differ from the temporal pattern of workplaces in three ways (Appendix D). First, users of social media at home are likely to send more social media posts during off-work hours, early in the morning and late at night than during work hours on weekdays. Second, they are likely to send more from 9 am to 5 pm during weekends than during weekdays. Third, they are likely to send more during holidays and special occasions when they stay at home for family gatherings (e.g., the Eve of Spring Festival). Based on these criteria, I designate land parcels that were previously categorized as commercial as urban villages to the extent that the temporal pattern of posts satisfies two of the three criteria noted above.
To evaluate the classification result for the subcategory of residential use, I randomly select a sample of points with the assistance of Tencent Street View and Google Earth high resolution images: 56 points in gated communities, 57 in work-unit communities, 10 in government residence, and 62 in urban villages. I then assess the accuracy of the computational classification by comparing them with the correct labels. The result shows my method to be accurate. Gated communities are classified at an accuracy of 84 percent, work-unit communities are classified at an accuracy of 42 percent, government residences are classified at an accuracy of 100 percent, and urban villages are classified at an accuracy of 74 percent.
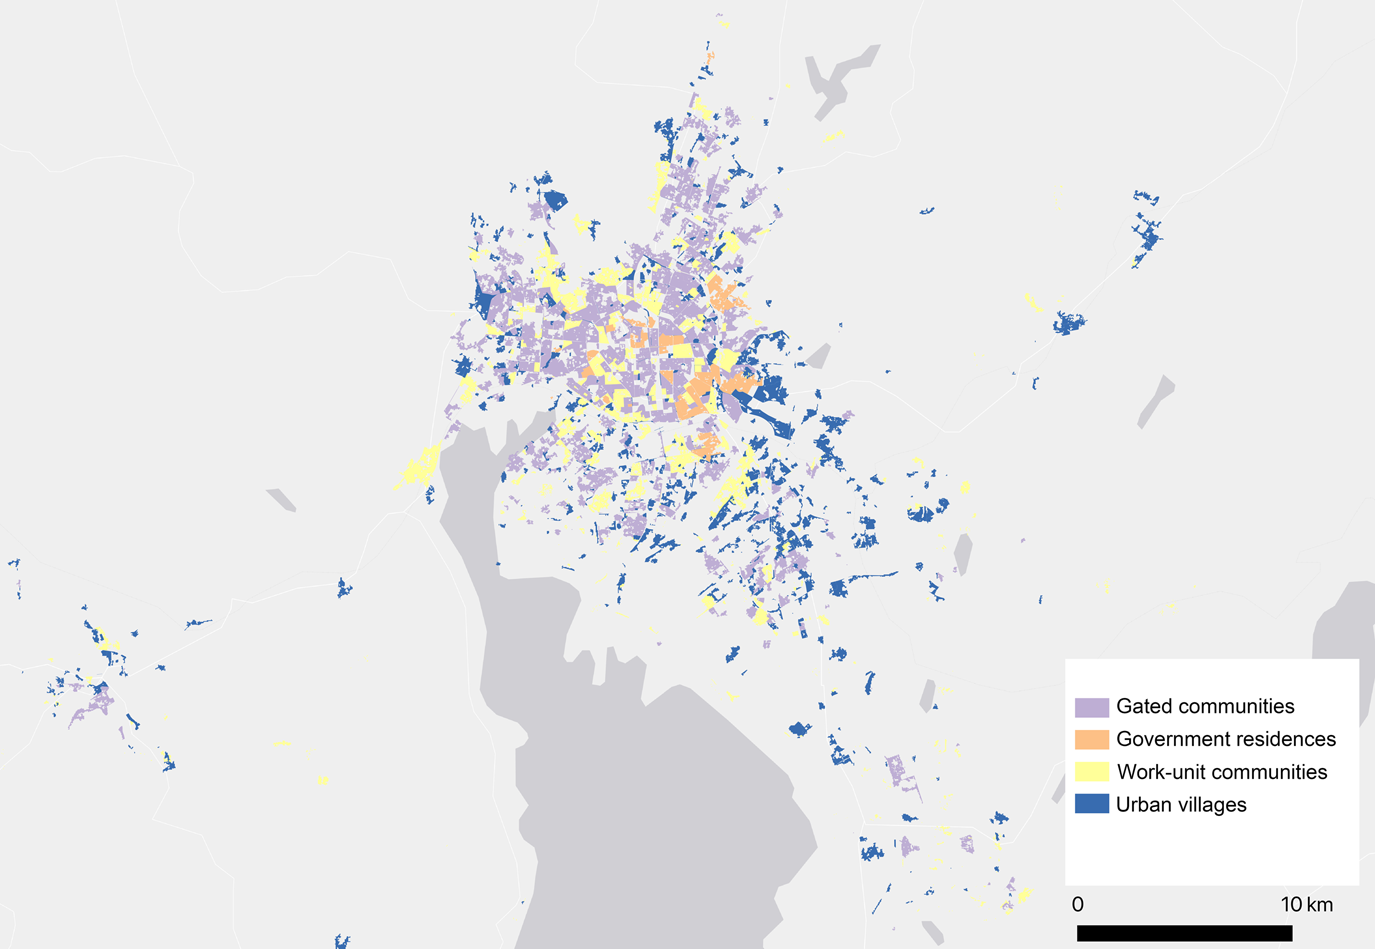
A visual inspection of Figure 6 shows how these communities are distributed. In the downtown area where many POIs indicate land use and where social media are abundant, gated and work-unit communities are easily distinguishable from one another, even though both occupy already developed space. In the peri-urban area, where built-up patches are interrupted by natural features such as lakes and green space, gated and work-unit communities are even more clearly bounded and so distinguishable. Urban villages, by contrast, are fragmented and shapeless. They do not fit into zones and appear to scavenge for urban spaces that are either undesirable or taken up by other uses.
Urban Communities of Different Socio-political Statuses

Discussion
My map of communities across time and space shows that detailed information concerning the political, economic, and social nature of Chinese cities can be obtained by means of a data-empowered method, when little information comes from official sources. My three-step approach is complemented and enhanced by using not only datasets, both new and newly accessible, but also by knowledge acquired from various disciplines and, importantly, a willingness to interpret, based on my extensive exposure to statistics. What have I achieved? What is the potential of my method? The core content of the article should answer the question, but I would like to add certain findings that I could not emphasize in the body of the text without stalling its narrative flow. These are urban expansion and renewal, mixed-use spaces, and a data-driven approach.
Urban Expansion and Renewal
Urban expansion, particularly in the United States, is usually understood as urban sprawl, or to put in another way, as occurring along a horizontal plane. As such, it is accurately recorded by satellite images, which offer the view from above. However, in Kunming, the city has also expanded vertically, as any side-view of skyscrapers makes clear. Horizontal expansion shows a clear pattern of government stimulation and control, for most of it follows along or near the road networks that the Kunming municipal government has built and away from wetland near Dianchi Lake and forest areas surrounding the city. Thus, to a degree, government urban planning has been effective. As to expansion in the vertical direction, urban change in recent decades is from an expanse of scattered low buildings, with a clutch of taller ones at the center, to a forest of sky-reaching giants. Kunming urban planners apparently have no defined skyline to guide vertical growth or even care about their city's skyline as American planners often do theirs. I reconstruct the sideview from the resident's use of smartphones and their real estate trading records online. From these two views, side and vertical, I gather information of, say, gated communities in Kunming, their social standing, the services they require, and the newly paved roads circulating in their midst (Figure 3B2).
Mixed-use Spaces
My maps of land use in primary categories and of urban communities also show highly mixed use. In Kunming, the government of Kunming municipality is reallocated in the newly designated development zone, while the provincial government is located in the old city proper. In the newly designated development zone, land use is planned and often takes a geometric form. In this zone, government buildings are surrounded by gated communities where high officials and the rising class of businessmen live. Mixed within this zone are commercial establishments that cater to the needs of gated-community residents (Figure 5). In the old city proper, the provincial government buildings are surrounded by business offices, gated communities, work-unit communities, and recreational spaces.
As for urban villages, ramshackle houses are a common sight (Figure 6). They do not, however, constitute an expanse of poverty and urban decay that one often finds in US cities. Instead, poor and struggling people in Kunming live in fragmented patches of land, as the term “urban village” or the more universal term “urban slum” suggests. Moreover, gated communities, work-unit communities, and urban villages intermingle to a surprising degree, apparently in disregard to differences in social status. Also surprising, because in apparent disregard of the prestige of office, is that government residences, too, are scattered across the city, some in gated and some in work-unit compounds. In this indifference to the use of residential zoning to reflect socioeconomic status, Chinese cities are more like old European cities than are cities in America, where spatial location often reveals one's social standing. Fieldwork done by a team of urbanists will gain a view of Kunming that shows details of land use and its political and economic implications of the sort I have sketched above. My article makes the case that, in the absence of such a team—in the absence of even the possibility of such a team producing a work that is then made available to the public—a realistic map of the city can still be constructed.
A Data-Driven Approach
In the study of Chinese cities, crucial empirical evidence such as fine-grained land use, residents’ social networks, and their social or political preference, is simply missing. Even if evidence exists, it may come from a small number of observations at snapshots of time and place and thus lack representativeness for the entire community or city. The data-driven method I propose solves the representativeness problem by collecting data from as many sources as necessary and then integrates the data collected with the method's two principal components, the inter-scalar and the circumstantial. The former is integration at different scales.Footnote 20 The zooming camera provides a simple example. From the air, the camera's lens opens to cover an entire neighborhood, then narrows until it targets a house, in the process of which information is gained about the house that could not have been collected without the prior view of the entire neighborhood. Zooming enables information from what one sees at one scale to be transferred to and integrated with what one sees at another scale.
Circumstantial integration, the other component I propose, infers from indirect evidence that may capture the nature of a place, a person, or an event for which no direct evidence is available. Such evidence needs to be abundant and digitizable for firm conclusions to be drawn. At the opposite extreme in the use of circumstantial evidence is to draw a conclusion based on a single fact and a negative one at that. Was China in the ninth century a peaceful and well-governed empire? Can one say “yes” because the Japanese monk Ennin, who travelled widely over it, did not record in his diary a single encounter with brigands?Footnote 21 More convincing as indirect evidence is where numerate data is available, but most convincing of all is where abundant digital data exists. A case in point is the socioeconomic standing of residential compounds in a modern Chinese city. I do not have direct evidence of their standing, but I do have indirect evidence, namely, the movement of bureaucrats in and out of government buildings, their times of arrival and departure, and more importantly the regularity of these times, for irregularity is an indication of the bureaucrats’ high status and their residential compound's prestige.
Conclusion
Digitization has significantly expanded the scope of the social sciences and humanities and will no doubt do even more for them in the future. Certain areas remain unaffected, however, the most obvious of which is value. In literature, digitization may help one see that Shakespeare's vocabulary is far larger than that of his French near contemporary, Racine (24,000 to 2,000, according to ArnottFootnote 22), but that fact does not allow one to judge as to who is the superior playwright. In the social sciences, digitization has much to say about how institutions work, but little about what constitutes a good institution. Besides value judgment and conceptualization framework, another area that seems to lie beyond the need for digitization is culture. As ethnographers understand the term, culture consists of the distinctive customs and practices of small, isolated human groups. Understanding their way of life or culture calls for prolonged field exposure, empathetic observation and interpretation, rather than skill in computational methods.
China's ethnic cultures engage the attention of ethnographers. China itself is a large modern society, however, the study of which is aided by the sort of digitization and computation I have explored. Modern society is “rational” to the extent that it is based on a structure of power, structure being geometric and abstract as compared with, say, power's sartorial insignia, the Chinese emperor's brocaded yellow robe, for example. Modern society is also rational to the extent that its economic base depends on a marketing system that operates impersonally rather than on the passions and desires of select individuals. To study modern Chinese society, I have therefore used a data-driven approach that is itself, in intent, rational and abstract.
Critical thinking is at the core of literary and humanistic study. I hope I have also demonstrated it in my use of the data-driven approach. Deciding on what is and is not appropriate data, its possible biases, the right algorithms in analysis, and so on, is critical thinking that the data-driven scholar must command. But such a scholar has an even closer affinity with his humanist counterpart, which is sensitivity to the use of language—the meaning of words. To study Chinese cities, one cannot simply take over, for example, the land use categories of American planners, or use the words “suburb” and “slum” of Chinese cities without qualification when they invoke quite the wrong images.
Throughout this article I have contraposed, at least implicitly, between an Olympian's perspective from high above ground and a field worker's perspective on the ground, between one who generalizes and one who particularizes, between the theorist and the empiricist. Interestingly, “theory” is Greek for “speculation” or “spectator.”Footnote 23 The ancient Greeks seemed to have favored the spectator who, high on the bleachers of the stadium, sees the players at their game and understands what is going on. The players themselves, covered in dust and sweat, are too engaged to know. So the spectator (theorist) thinks. Naturally, the players think differently: they who are aware with their body's every straining muscle where to run or throw the ball are the ones who truly know the game. Both spectator and players have their point. In this article, I have taken more the spectator's position in that I have tried to show how a data-driven approach can contribute to not only seeing the pattern of life, but also—here and there—its dense details.
Supplemental Material
To view supplementary material for this article, please visit https://doi.org/10.1017/jch.2019.42