Until very recently, the Republican Party not only lacked color with respect to its voters, a case that still persists, but rarely could one find a minority Republican at the helm of a high-profile political office.Footnote 1 This is no longer true. Over the past decade, a growing number of minority Republican candidates have contested and won elective positions at the highest levels of government. For instance, Latino Republican Senators Marco Rubio of FL and Ted Cruz of TX are both presidential contenders, and Hispanic Governors Brian Sandoval of NV and Susana Martinez of NM are both considered Grand Old Party (GOP) rising stars. Likewise, Indian-American Governor of LA, Bobby Jindal, first elected in 2007 and reelected in 2011, sought the 2016 Republican presidential nomination. In SC, the setting of this study, Indian-American Governor Nikki Haley and African-American Senator Tim Scott cruised to decisive victories in the 2014 elections.
These changing political dynamics provide an opportunity for political scientists to reconsider what we know about voting behavior and the public's willingness to support minority candidates. In this study, we utilize a unique set of circumstances in the 2014 elections in SC to investigate support for minority Republican candidates. We rely on survey data from The Winthrop Poll, a statewide public opinion poll administered at least four times annually, to determine which respondents are the core supporters of two minority Republicans. We also take advantage of the unique circumstances of the 2014 SC contest to examine support for just the white candidate but not the minority candidates, and vice versa. In our analyses, we account for a host of variables including race, ideology, partisanship, political conservatism, regional identity, Tea Party approval, and racial conservatism. Our findings make it clear that in a heavily Republican Deep South state, minority Republicans Nikki Haley and Tim Scott are more popular than their white Republican colleague Lindsey Graham, and yet there still appears to be some evidence that a small segment of the white electorate harbors racial prejudice toward minority Republican candidates.
In the next two sections, we review literature that evaluates support for minority candidates, noting that there are few studies that examine this topic in the context of minority Republicans. We discuss why running under the label of the more ideologically conservative major party in American politics should produce a different dynamic in terms of the response of voters toward a minority Republican candidate. Next, we undertake multivariate analyses of candidate approval and then vote choice with respect to Haley, Scott, and Graham. With regard to approval, we first look at overall approval toward each candidate and next model approval for just the white candidate (but not either of the minority candidates) and then just for the minority candidates (but not the white candidate). In part, this strategy allows us to see if white respondents are more or less likely to register approval for just the white Republican candidate (and hence disapprove of the minority Republicans), controlling for other factors. In the vote choice models, we confine the analyses to only those respondents claiming to have voted in all three contests, focusing on three separate models (vote for Haley, vote for Scott, and vote for Graham). We conclude with a brief restatement of the importance of our findings, placing them in the historical context of a racially conservative southern state such as SC.
RESEARCH ON MINORITY CANDIDATES
Prior to the election of the nation's first African-American president, Barack Obama, the research was fairly consistent about the challenges facing black candidates in majority white districts. When blacks did get elected to Congress, it most often occurred in a majority–minority district (Lublin Reference Lublin1997). Looking simply at the election results and district characteristics, a reasonably clear conclusion emerged—white voters preferred white candidates to black candidates (Bullock and Dunn Reference Bullock and Dunn1999; Canon Reference Canon1999).
What reasons explain the tendency for white voters to support minority candidates at lower rates? There is certainly evidence that racism continues to play a role (Reeves Reference Reeves1997; Tesler and Sears Reference Tesler and Sears2010), and studies have also shown that white voters perceive black candidates as less competent (Sigelman et al. Reference Sigelman, Sigelman, Walkosz and Nitz1995), more liberal (McDermott Reference McDermott1998), and more concerned with minority rights (McDermott Reference McDermott1998) than white candidates. There is even evidence that whites will express more support for lighter skinned black candidates than darker skinned black candidates (Terkildsen Reference Terkildsen1993).
The 2008 presidential contest provided an opportunity to reevaluate many of these research findings. On its face, the election of an African-American U.S. President by a majority white electorate provided a considerable challenge to the political science literature investigating the reasons for the lack of support for minority candidates. And yet, despite Obama's historic victory in 2008, most studies show that racial prejudice remained an important factor, making the election much closer than it would have been if a white Democrat were on the ballot (Kinder and Dale-Riddle Reference Kinder and Dale-Riddle2012; Schaffner Reference Schaffner2011). For instance, one study found that racial salience cost Obama up to 3% of the white vote in 2008 (Highton Reference Highton2011). Racial prejudice was also present in 2012, and according to one estimate, caused Obama to lose about 4% of the popular vote (Stephens-Davidowitz Reference Stephens-Davidowitz2013).
Most importantly for our purposes, the research on minority candidates in the United States has focused almost exclusively on minority Democrats. However, as we will discuss in the next section, there has been a growing number of minority Republican candidates in recent years, allowing us the opportunity to develop a better understanding of the factors influencing a voter's willingness to support a non-white nominee representing the more ideologically conservative party in American politics.
RESEARCH ON MINORITY REPUBLICANS
The recent spate of minority Republicans tenured in top positions such as governor and senator prompts the question of whether their victories derive from the same base of supporters who place white Republicans in these offices. As we noted above, previous research focused on assessing whether voting behavior differed when minority Democrats sought high-profile positions (see Citrin, Green, and Sears Reference Citrin, Green and Sears1990; Sonenshein Reference Sonenshein1990; Strickland and Whicker Reference Strickland and Whicker1992; Traugott and Price Reference Traugott and Price1992). But this line of research, we contend, is fundamentally different from the converse scenario of a minority Republican running for high office (Sigelman et al. Reference Sigelman, Sigelman, Walkosz and Nitz1995). With rare exceptions like the late former Senator Edward Brooke of MassachusettsFootnote 2 (Becker and Heaton Reference Becker and Heaton1967), white voters and particularly those in the contemporary American South, had no opportunity to vote for a Republican African-American Senator until now. Similarly, until the emergence of Republicans Bobby Jindal and Nikki Haley, Dixie had never witnessed the presence of an Indian-American on the ballot for governor. These scenarios provide an opportunity to reconsider the literature on minority candidates by giving voters an opportunity to support a minority candidate who shares the party affiliation and political views of a more conservative and overwhelmingly white electorate.
Part of the reason for the recent electoral success of minority Republican candidates is that they have positioned themselves to be as conservative (if not more so) as white Republican candidates (Hood and McKee Reference Hood and McKee2015). Indeed, in the modern GOP, which is accurately characterized as more hardline in its ideological purity than the Democratic opposition (McCarty, Poole, and Rosenthal Reference McCarty, Poole and Rosenthal2006; Theriault and Rohde Reference Theriault and Rohde2011), a minority Republican candidate who is not viewed as very conservative would have no chance of securing the party nomination. Nonetheless, the overwhelmingly white electorate that puts Republicans in office, and especially in a Deep South state like SC, where racially polarized voting along partisan lines is the norm (McKee and Springer Reference McKee and Springer2015; White Reference White2014), makes the political success of Haley and Scott all the more puzzling. It is the incongruity between the racial profiles of these Republican incumbents and that of the Republican electorate of the Palmetto State that fuels the impetus for this research.
In SC, a fortuitous set of circumstances unfolded as the 2014 midterm elections neared. First, rather than seek another term, Republican Senator Jim DeMint vacated his seat to lead The Heritage Foundation. This allowed Governor Haley to make history by appointing First District Congressman Tim Scott as DeMint's replacement. Second, Haley and the newly appointed Scott both chose to seek election to their current positions in 2014.Footnote 3 Third, the term of Republican Senator Lindsey Graham was up in 2014 and he decided to seek reelection. Thus, the presence of two minority Republicans and a white Republican on the general election ballot in 2014 allows us to determine what variation if any, exists in terms of approval and voter preferences for these three candidates. We do need to emphasize, however, that two of the candidates were running for U.S. Senate seats and one candidate was running to be reelected Governor. Since these are different offices, we believe readers should consider this caveat when digesting our results.
Recent research related to ours has found that white voters appear to be just as supportive of minority Republican candidates as they are white Republican nominees running for the U.S. House (Highton Reference Highton2004), as well as governor and senator (Hood and McKee Reference Hood and McKee2015).Footnote 4 The findings in these studies suggest that white voters backing minority Republicans are colorblind, because ideological purity is what conditions support and in this respect, minority Republicans pass the test. In effect, race is rendered irrelevant and instead ideology drives political behavior. On the flip side, another study found that in one particular analysis of vote choice, African-Americans were significantly less likely to vote for the black Republican Lieutenant Governor nominee E. W. Jackson in Virginia in 2013 (Hood, Kidd, and Morris Reference Hood, Kidd and Morris2015). But Jackson's abrasive demeanor sharply contrasts with the relatively softer styles displayed by Haley and Scott.
In sum, it appears that a candidate's race has become less relevant than party and ideology with respect to the voting behavior exhibited by both blacks and whites in contemporary American politics. On the one hand, African-Americans will stick with the Democratic Party, even if the GOP features a black Republican candidate because the latter will be correctly perceived as out of touch with the positions embraced by most black voters. On the other hand, whites will stay loyal to a minority Republican nominee because this candidate is likely to share the same issue positions as those favored by the base of the white GOP electorate.
With the use of three surveys administered by The Winthrop Poll, we are able to conduct multivariate analyses of approval and voter preferences toward Haley, Scott, and Graham. In addition to standard controls for demographic characteristics, we include a host of variables that tap into the conservatism of Palmetto State voters, which we expect to vary in their influence on opinions toward the aforementioned candidates. Because whites comprise the lion's share of Republican supporters, our models are first run with a control for the respondent's race and then we estimate the models again, limited to just whites. It is our expectation that support for these candidates will be based primarily upon those factors and characteristics that generally distinguish Democratic and Republican voters, with little role for racial prejudice to play in affecting opinions toward the minority Republican candidates (Haley and Scott) vis-à-vis the white Republican (Graham).
DATA AND METHODS
To investigate support for minority Republicans, we rely on survey data from The Winthrop Poll. The Winthrop Poll is administered at least four times a year by Winthrop University's Social & Behavioral Research Lab (SBRL). The SBRL uses professionally trained callers and a Computer Aided Telephone Interviewing system to conduct each of the surveys.
In this study, we rely on three polls from 2014. Two of the polls, the “April Survey” and the “November Survey,” were designed to measure attitudes and opinions of the state's general population and were therefore pooled for the analyses that appear below. The April Survey was conducted between April 6 and April 13, 2014, and included 877 respondents. The November Survey took place between November 9 and November 16, 2014. This survey had 852 respondents. Both of these general population surveys used Random Digit Dialing (RDD) and wireless phone number sampling. The samples were purchased from Survey Sampling International (SSI). The third poll, the “October Survey,” was in the field between September 21 and September 28, 2014. This was not a general population poll but instead a survey of “likely voters.” The October Survey included 1,082 likely voters. This survey also used RDD and wireless phone number sampling purchased from SSI, but also utilized Registration Based Sampling of wireless and landline phone numbers of registered voters that was purchased from Aristotle/VoterListsOnline.
We investigate several dependent variables in this study. First, using data from the April Survey and the November Survey, we examine a standard approve/disapprove question for Haley, Graham, and Scott. Using responses to this question we created a dichotomous variable where 1 = approve and 0 = disapprove. Second, in addition to considering support for candidates in isolation, the unique circumstances of the 2014 contest in SC allows us to determine the types of respondents who only approve of the white candidate, but not both of the minority candidates. In this scenario, we created a dichotomous variable where 1 = approval of only the white candidate (and disapproval of both minority candidates) and 0 = all other permutations. In addition, we are able to compute a variable that measures approval of only the minority candidates. Here, 1 = approval of both minority candidates (but not the white candidate) and 0 = all other permutations.
Our second category of dependent variable measures vote choice. For this, we rely on the October Survey. Respondents were asked who they would vote for “if the election were held today,” and then given a list of all candidates. In addition to Haley, the list of gubernatorial candidates consisted of Tom Ervin (a Petition candidate), Steve French (the Libertarian candidate), Morgan Bruce Reeves (the United Citizens Party candidate), and Vincent Sheheen (the Democratic candidate). The Graham challengers were Brad Hutto (the Democratic candidate and Working Families Party candidate), Victor Kocher (the Libertarian candidate), and Thomas Ravenel (a Petition candidate). In addition to Scott, the candidates were Jill Bossi (the American Party candidate) and Joyce Dickerson (the Democratic candidate). In all cases, callers rotated the answer choices.
Because we have dichotomous dependent variables, we employed logistic regression in this study. Moreover, the wide range of questions on the Winthrop Polls allowed us to account for a variety of independent variables in our statistical models. As a reminder, the April and November surveys were pooled to explore candidate approval, whereas our vote choice models analyzed data from the October Survey, which had a slightly different mix of questions.Footnote 5
Our models account for many of the standard factors that explain political opinions and vote choice, including age, partisanship, marital status, education, race, ideology (not available for the vote choice models), and sex. We also included some additional variables that we believe are particularly appropriate for our investigation of support for minority Republicans in the American South. For one, we included a dummy variable indicating whether the individual is evangelical/born again, since support for Republican candidates, particularly in the South, contains a large religious right component to it (see Green et al. Reference Green, Kellstedt, Smidt, Guth, Bullock and Rozell2013). We also include a dummy variable indicating whether the respondent approves of the Tea Party. The Tea Party has played an important role within the Republican Party (Skocpol and Williamson Reference Skocpol and Williamson2012) and both Haley and Scott were elected amidst the Tea Party wave in 2010—Haley as Governor and Scott to the U.S. House.
Given the continued importance of race in southern politics, the approval models include a question that measured attitudes toward blacks as a proxy for “racial conservatism.” The question asked respondents, “Do you feel that generations of slavery and discrimination do or do not make it difficult for blacks to work their way out of the lower class?” Finally, we included two variables measuring regional identity, dummy variables accounting for whether the respondent self-identified as a “native southerner” or a “converted southerner,” with the base category consisting of non-southerners. More recent immigrants to the South are notably less supportive of the Republican Party (see Hillygus, McKee, and Young Reference Hillygus, McKee and Young2015; Hood and McKee Reference Hood and McKee2010; McKee and Teigen Reference McKee and Teigen2016), and hence it is expected that compared with non-southerners, native southerners and converted southerners (those who although not born in the South, have come to identify with the region) will be more supportive of the three Republican candidates in this study. More details about our coding can be found in the Appendix.
RESULTS
We begin by highlighting some basic descriptive statistics from our surveys. Looking at the combined poll (April and November) we can gauge the approval levels of Haley, Scott, and Graham. Graham was the least popular, with a 47% approval rating among the general public. Haley and Scott had very similar approval ratings at 54% and 52%, respectively. The Winthrop Poll also allows us to combine responses to investigate how many individuals approve of only Graham, the white candidate, but not Haley or Scott, the two minority candidates. Only 7% of respondents approved of Graham but disapproved of Haley and Scott. Interestingly, twice as many respondents (14%) approved of Haley and Scott, but disapproved of Graham.
Turning our attention to voting, a majority of respondents indicated they would support each of the candidates in the October survey. Just over 56% of respondents indicated that they would vote for Haley, 60% said they would vote for Graham, and 65% indicated support for Scott. To leverage the unique circumstances of the 2014 contest in SC, we were also curious to see how many respondents planned to vote for Graham but not for the minority candidates. We found that only 5% of respondents indicated that they planned to vote for Graham but not for Haley and Scott. And similar to what we found regarding approval, twice as many respondents (10%) planned to support both Haley and Scott, but not Graham.
Approval Models
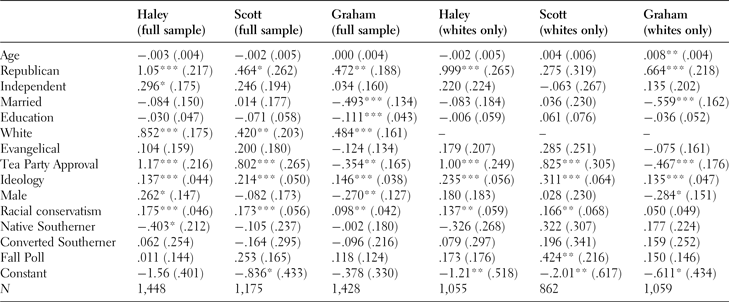
Table 1 displays the results from a series of models for approval of Haley, Scott, and Graham. Again, we model approval using a pooled survey that includes both the April and November data (“Fall Poll” is the dummy variable distinguishing the surveys). We also estimated the same models for the whites only sample. Looking at the results of the full sample models, Republican identifiers are more likely than non-Republican identifiers to approve of all three candidates. Similarly, whites are more likely than non-whites to approve of the three Republicans. Of course, this also means that minorities are less likely to support the three Republicans, including the two minority Republicans, Haley and Scott. The effect of ideology is always positive and significant, as well, indicating that more conservative respondents are more likely to approve of Haley, Scott, and Graham.
Approval of Republicans in SC

Source: Winthrop Polls, April 2014 and November 2014.
Note: Entries are logistic regression coefficients with robust standard errors in parentheses. All models were computed using sampling weights.
*p ≤ .10; **p ≤ .05; ***p ≤ .01 (two-tailed).
The variable indicating approval of the Tea Party is statistically significant for all three candidates but the effect is positive for Haley and Scott and negative for Graham. That is, individuals who approve of the Tea Party are less likely to approve of Graham than people who do not approve of the Tea Party. This finding makes sense given Scott and Haley's support among the Tea Party faction within the GOP, Graham's Tea-Party-backed primary election challengers, and the barrage of criticisms he has received from the right wing of the Republican Party (especially among Tea Party adherents).
We were surprised to discover that the racial conservatism measure is positive and significant in all of our full sample models. Perhaps most interestingly, respondents with a more conservative opinion about whether slavery and past discrimination affects African-American progress are more likely to support Haley and Scott than respondents with a less conservative opinion on this question. Given the limitations of our approach, we cannot know for sure what is going on here. It is certainly possible that white guilt may play a factor, but further analyses would be needed to determine the causal mechanism at work.Footnote 6 There were also some noteworthy findings about the effect of regional identity. As shown in Table 1, native southerners are less likely than non-natives to approve of Haley. We speculate that an adherence to traditional gender roles among native southerners may partially explain this finding. Native status, is not, however, related to approval of Scott or Graham.
The findings for the whites only models are similar to what we discovered when estimating the models using the full sample. Republicans are more likely than non-Republicans to approve of Haley and Graham but partisanship does not have an effect on approval of Scott in these models. Similar to the full sample model, in the whites only model, males, a core component of the Republican base (Schreckhise and Shields Reference Schreckhise and Shields2003), are significantly less approving of Graham. And again, Tea Party approval is a significant predictor of approval for all three candidates, indicating a positive effect for Haley and Scott, while negative for Graham. Interestingly, our racial conservatism measure is significant in the models predicting support for Haley and Scott, but not Graham. Among whites, regional identity has no significant effect on candidate approval.Footnote 7
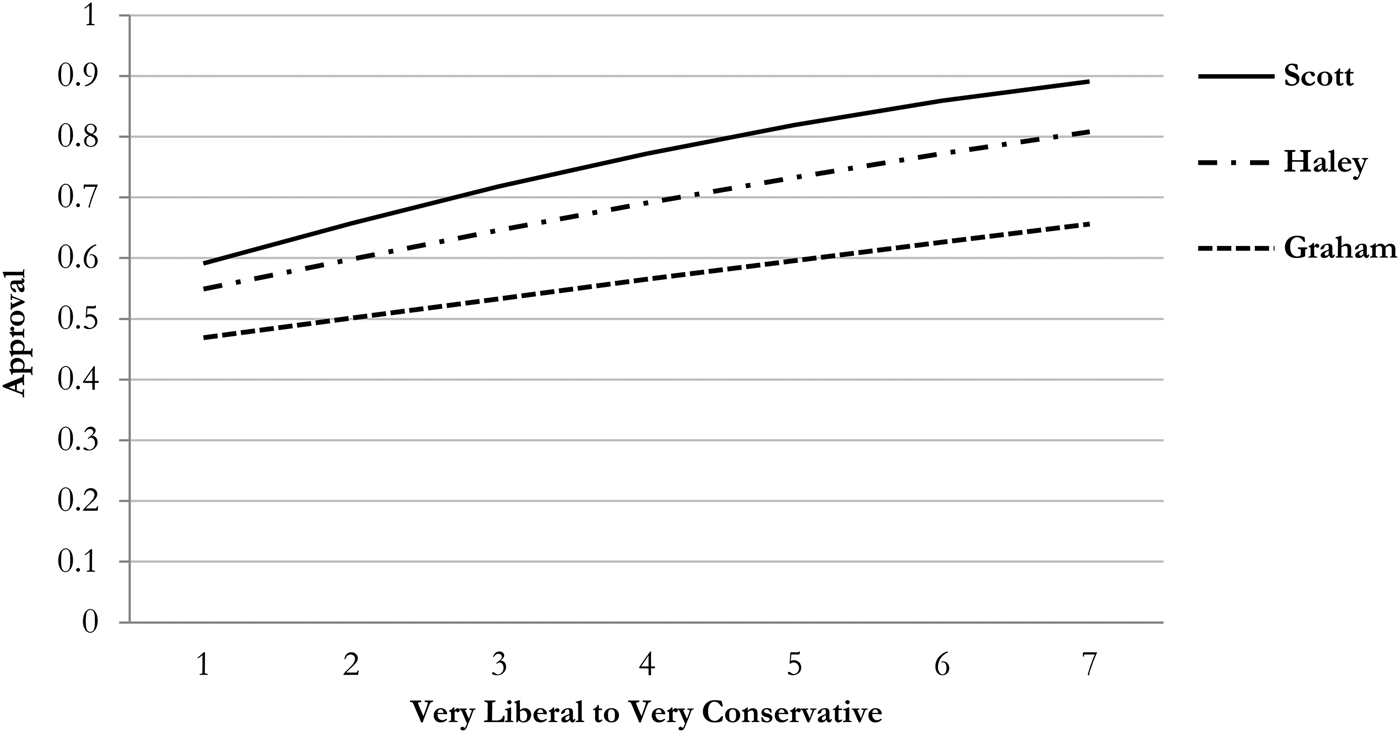
To gain a better sense of the substantive impact of some of the key predictors of candidate approval, we computed predicted probabilities for select variables in the whites only models from Table 1. Figure 1 displays the probability of approving of Scott, Haley, and Graham across the standard seven-point ideological self-identification scale holding all other variables constant. Overall, the pattern is fairly similar for all three candidates—the more conservative a respondent, the greater the probability of approval. In the case of Scott, a person with the most liberal identification would have about a .60 probability of approval while a person with the most conservative identification would have almost a .90 probability of approval.
Approval of Scott, Haley, and Graham according to Ideology. Note: Predicted probabilities were generated from the pooled models displayed in Table 1 (whites only). See the Appendix for the precise wording of the response options for the seven-point ideology variable

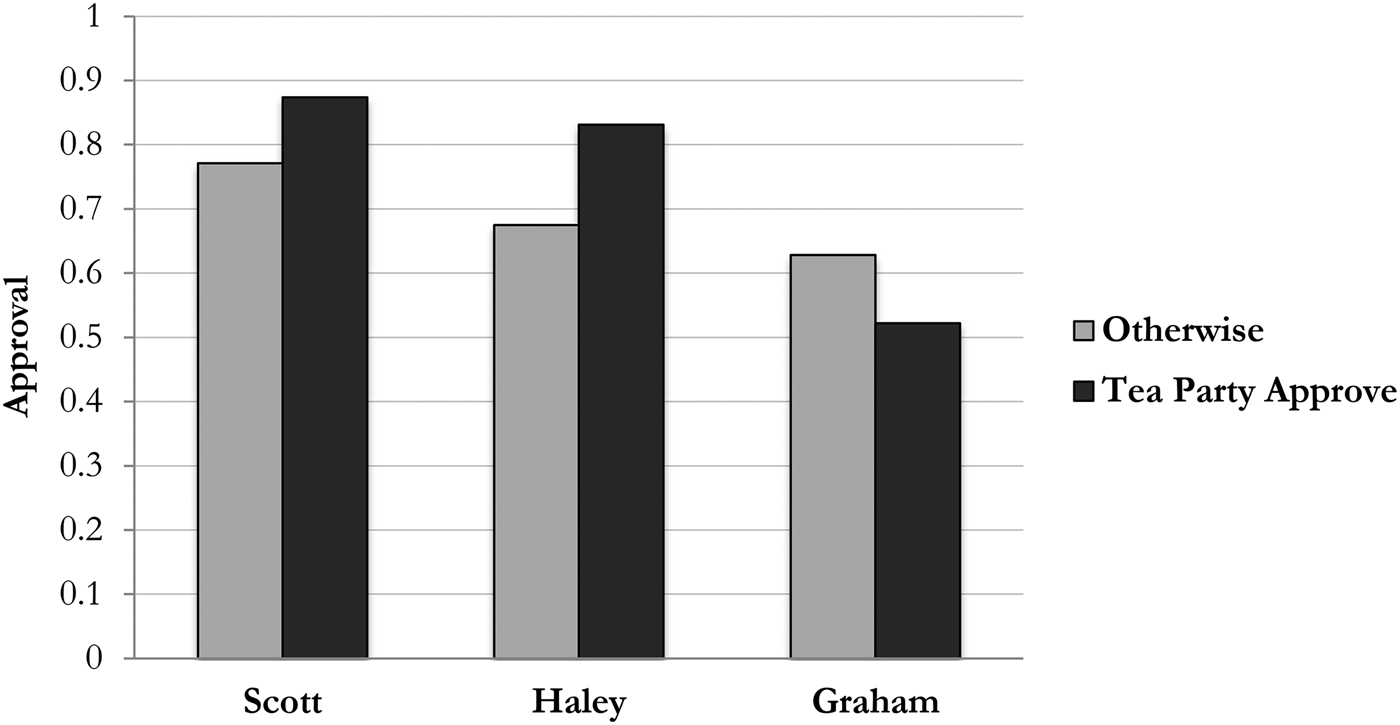
We also computed predicted probabilities to get a better sense of the substantive impact of Tea Party Approval. The results of this analysis appear in Figure 2. As we noted above, Tea Party approval has a positive effect on approval for Scott and Haley and a negative effect on approval for Graham. Respondents who approve of the Tea Party have a .87 probability of Scott approval while non-Tea Party approvers have a .77 probability of Scott approval. For Haley, the probabilities are .83 and .68, respectively. The substantive impact of Tea Party approval is much different for Graham. Tea Party approvers have just a .52 probability of approving of Graham, compared with a .63 probability for respondents who do not approve of the Tea Party.
Approval of Scott, Haley, and Graham according to Tea Party Approval. Note: Predicted probabilities were generated from the pooled models displayed in Table 1 (whites only). Tea Party approve = 1, otherwise = 0

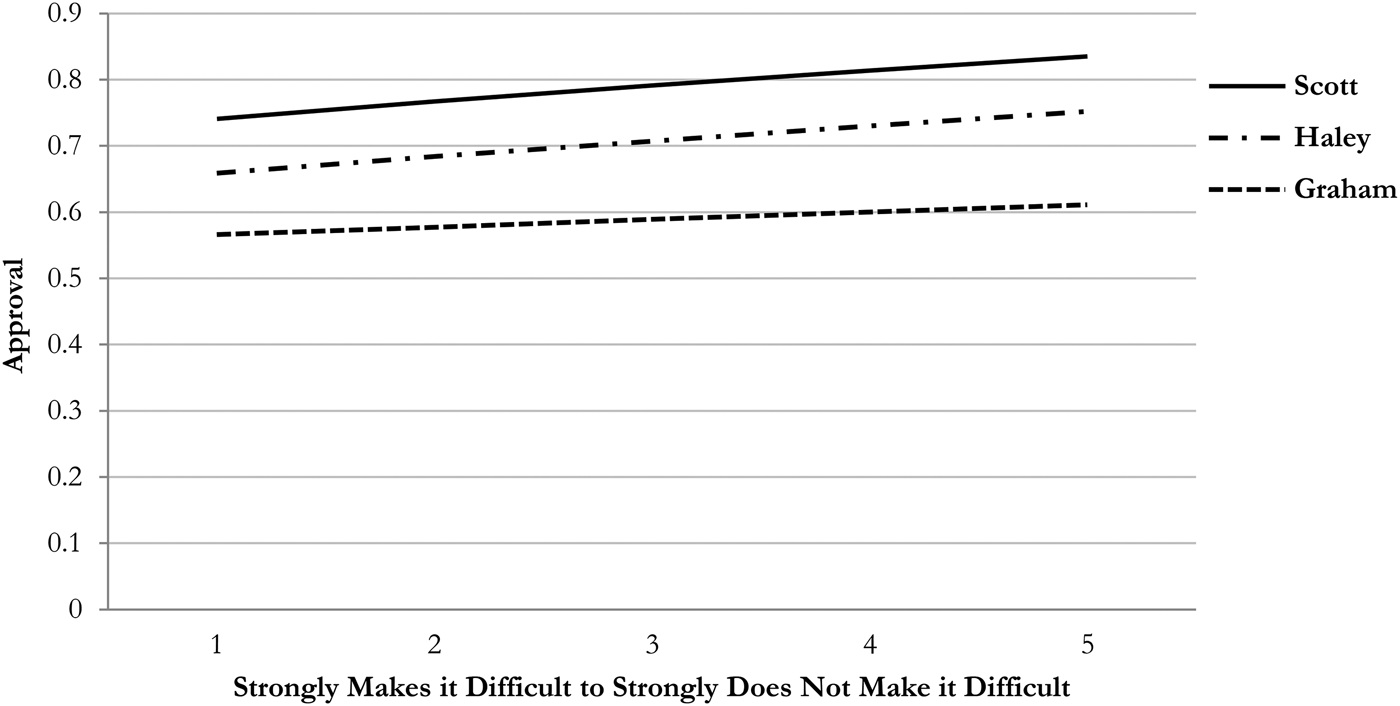
Figure 3 shows how the predicted probabilities for our three dependent variables changed across the range of response options for our racial conservatism question. Again, higher values equal a more conservative response to the racial conservatism question. The impact of racial conservatism was fairly strong, albeit less pronounced than the impact of ideological self-identification. Moving from the least conservative to the most conservative response category increases the probability of approval for Haley from .66 to .75. Likewise, the approval probability for Scott moves from .74 to .84. The change in approval probability is notably smaller for Graham, moving from .57 for the least conservative category to .61 for the most conservative category, a difference that is statistically insignificant.
Approval of Scott, Haley, and Graham based on opinions toward Black's Progress given a history of slavery and discrimination (racial conservatism). Note: Predicted probabilities were generated from the pooled models displayed in Table 1 (whites only). See the Appendix for the precise wording of the response options for the racial conservatism variable

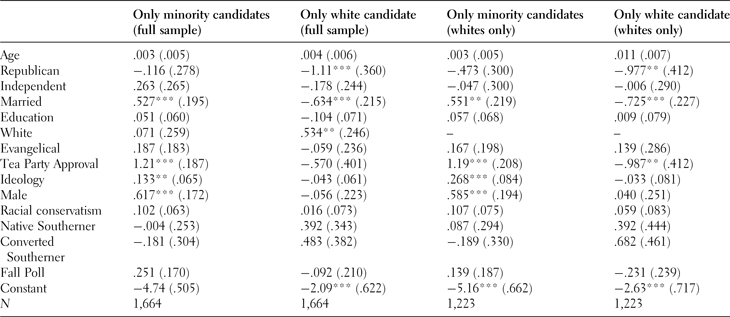
As noted above, we also created two additional approval variables to better leverage our unique dataset. First, we computed a dichotomous variable indicating approval of only the minority candidates and disapproval of the white candidate (0 equals some other combination of approval). The second dichotomous variable denotes approval of only the white candidate but disapproval of both minority candidates (0 equals some other combination of approval). Table 2 shows the results of our logistic regression models for both dependent variables. We also ran these same models for our whites only sample.
Approval of only minority candidates and only white candidate

Source: Winthrop Polls, April 2014 and November 2014.
Note: Entries are logistic regression coefficients with robust standard errors in parentheses. All models were computed using sampling weights.
*p ≤ .10; **p ≤ .05; ***p ≤ .01 (two-tailed).
Four predictors emerged as statistically significant in our first model. Married respondents were more likely to approve of only the minority candidates. Likewise, respondents who approved of the Tea Party were more likely to approve of just the minority candidates. This was not particularly surprising since both Haley and Scott rode the Tea Party wave to impressive victories in 2010. Ideology was also a significant factor, as conservatives were significantly more likely to approve of just the minority candidates. We also discovered that males were more likely than females to support just Haley and Scott. It is also important to note a few of the coefficients that were not statistically significant in this model. The Republican variable and our measure of racial conservatism did not have significant effects on support for only minority candidates. The results for our whites only model mirrored the results of the model for our full sample for this dependent variable.
We also computed two models to better understand the types of people who would support just the white candidate (i.e., approve of Graham, but disapprove of Haley and Scott). As displayed in the second model in Table 2, three factors were statistically significant in the full sample. Our dummy variable for Republicans was negative and significant, indicating that Republican identifiers were less likely to support just the white candidate. Again, we should note that Graham had come under criticism from the right wing of the Republican Party in SC. We also discovered that married respondents were less likely to support only the white candidate. One of the most interesting findings is the effect of race on support for only the white candidate. Controlling for a host of factors, white respondents were significantly more likely than non-whites to approve of only the white candidate Lindsey Graham while disapproving of Indian-American Nikki Haley and African-American Tim Scott.Footnote 8 Overall, the results were quite similar for the whites only model. The only difference was that the Tea Party approval variable was statistically significant in the whites only model. Once again we find that Tea Party sympathizers are less approving of Senator Graham, and in this case, specifically when we compare his approval versus approval toward his minority Republican colleagues.
Vote Choice Models
In addition to exploring the approval of minority Republicans, we also wanted to investigate voting for minority Republicans. To do this, we relied on questions from our October Survey asking respondents to indicate whom they would vote for if the election were held today. Admittedly, there could be different underlying factors explaining vote choice and approval. It is possible that someone could approve of a candidate and not vote for him or her. It is also possible that an individual could vote for someone whom they do not approve of. As the well-worn phrase goes, and unlike an accounting of approval, elections are about choices; making explicit comparisons based on the list of candidates who make it onto the ballot. As mentioned in the preceding section, we include many of the same explanatory variables in the vote choice models that we used in our approval models. The models are not identical, however, because the October Survey did not ask the exact same questions as the April and November Surveys. For example, we are not able to include our racial conservatism measure or our ideology question in the vote choice models.Footnote 9
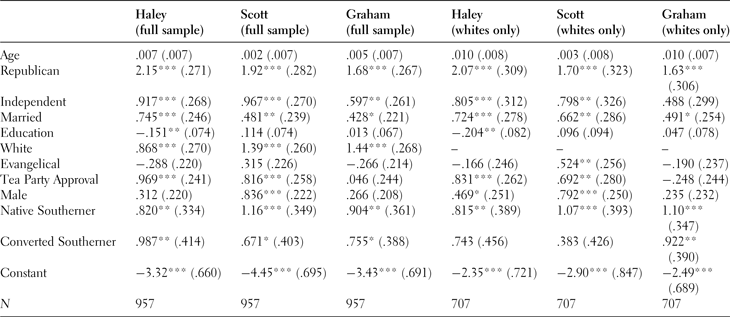
The results of the six models (three for the full sample and three for whites only) appear in Table 3. Starting with the full sample results, as expected, Republicans are significantly more likely to support Haley, Scott, and Graham. Independents are also significantly more likely than Democrats (the comparison category) to vote for the Republican candidates. We expected this for Graham since he made explicit appeals to Independent voters, but we are somewhat surprised that Independents are also more likely to support Haley and Scott. Married respondents are significantly more likely than non-married respondents to support all three candidates as well, a factor that was not particularly important in our approval models.Footnote 10 We also find that whites are more likely to indicate that they would vote for Haley, Scott, and Graham than were non-whites.
Voting for Republicans in SC

Source: Winthrop Poll, October 2014.
Note: Entries are logistic regression coefficients with robust standard errors in parentheses. All models were computed using sampling weights.
*p ≤ .10; **p ≤ .05; ***p ≤ .01 (two-tailed).
Approval of the Tea Party is also a significant predictor of voting for Haley and Scott, just as it is in the approval models for these two candidates. Approval of the Tea Party does not affect support for Graham, however. Males are more likely than females to support Scott but gender does not affect vote choice for either Haley or Graham. In the case of the gubernatorial vote, the absence of a gender gap is a somewhat surprising finding, given that Haley is the state's first female governor. Level of education is negatively correlated with support for Haley. We should also note that Age and whether the respondent self-identified as an Evangelical, are not significant predictors for any of the three candidates. In the case of vote choice, we find both of our regional identity measures are significant predictors in all three models. Self-identification as a southerner, either as a native or convert, positively influences Republican voting; a result that comports with the evidence that new in-migrants to the South are generally more inclined to back Democrats (Hillygus, McKee, and Young Reference Hillygus, McKee and Young2015; Hood and McKee Reference Hood and McKee2010; McKee and Teigen Reference McKee and Teigen2016).
Table 3 also shows the vote choice models for our whites only sample. As expected, the findings are quite similar to what we discovered in the models for the full sample. Republicans are more likely than non-Republicans to support Haley, Scott, and Graham. Independents are also more likely than Democrats to support Haley and Scott. Independents are not any more likely than Democrats to vote for Graham. As was true in the models for the full sample, married respondents are more likely to support each of the three candidates than non-married respondents. Education once again has a negative and significant effect on voting for Haley. We also discovered that evangelicals are significantly more likely to indicate they would vote for Scott than are non-evangelicals. Once again, knowing that a respondent approves of the Tea Party provides some useful information in predicting their vote choice. Tea Party Approval positively influences voting for Haley and Scott but is not significant in our model estimating support for Graham. The coefficients for our regional identity variables are generally positive and significant as well. Native southerners are more likely to vote for Haley, Scott, and Graham, while converted southerners are more likely to vote for Graham.
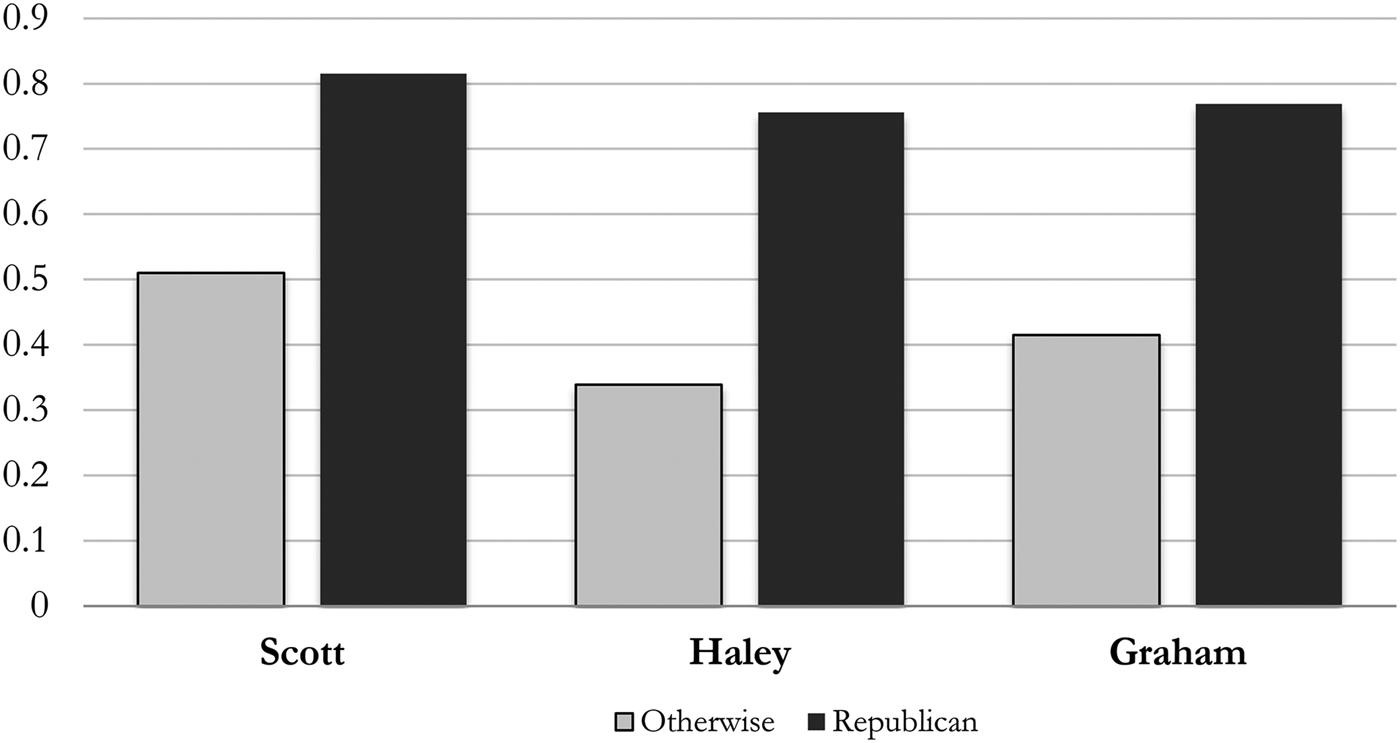
As was the case with our approval models, we also investigated the substantive importance of some of the key predictors in our whites only vote choice models. Figure 4 shows the predicted probabilities of voting for Scott, Haley, and Graham for Republicans versus non-Republican identifiers (Democrats and Independents). As one would expect, there is a substantial increase in the likelihood of voting for each of the candidates if a respondent identifies with the GOP. There is a .51 probability of a non-Republican voting for Scott compared with a .82 probability of a Republican voting for Scott. The increase is even more dramatic for Haley (from a .34 probability to a .76 probability) and Graham (from a .42 probability to a .77 probability). Among white South Carolinians the findings suggest that Scott would win without having to carry any Republican votes, whereas Haley and Graham were heavily reliant upon the support of white Republicans.
Vote Choice for Scott, Haley, and Graham if respondent is a Republican. Note: Predicted probabilities were generated from the models displayed in Table 3 (whites only)

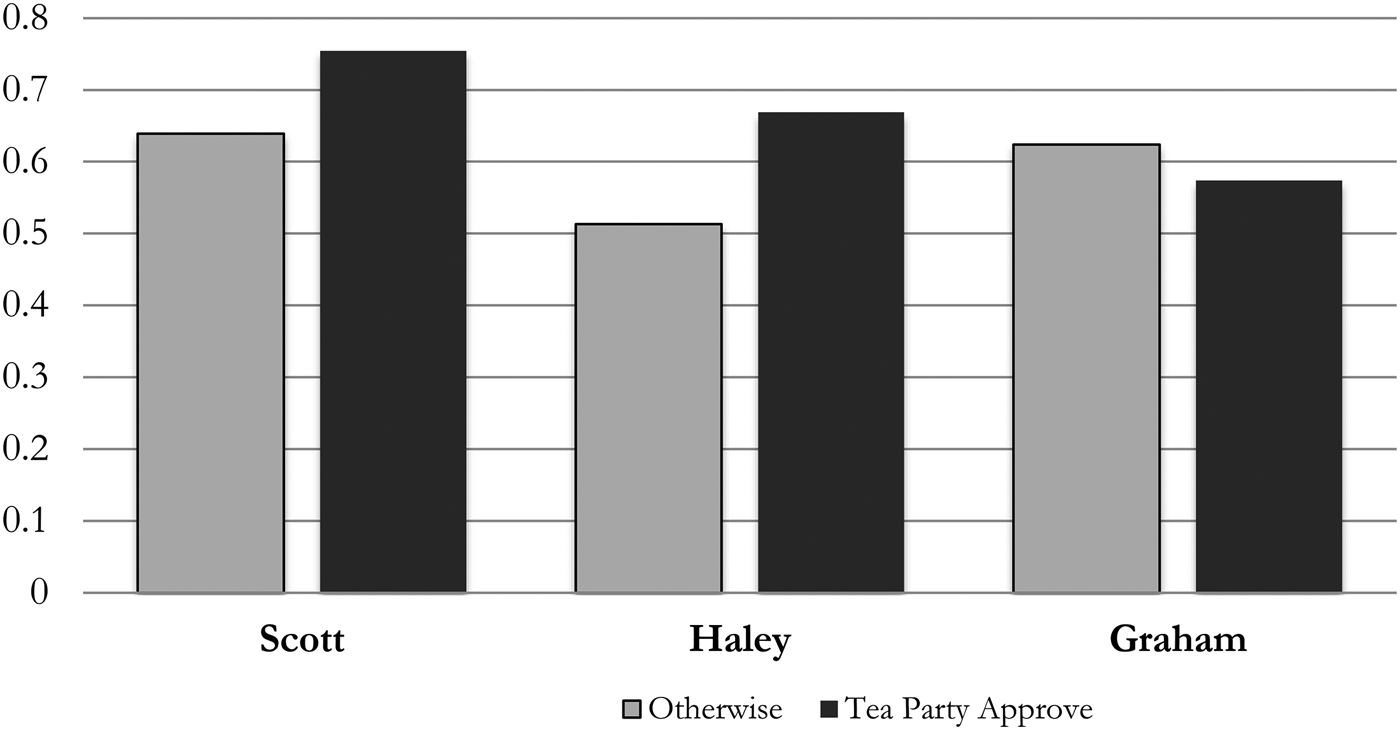
Finally, Figure 5 shows the probability of voting for Scott, Haley, and Graham among whites for two categories of voters, respondents who approve of the Tea Party and those who did not indicate approval of the Tea Party (otherwise). The increase in the vote probability was greatest for Haley—a veritable Tea Party darling, going from .51 to .67. There was also a fairly substantial increase in the probability of voting for Scott, moving from .64 to .75. As we noted above, the opposite occurred for Graham. The probability of voting for Graham for respondents who did not approve of the Tea Party is .62 while the probability for respondents who did approve of the Tea Party is .57, though it is important to note that the Tea Party coefficient was not statistically significant in the Graham vote choice model.
Vote Choice for Scott, Haley, and Graham if respondent approves of Tea Party. Note: Predicted probabilities were generated from the models displayed in Table 3 (whites only)

CONCLUSION
The unique circumstances in the 2014 elections in SC provided an opportunity to reconsider what we know about individuals’ willingness to support minority candidates. Specifically, in this study we are able to gauge support for minority Republicans, a rare species of candidate that has recently become more prominent in contemporary American politics. Based on the results from our study, we can say with confidence that support for minority Republicans is quite strong in the Palmetto State. In what would have been unheard of a few decades earlier, two of the most powerful politicians in SC are not only Republicans, but people of color.
This is particularly noteworthy since SC is a state with a history of racial discrimination only rivaled by the likes of MS and AL (Key Reference Key1949)—where secession first occurred on December 20, 1860 and the first shots of a bloody Civil War were fired by Confederates on the federal garrison at Fort Sumter in Charleston Harbor. Moreover, SC is a state whose most famous politician, Strom Thurmond, still holds the record for the longest Senate filibuster at 24 h and 18 min; a filibuster whose purpose was to block passage of a feeble yet symbolically important civil rights bill (Black and Black Reference Black and Black2002), and a place whose law enforcement committed the 1968 Orangeburg Massacre (Bass and Nelson Reference Bass and Nelson1996). We could go on and on, but the point is that the Palmetto State, for the bulk of its history has been in the vanguard of advancing measures designed to obstruct the political, economic, and social aspirations of its sizable African-American citizenry.
But now, similar to other recent studies (see Hood, Kidd, and Morris Reference Hood, Kidd and Morris2015; Hood and McKee Reference Hood and McKee2015), it no longer appears that a candidate's race weighs as heavily in the voting calculus. Rather, in a period of highly polarized political parties, the most important litmus test seems to be ideological purity. And in the context of our study, compared with minority Republicans Nikki Haley and Tim Scott, white Republican Lindsey Graham is not as popular with the most ideologically extreme element of the Republican Party—those who approve of the Tea Party movement. Hence, we find that among the base of the Republican electorate and even among the broader SC population, two high-profile minority Republicans who are comfortably aligned with the orthodoxy of the GOP, garner more electoral support than a white Republican maverick.Footnote 11
Despite the notable success of these minority Republicans in SC, we found some evidence that racial considerations may still be a factor. In particular, we discovered that whites were significantly more likely to approve of Graham while at the same time disapproving of Haley and Scott. But even in this analysis, it is important to point out that this behavior did not come from those affiliated with the Republican Party. In fact, Republican identifiers (all Republicans and just white Republicans) were significantly less likely to constitute the segment of respondents who approved of Graham while disapproving of Haley and Scott (see Table 2).
Overall, the predictors of both approval and vote choice for the minority Republican candidates look very similar to the predictors of approval and vote choice for a white Republican. Indeed, our analyses suggest that conservative whites in SC have embraced an Indian-American Governor and an African-American U.S. Senator. But it is also clear that in this case, minority Republicans who adhere to the guiding principles and philosophy of the more ideologically conservative party, have hardly any crossover appeal among minority voters who overwhelmingly identify with the Democratic opposition. Thus far, the racial profiles of Haley and Scott have proven incapable of garnering much support from SC's substantial black electorateFootnote 12 , who, most likely react negatively to their conservative brand of politics. At minimum, the findings in this study suggest that opinions toward minority Republicans differ from those typically expressed in studies of minority Democrats. And perhaps more ambitiously, the opinions of the residents in a conservative Deep South state signal a new era in U.S. politics, one in which the race of a candidate pales in importance to party and ideology.
Acknowledgements
An early version of this article was titled, “Minority Republicans in the Palmetto State,” which we presented at the 2015 annual meeting of the Southern Political Science Association, in New Orleans, Louisiana. We appreciate the comments from our discussant Bruce Anderson. We also thank Allie Briggs, the Social & Behavioral Research Lab (SBRL) Operations Manager, and Winthrop University and The West Forum on Politics and Policy for their financial support.
APPENDIX
VARIABLE CODING/RECODING FOR MULTIVARIATE ANALYSES
Approval Models
Dependent Variables:
-
– Approve of [Haley, Scott, Graham]: 1 = Approve; 0 = Disapprove;
-
– Approve of only the white candidate [Graham] but disapprove of the minority candidates [Haley and Scott]: 1 = Approve; 0 = All other permutations;
-
– Approve of only the minority candidates [Haley and Scott] but disapprove of the white candidate [Graham]: 1 = Approve; 0 = All other permutations.
Independent variables:
-
– Age: 18 to oldest;
-
– Republican: 1 = Strong or Weak Identifier; 0 = otherwise;
-
– Independent: 1 = Leans Republican, Leans Democrat, Pure; 0 = otherwise;
-
– Married: 1 = Married; 0 = otherwise;
-
– Education: 1 = Less than High School; 2 = High School graduate/GED; 3 = Some college; 4 = Two-year tech college graduate; 5 = Four-year college graduate; 6 = Post Graduate;
-
– White: 1 = White (non-Hispanic); 0 = otherwise;
-
– Evangelical: 1 = Born again or Evangelical Christian; 0 = otherwise;
-
– Tea Party Approval: 1 = Approve; 0 = otherwise;
-
– Ideology: 1 = Very Liberal; 2 = Somewhat Liberal; 3 = Moderate—Leans Liberal; 4 = Moderate—Does NOT Lean toward EITHER [“Refused/Don't Know” are recoded as a 4]; 5 = Moderate—Leans Conservative; 6 = Somewhat Conservative; 7 = Very Conservative;
-
– Male: 1 = Male; 0 = Female;
-
– Racial Conservatism: “Do you feel that generations of slavery and discrimination do or do not make it difficult for blacks to work their way out of the lower class?” 1 = Strongly DO make it difficult; 2 = Somewhat DO make it difficult; 3 = Neutral [“Not Sure/Don't Know” comprise a 3]; 4 = Somewhat do NOT make it difficult; 5 = Strongly do NOT make it difficult;
-
– Native Southerner: 1 = Native Southerner; 0 = otherwise;
-
– Converted Southerner: 1 = Converted Southerner; 0 = otherwise;
-
– Fall Poll: 1 = November General Population Poll; 0 = April General Population Poll.
Vote Choice Models
Dependent Variable:
-
– Vote Choice: 1 = Haley, 0 = otherwise; 1 = Scott, 0 = otherwise; 1 = Graham, 0 = otherwise.
Independent Variables:
-
– Same variables used in the Approval Models except that ideology and racial conservatism are not included.