




1 Introduction
High-brightness picosecond green lasers are important for precision processing, advanced manufacturing and emerging optoelectronic applications because their short pulse duration and high peak power enable high-precision material processing[ Reference Sugioka and Cheng 1 , Reference Phillips, Gandhi, Mazur and Sundaram 2 ]. These applications require not only high output brightness but also stable laser performance under external perturbations, such as ambient temperature drift[ Reference Ma, Yao, Zhang, Liang, Jia, Huang, Nie, Yao and Zhang 3 , Reference Tang, Wang, Zhou, Xie, Ma, Yuan, Zhu and Qian 4 ]. At present, nonlinear frequency conversion is the most direct and widely used route for generating high-brightness picosecond green output[ Reference Ramazza, Ducci, Zavatta, Bellini and Arecchi 5 – Reference Ma, Chen, Yang, Lu, Zhang and Du 7 ]. Among available nonlinear crystals, lithium triborate (LBO) has become a preferred material for second-harmonic generation (SHG) in this spectral region owing to its high optical damage threshold and favorable thermomechanical properties[ Reference Qi, Yu, Zhang, Zhang, He and Lin 6 – Reference Riedel, Rothhardt, Beil, Gronloh, Klenke, Höppner, Schulz, Teubner, Kränkel, Limpert, Tünnermann, Prandolini and Tavella 9 ]. However, in long-crystal and high-power picosecond SHG, the effective temperature acceptance of LBO remains limited, making the frequency-conversion process sensitive to temperature deviations. Therefore, achieving both high-brightness output and a broad operating temperature range in LBO-based picosecond SHG remains an important issue[ Reference Aliasger, Novák, Hubka, Hanuš, Navrátil, Severová, Denk, Pilař, Paliesek, Divoký, Schreiber, Jelínek, Smrž and Mocek 10 , Reference Rozenberg and Arie 11 ].
To address this challenge, previous studies have proposed adiabatic phase-mismatch trajectory methods, in which a smooth and slowly varying longitudinal phase-mismatch distribution is constructed along the crystal propagation direction. By allowing the phase mismatch to gradually sweep through the zero-mismatch point, these methods regulate the nonlinear energy-coupling process and achieve a favorable balance between conversion efficiency and temperature tolerance[ Reference Rozenberg and Arie 11 – Reference Markov, Mazhorova, Breitenborn, Bruhacs, Clerici, Modotto, Jedrkiewicz, Di Trapani, Major, Vidal and Morandotti 15 ]. In birefringently phase-matched crystals such as LBO, such adiabatic trajectories can be implemented by introducing a longitudinal temperature gradient[ Reference Rozenberg and Arie 11 , Reference Porat and Arie 13 , Reference Regelskis, Želudevičius, Gavrilin and Račiukaitis 16 ]. Conventional adiabatic trajectory designs emphasize a slow scan of the phase mismatch around the zero-mismatch region. For example, smooth and monotonic low-order curves are used to extend the strong-coupling region, thereby maintaining sufficient energy exchange between the fundamental and second-harmonic waves. This design strategy is beneficial for improving SHG conversion efficiency. However, its trajectory configuration is mainly centered on the energy-conversion process and does not sufficiently account for the effects of transverse nonuniform conversion, thermally induced phase mismatch and spatial walk-off on the output beam quality in high-power picosecond SHG. Therefore, a conventional efficiency-oriented adiabatic trajectory does not necessarily lead to the highest brightness output, and adiabatic phase-mismatch trajectory design for high-brightness picosecond green generation remains to be further developed. On the other hand, the temperature bandwidth is defined mainly in terms of conversion efficiency[ Reference Markov, Mazhorova, Breitenborn, Bruhacs, Clerici, Modotto, Jedrkiewicz, Di Trapani, Major, Vidal and Morandotti 15 ], without adequately considering beam quality degradation induced by temperature perturbations. For picosecond SHG systems aimed at high-brightness output, defining the bandwidth solely by efficiency has clear limitations, because the practical usability of the system is jointly constrained by output power and beam quality.
Based on this consideration, we treat the longitudinal phase-mismatch trajectory as a key design degree of freedom and develop a trajectory design and performance-evaluation method for high-brightness picosecond SHG in LBO. Unlike conventional adiabatic trajectory designs that mainly optimize conversion efficiency and efficiency-defined temperature bandwidth, the proposed approach considers both SHG output power and output beam quality. These two quantities are combined through the brightness factor, which is used for trajectory screening and performance comparison. The brightness-oriented adiabatic trajectory is then mapped into an experimentally feasible longitudinal temperature distribution. Through numerical simulations and experimental measurements, we compare the conversion efficiency, beam quality and brightness temperature bandwidth obtained with different trajectories. This work provides a feasible design strategy and evaluation method for the coordinated optimization of high-brightness output and wide-temperature-range operation in LBO-based picosecond green generation.
2 Theoretical model and numerical simulation
This study considers picosecond SHG in LBO crystal. Under the slowly varying envelope approximation, the spatial evolution of the fundamental and second-harmonic fields can be described by coupled-wave equations[ Reference Boyd 17 , Reference Boyd and Kleinman 18 ], in which the longitudinal phase mismatch is defined as follows:

Considering that this work focuses on the influence of trajectory design on the output performance of picosecond SHG systems, the numerical model incorporates nonlinear energy coupling, thermally induced phase mismatch and the correspondence with experimental parameters. Since the fundamental source used in the experiment has high beam quality, the input fundamental beam is approximated as a near-Gaussian field in the simulation. The crystal length, operating temperature, cutting angle and temperature-dependent refractive indices are all set according to the experimental conditions and the reported LBO dispersion relations[
Reference Kato
19
, Reference Kato, Grechin and Umemura
20
]. All subsequent trajectory designs, parameter scans and performance comparisons are then carried out with respect to the longitudinal phase-mismatch trajectory
$\Delta {k}(z)$
 .
For high-brightness green output, conversion efficiency alone is insufficient to describe the system performance, because the practically usable output depends on both the SHG power and the output beam quality[ Reference Siegman 21 ]. In the experimental and numerical comparisons presented here, the fundamental power is kept unchanged. Therefore, the brightness-related evaluation quantity can be defined as follows:

where η denotes the second-harmonic conversion efficiency and
${M}^2$
 ,
${M}_y^2$
 represent the beam quality factors. Here, η is expressed in percent when calculating the brightness factor. Since the output wavelength is fixed and the focusing condition is kept unchanged in the experiment, the following simplified expression is used as the normalized brightness factor to directly evaluate the relative performance of the system under temperature detuning:

Based on this metric, the brightness temperature bandwidth is further defined as the full width at half maximum of the normalized brightness factor
${\tilde{B}}_\mathrm{rel}(T)$
 as a function of the overall temperature offset, namely the temperature range over which the following condition is satisfied:

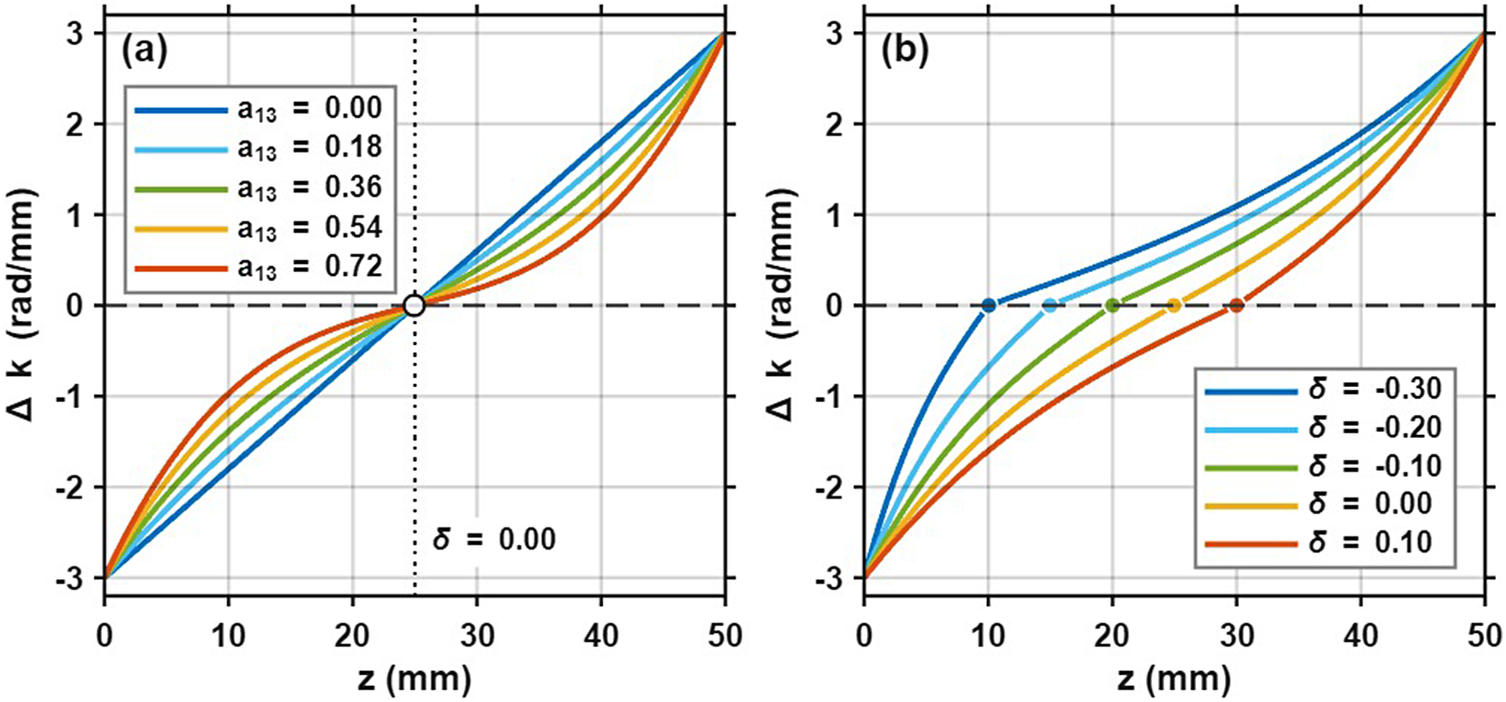
Ideal longitudinal phase-mismatch trajectories. (a) Effect of the cubic-term weight
${a}_{13}$
 . (b) Effect of the axial offset δ.

Figure 1 Long description
Two line graphs, labeled a and b, share identical axes. The horizontal x-axis represents z in millimeters, ranging from 0 to 50. The vertical y-axis represents Delta k in radians per millimeter, ranging from minus 3 to 3. Both graphs show a series of curves originating at (0, minus 3) and ending at (50, 3).
Panel a shows the effect of the cubic-term weight a sub 1 3. All curves intersect at a single central point (25, 0), marked by a white circle on a vertical dotted line where delta equals 0.00. As a sub 1 3 increases from 0.00 (dark blue) to 0.72 (red), the curves transition from a linear slope to an increasingly pronounced S-shaped cubic trajectory.
Panel b shows the effect of the axial offset delta. The curves are shifted horizontally along the y equals 0 dashed line. Each curve has a colored dot indicating its zero-crossing point. As delta increases from minus 0.30 (dark blue) to 0.10 (red), the zero-crossing point moves rightward along the z-axis from z equals 10 to z equals 30. The curves maintain a similar cubic shape but are translated spatially.
The corresponding temperature range is denoted as the brightness temperature bandwidth of the system. Compared with the conventional efficiency-retention bandwidth, this definition simultaneously reflects the joint limitations imposed by output capability and beam quality degradation on the operating range of the system. Therefore, it is more suitable for evaluating the practical usability of high-brightness picosecond green-laser systems under temperature perturbations.
For high-power picosecond SHG in LBO, the longitudinal phase-mismatch trajectory determines not only the energy-transfer efficiency from the fundamental wave to the second-harmonic wave but also the output beam quality. Conventional adiabatic trajectories improve SHG conversion efficiency by reducing the phase-mismatch variation rate near the zero-mismatch point and extending the effective interaction length within the strong-coupling region. However, under Gaussian-beam incidence and high-power operation, an excessively strong or prolonged nonlinear coupling process can enhance transverse nonuniform conversion, causing the central and edge regions of the beam to experience different SHG gains and phase accumulation. Meanwhile, thermally induced phase mismatch, spatial walk-off and transverse amplitude and phase distortions caused by nonuniform conversion can accumulate along the crystal length, eventually degrading the output beam quality. Therefore, the adiabatic trajectory with the highest efficiency does not necessarily correspond to the highest brightness output. Here, conversion efficiency is no longer used as the sole optimization objective. Instead, we propose a brightness-oriented adiabatic phase-mismatch trajectory design method. This method uses a low-order parameterized trajectory composed of linear and cubic terms, and introduces two degrees of freedom: the nonlinear weight and the axial offset. The nonlinear weight is used to regulate the growth behavior of energy exchange and the distribution of coupling strength near the zero-mismatch region, whereas the axial offset changes the zero-mismatch crossing position, thereby controlling the relative relationship between the main energy-exchange region and the subsequent propagation region. Through these two degrees of freedom, trajectory design is shifted from simply pursuing energy-conversion efficiency to the coordinated control of the longitudinal generation process of the second-harmonic wave and the accumulation pathway of spatial distortions.
Based on this concept, an ideal longitudinal phase-mismatch trajectory is described by a low-order function composed of linear and cubic terms, with the phase-mismatch amplitudes at both ends fixed. This form preserves the basic feature of an adiabatic trajectory, namely monotonic crossing of the zero-mismatch point, while allowing the variation rate of the trajectory in different longitudinal regions to be adjusted with a limited number of parameters. As shown in Figure 1, the cubic-term weight
${a}_{13}$
 mainly modifies the slow-varying behavior near the zero-mismatch region and the recovery rate of phase mismatch toward both ends, thereby affecting the energy-exchange process in the strong-coupling region. The axial offset δ changes the position of the zero-mismatch crossing point, causing the main energy-exchange region to shift forward or backward along the crystal length. In this way, trajectory-shape control is transformed into a joint optimization problem involving the energy-exchange strength and the main conversion position, providing the basis for subsequent brightness-oriented parameter screening.
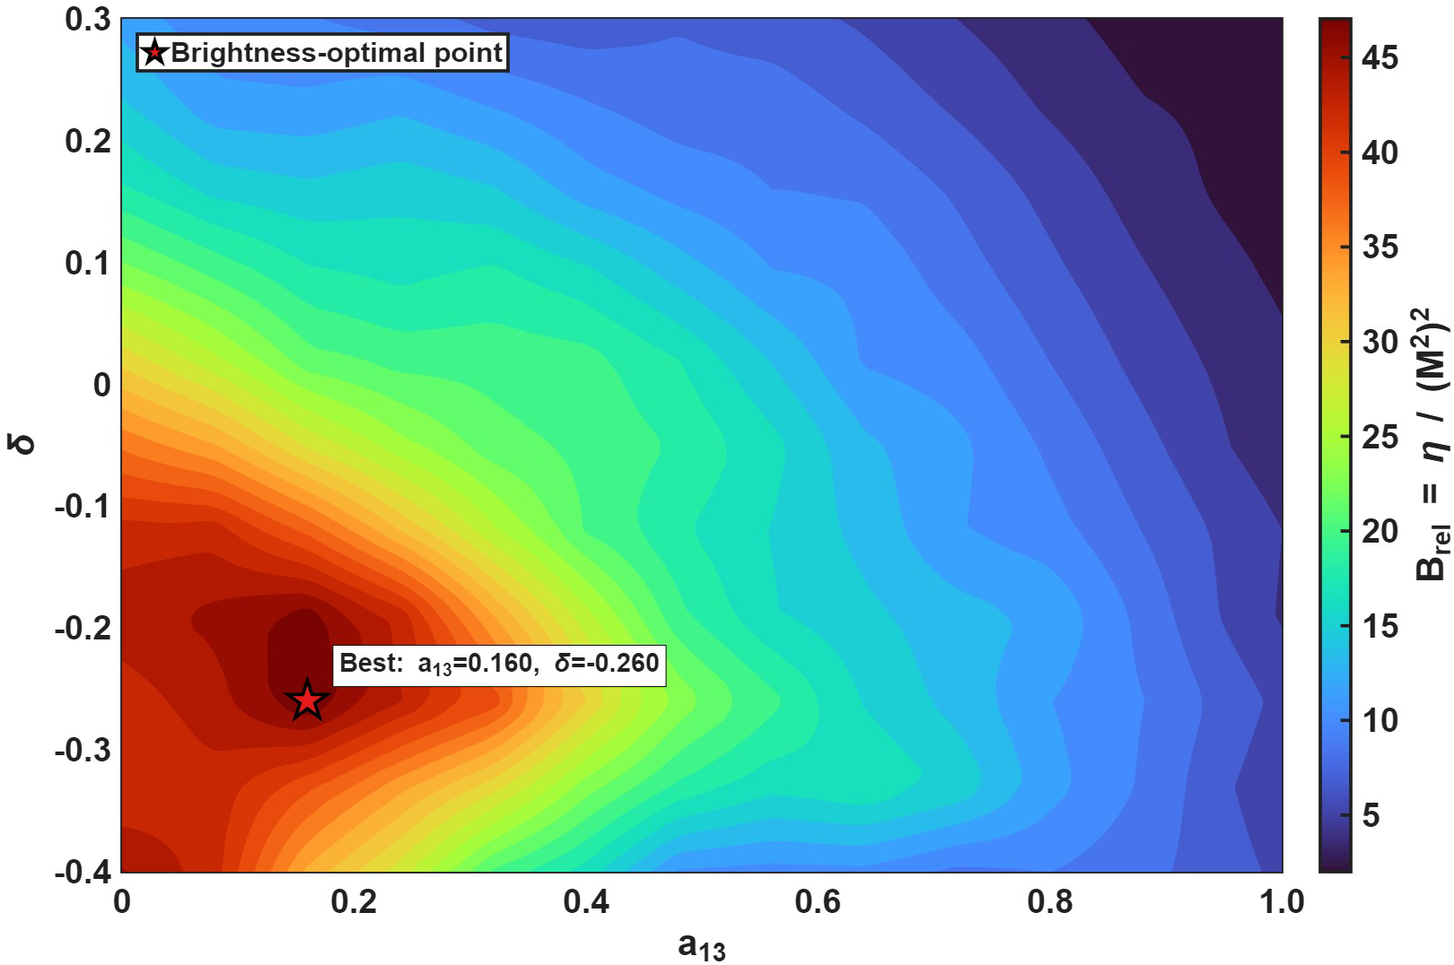
Within the above parameterized framework, different trajectories lead to different trade-offs between higher conversion efficiency and better beam quality by changing the zero-mismatch crossing position, the length of the main energy-exchange region and the coupling strength in the later part of the crystal. The numerical results show that, as the cubic-term weight increases, the trajectory becomes more gradual in the central region, leading to higher conversion efficiency but degraded second-harmonic beam quality. As the axial offset shifts toward more negative values, the zero-mismatch crossing point gradually moves toward the input end of the crystal, and the main energy-exchange region shifts forward accordingly. This weakens the sustained strong-coupling process in the later part of the crystal, thereby reducing the accumulation of distortions induced by thermally induced phase mismatch, spatial walk-off and transverse nonuniform conversion. Consequently, the output beam quality can be improved. These results indicate that the relevant parameters do not monotonically optimize all performance metrics simultaneously, but instead form a clear Pareto front between conversion efficiency and beam quality. By further incorporating the distribution of the brightness factor, this two-metric trade-off can be transformed into the identification of a high-brightness candidate region. As shown in Figure 2, the parameter region with a moderate nonlinear weight and a slight negative offset is selected as the high-brightness candidate region for further investigation. A target trajectory with
${a}_{13}=0.16$
 and
$\delta =-0.26$
 is then chosen for experimental verification. For comparison, another representative adiabatic trajectory with
${a}_{13}=1$
 and
$\delta = 0$
 is selected as the reference case.
Parameter screening based on conversion efficiency, beam quality and brightness factor.

Figure 2 Long description
A two-dimensional contour plot where the horizontal X-axis represents parameter a sub 1 3 ranging from 0 to 1.0 and the vertical Y-axis represents delta ranging from -0.4 to 0.3. A color scale on the right indicates the relative brightness B sub rel, defined as eta all over (M squared) squared, with values from 5 (dark blue) to over 45 (dark red).
Data trends:
* The highest intensity region (dark red) is concentrated in the lower-left quadrant.
* Values decrease asymmetrically as a sub 1 3 increases toward 1.0 and delta increases toward 0.3, transitioning through orange, yellow, green, and light blue.
* The lowest values (dark blue) are located in the top-right corner.
Key markers:
* A red star with a black outline is positioned at the peak intensity hotspot. A label next to it reads: Best: a sub 1 3 = 0.160, delta = -0.260.
* The legend in the upper-left corner indicates that the star symbol denotes the brightness-optimal point.
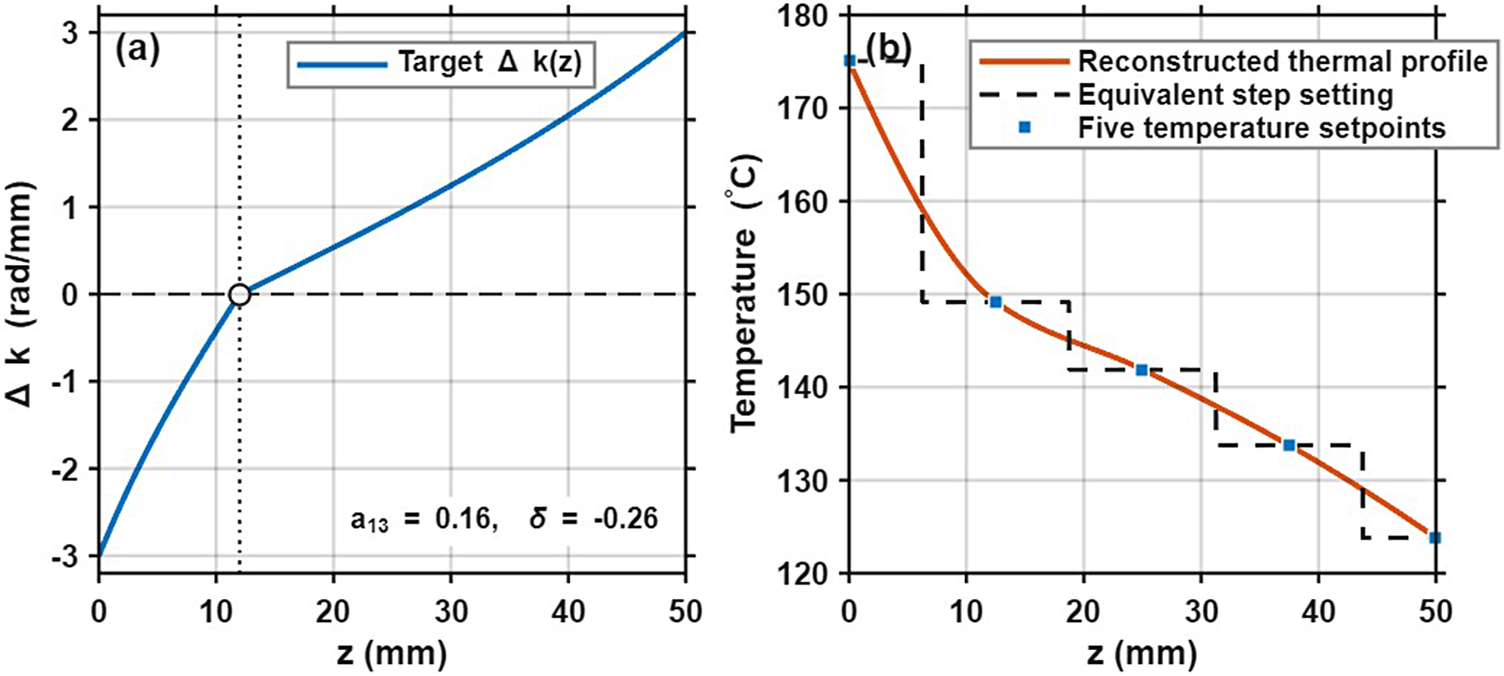
Mapping from the phase-mismatch trajectory to the longitudinal temperature profile. (a) Target trajectory. (b) Temperature setpoints and reconstructed temperature profile.

Figure 3 Long description
Panel a. A line graph with x-axis z in m m from 0 to 50 and y-axis Delta k in rad forward slash m m from minus 3 to 3. A blue curve labeled Target Delta k of z starts at z equals 0, Delta k equals minus 3. It curves upward, crossing Delta k equals 0 at approximately z equals 12, marked by an open circle at the intersection of a vertical dotted line and a horizontal dashed line. From this point, the curve continues as a linear increase to z equals 50, Delta k equals 3. Text in the bottom right quadrant reads a sub 1 3 equals 0.16, delta equals minus 0.26.
Panel b. A line graph with x-axis z in m m from 0 to 50 and y-axis Temperature in degrees Celsius from 120 to 180. Three data series are shown. First, Five temperature setpoints are represented by blue squares at z equals 0, 12, 25, 38, and 50. Second, an Equivalent step setting is shown as a black dashed line forming a descending staircase pattern. Third, a Reconstructed thermal profile is shown as a solid orange curve that smoothly interpolates through the five blue setpoints, starting at 175 degrees Celsius at z equals 0 and ending at approximately 124 degrees Celsius at z equals 50.
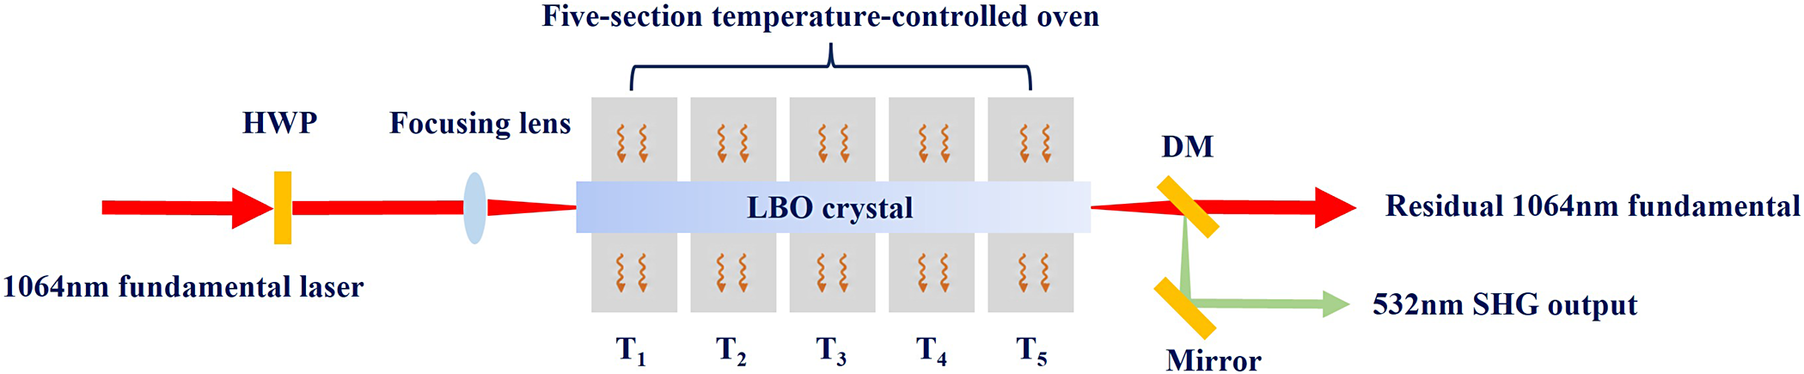
Experimental setup for picosecond second-harmonic generation in the five-section temperature-controlled LBO crystal.

The optimized trajectory obtained from the parameter scan is still an idealized longitudinal phase-mismatch distribution. In the experiment, this trajectory must be implemented using a temperature-control structure with a finite number of heating sections. A 50-mm-long LBO crystal is used and placed in a five-section independently controlled oven. The five heating units are arranged along the light propagation direction. Therefore, the directly controllable quantities in the experiment are not the continuous
$\varDelta k(z)$
 , but rather the five segmented temperature setpoints. Before experimental verification, the candidate trajectory must therefore be further mapped into an experimentally feasible longitudinal temperature distribution. Specifically, the target
$\varDelta k(z)$
 is first converted into a continuous temperature distribution
$T(z)$
 according to the phase-matching relation. Then, considering the positions of the five temperature-control setpoints and the heat-conduction characteristics of the oven, this continuous temperature distribution is equivalently represented by five temperature setpoints, resulting in a longitudinal temperature distribution that can be implemented experimentally. The mapping from the target phase-mismatch trajectory to the corresponding longitudinal temperature profile is shown in Figure 3.
3 Experimental setup and results
To verify the output characteristics of the brightness-oriented adiabatic trajectory in a practical system, a 50-mm-long LBO crystal was used as the SHG crystal and placed in a five-section independently controlled oven. The experimental setup for SHG is shown in Figure 4. The five heating units were arranged sequentially along the light propagation direction. The temperature setpoint of each section was determined according to the trajectory-mapping results described above to construct the target longitudinal temperature distribution and realize longitudinal phase-mismatch control. Although the five temperature-control units have independently adjustable setpoints T 1–T 5, their thermal effects on the crystal are coupled because of longitudinal heat conduction in the oven and the LBO crystal. Therefore, the resulting longitudinal temperature distribution is continuous and is jointly determined by the five temperature setpoints. Different combinations of T 1–T 5 reconstruct different longitudinal temperature profiles and thus implement different longitudinal phase-mismatch trajectories.
The pulse repetition rate was recorded using a digital oscilloscope (Tektronix DPO70804C). The optical spectrum of the second-harmonic output was measured using a Fourier-transform optical spectrum analyzer (Thorlabs Redstone OSA302; wavelength range: 250 nm–2.5 μm; spectral resolution: 1.9 GHz; spectral accuracy: ±0.2 parts per million). The pulse duration was measured using an autocorrelator (APE PulseCheck SM2000). The average power was measured using an Ophir Nova II power meter equipped with a calibrated thermal power sensor. The beam quality factors were measured using a BeamSquared beam quality analyzer (BSQ-SP920).
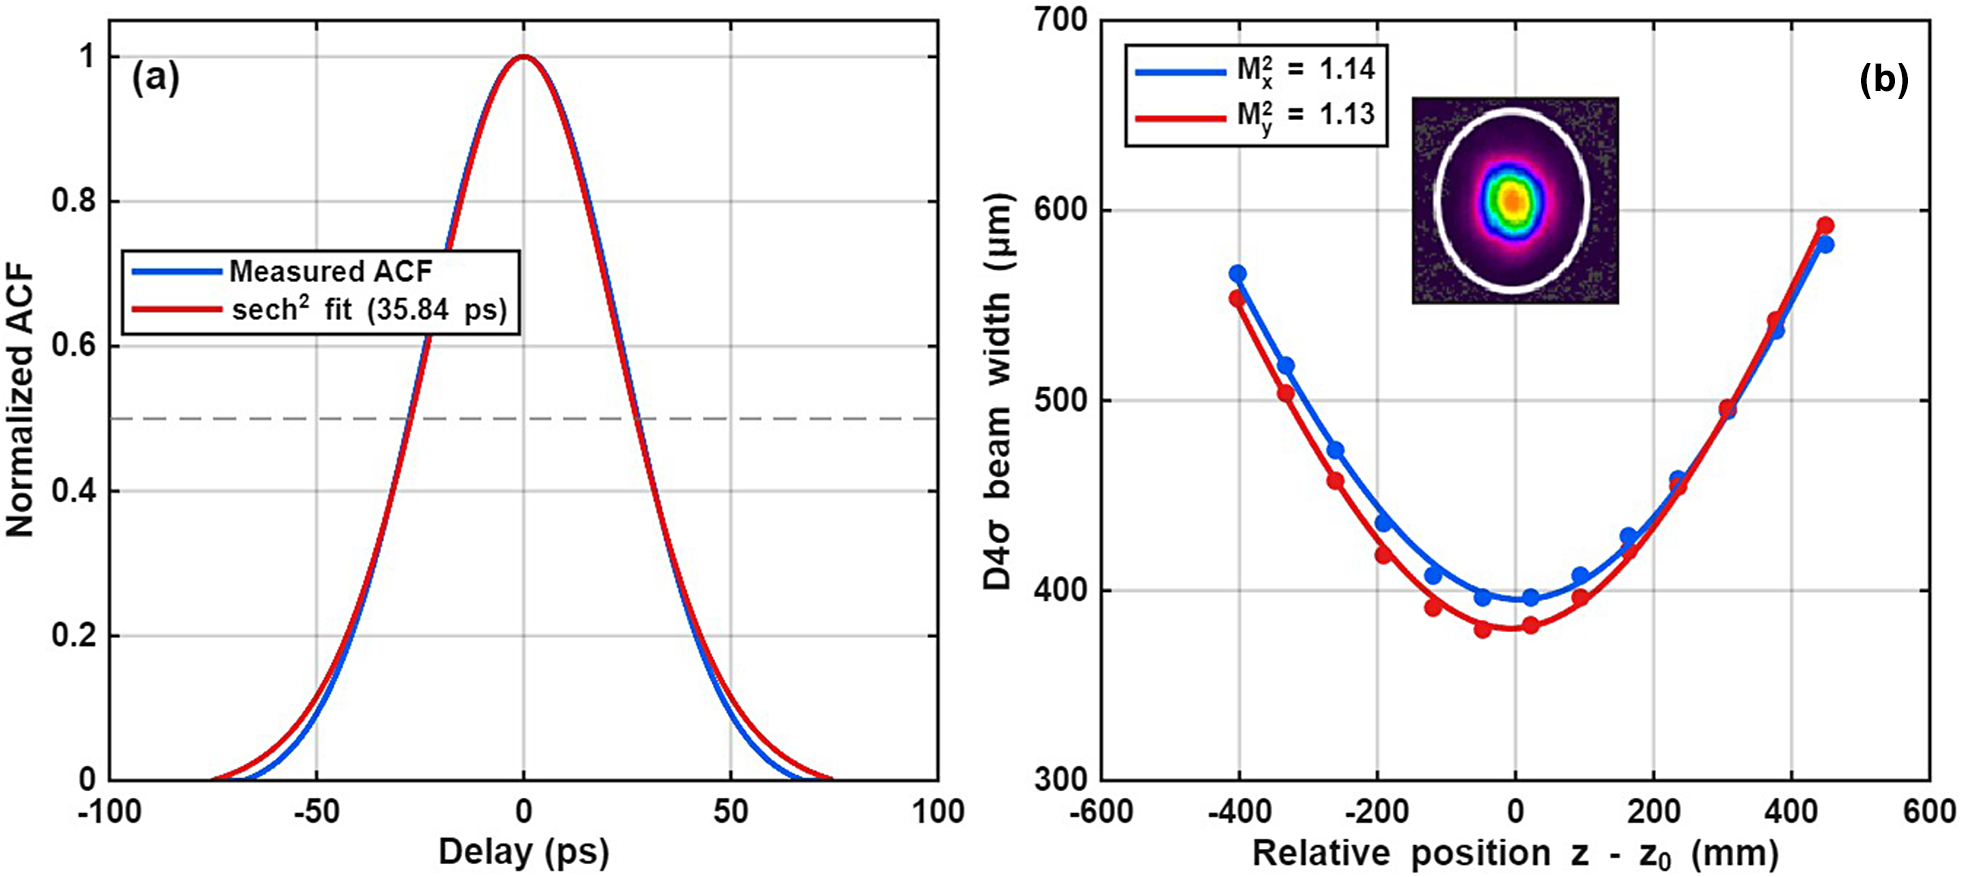
The temporal and spatial characteristics are shown in Figure 5. The fundamental source used in the experiment was a high-beam-quality picosecond laser. Its central wavelength, pulse duration, repetition rate and maximum output power were 1064.573 nm, 35.84 ps, 2.01 MHz and 128 W, respectively, with a corresponding beam quality factor of
${M}^2=1.14$
 . In the experiment, the fundamental beam was focused into the LBO crystal by a convex lens, with the focal position located near the center of the crystal and a beam waist radius of approximately 0.4 mm. The comparisons among different trajectory schemes were performed under the same input power, focusing condition and polarization configuration, ensuring that the experimental differences mainly originated from the longitudinal phase-mismatch trajectories.
Input fundamental laser characterization. (a) Measured autocorrelation trace with sech2-pulse fitting. (b) Beam quality measurement of the fundamental beam. The inset shows the measured beam profile.

Figure 5 Long description
Panel a is a line graph titled a. The x-axis is Delay in p s ranging from minus 100 to 100. The y-axis is Normalized A C F ranging from 0 to 1. A bell-shaped curve peaks at 0 delay with a value of 1. A blue line represents the Measured A C F and a red line represents the sech super 2 fit 35.84 p s. A horizontal dashed gray line marks the 0.5 level.
Panel b is a line graph titled b. The x-axis is Relative position z minus z sub 0 in m m ranging from minus 600 to 600. The y-axis is D 4 sigma beam width in micrometers ranging from 300 to 700. Two parabolic data series are shown. The blue series has a legend entry M super 2 sub x equals 1.14 and the red series has a legend entry M super 2 sub y equals 1.13. Both curves reach a minimum width near 0 relative position. An inset image at the top shows a circular heat map of the beam profile with a bright yellow and red core surrounded by green, blue, and purple outer rings.
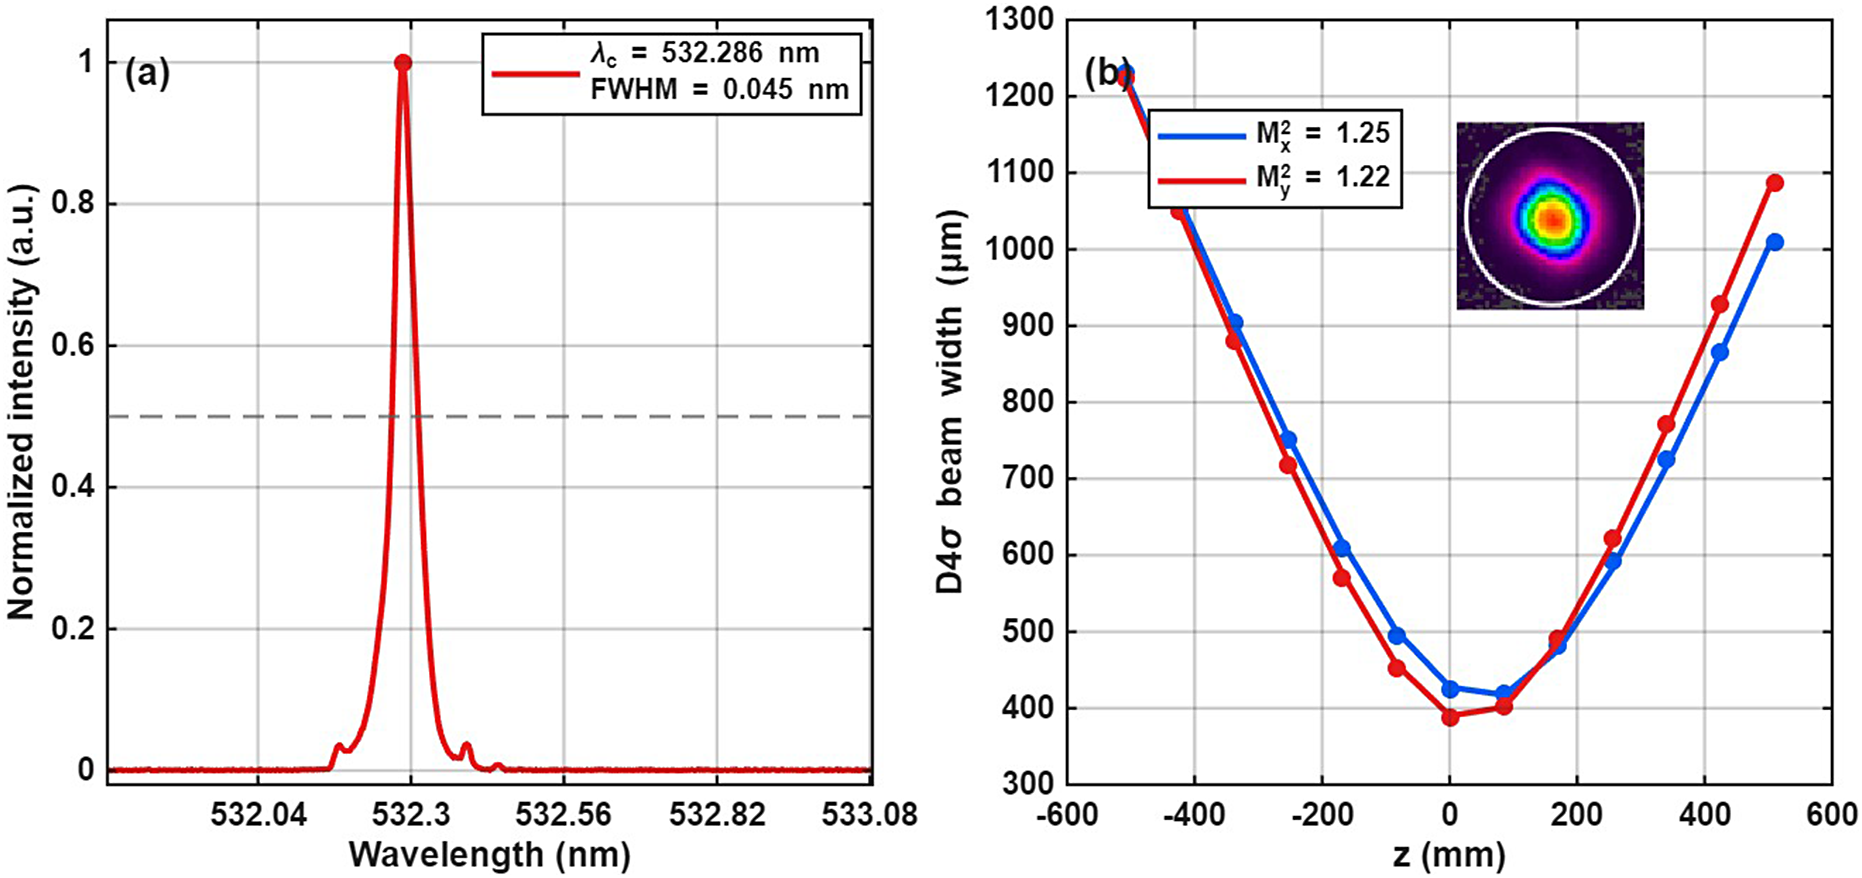
Output characteristics of the brightness-oriented adiabatic trajectory. (a) Green-laser spectrum. (b) Beam quality measurement.

Figure 6 Long description
Panel a is a line graph of Normalized intensity in a. u. versus Wavelength in n m. The x-axis ranges from 532.04 to 533.08. A sharp red peak is centered at lambda sub c equals 532.286 n m with a F W H M of 0.045 n m. A horizontal dashed grey line marks the 0.5 intensity level.
Panel b is a line graph of D 4 sigma beam width in micrometers versus z in m m. The x-axis ranges from minus 600 to 600. Two parabolic curves, one blue and one red, show beam width decreasing to a minimum near z equals 0 and then increasing. The blue line represents M super 2 sub x equals 1.25 and the red line represents M super 2 sub y equals 1.22. An inset in the top right shows a circular heat map of the beam profile with a rainbow color gradient from a blue perimeter to a red and yellow core.
In the experiment, the SHG conversion efficiency was calculated by measuring the average power of the second-harmonic output, and the beam quality factor
${M}^2$
 of the generated green beam was further measured. Based on these results, together with the brightness factor defined in Section 2, the output performance of the system under different longitudinal phase-mismatch trajectories was compared. Here, the conversion efficiency reflects the nonlinear energy-coupling strength, whereas the beam quality factor represents the spatial quality of the output beam. Together, these two quantities determine the output performance of a high-brightness picosecond green-laser system. The output characteristics of the brightness-oriented adiabatic trajectory are shown in Figure 6. The spectrum in Figure 6(a) was measured at the optimum operating point of this trajectory. During the measurement, the incident fundamental average power was 128 W, and the five-section oven was operated using the corresponding mapped temperature setting with zero overall temperature offset. Under this condition, the generated green laser had a central wavelength of 532.286 nm, a spectral full width at half maximum of approximately 0.045 nm and an average power of 79.87 W, corresponding to a light-to-light conversion efficiency of 62.4%. The corresponding beam quality factor was M
2 = 1.24, indicating that this trajectory maintained good spatial quality while producing stable green output.
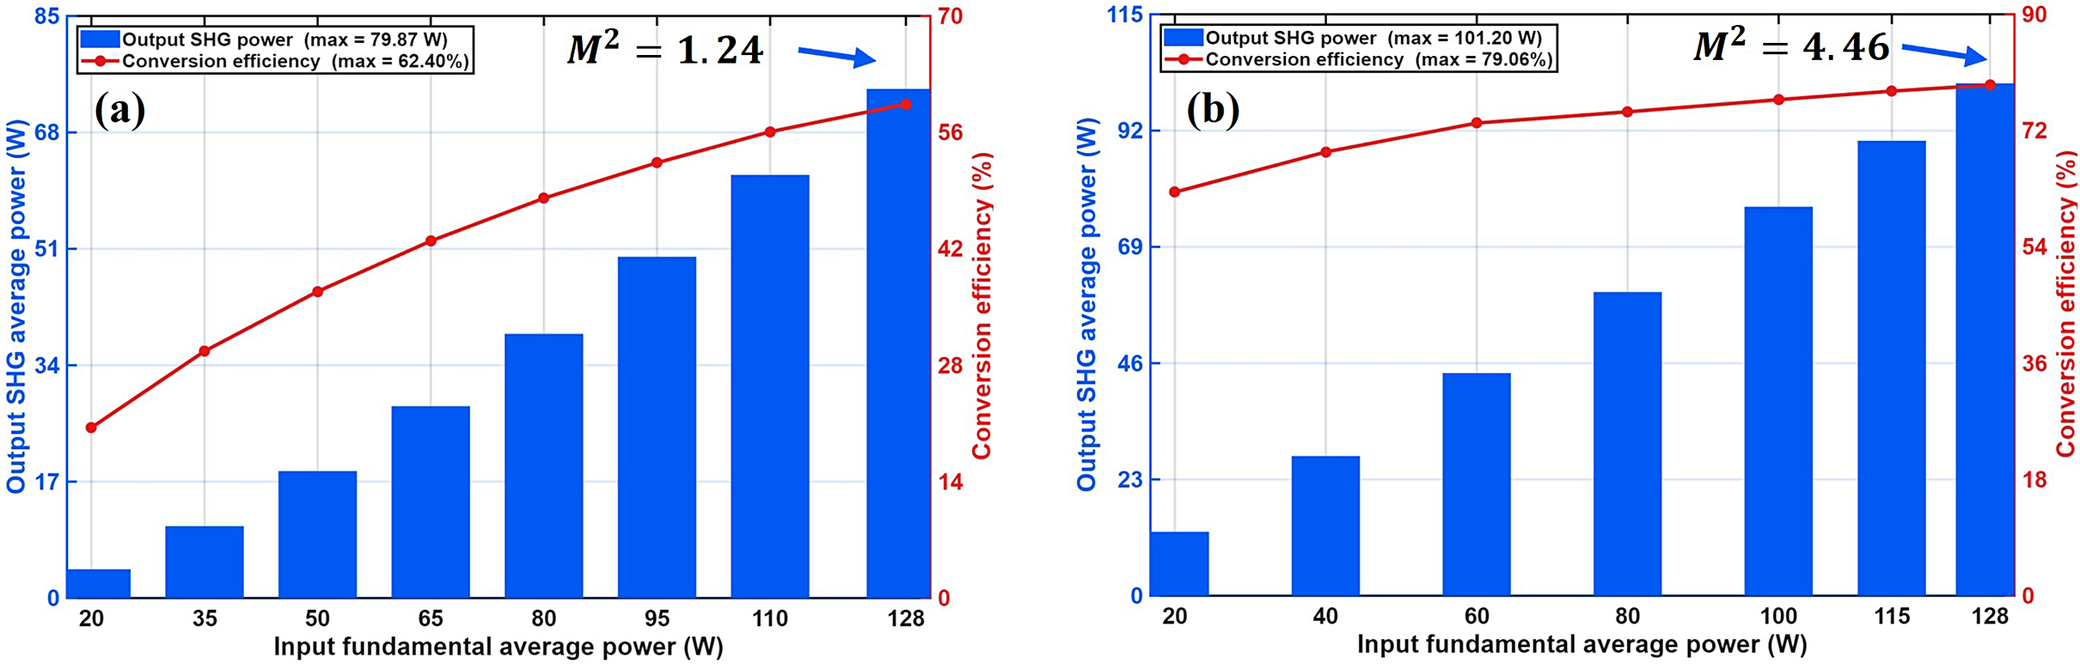
Power-scaling performance of different adiabatic trajectories. (a) Brightness-oriented adiabatic trajectory. (b) Conventional adiabatic trajectory.

Figure 7 Long description
Panel a, labeled brightness-oriented adiabatic trajectory, features a horizontal x-axis for Input fundamental average power in Watts ranging from 20 to 128. The left y-axis shows Output S H G average power in Watts from 0 to 85, and the right y-axis shows Conversion efficiency in percent from 0 to 70. Blue bars representing Output S H G power show a non-linear increase, reaching a maximum of 79.87 Watts. A red line with circular markers representing Conversion efficiency shows a logarithmic growth curve, reaching a maximum of 62.40 percent. An annotation at the top right indicates M super 2 equals 1.24 with an arrow pointing to the final data point.
Panel b, labeled conventional adiabatic trajectory, uses the same axes. The left y-axis ranges from 0 to 115 and the right y-axis from 0 to 90. Blue bars show Output S H G power increasing to a maximum of 101.20 Watts. The red line for Conversion efficiency shows a steeper initial rise and levels off at a maximum of 79.06 percent. An annotation at the top right indicates M super 2 equals 4.46 with an arrow pointing to the final data point.
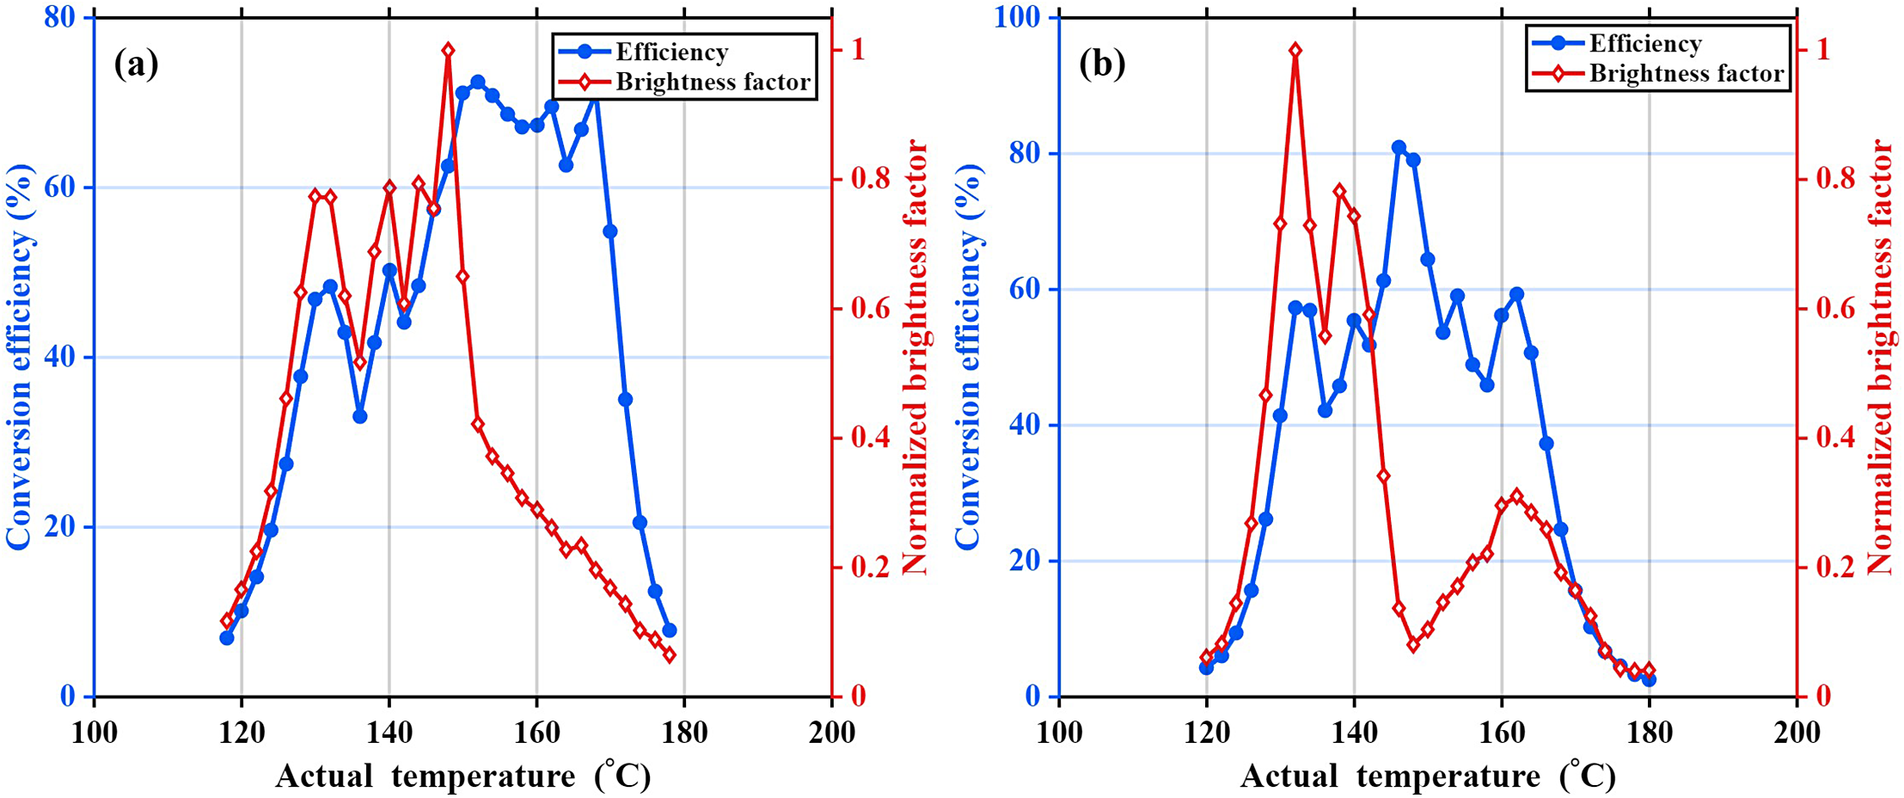
Brightness and efficiency temperature bandwidths. (a) Brightness-oriented adiabatic trajectory. (b) Conventional adiabatic trajectory.

Figure 8 Long description
The figure consists of two panels, a and b. Both panels share the same axes: the X-axis represents Actual temperature in degrees Celsius from 100 to 200. The left Y-axis represents Conversion efficiency in percent from 0 to 80 or 100. The right Y-axis represents Normalized brightness factor from 0 to 1.
Panel a, labeled Brightness-oriented adiabatic trajectory, shows two data series. The Efficiency curve (blue circles) rises from 120 degrees, peaks at approximately 75 percent near 150 degrees, and then drops sharply after 170 degrees. The Brightness factor curve (red diamonds) shows multiple peaks between 130 and 150 degrees, reaching a maximum of 1.0 at 148 degrees, followed by a steady decline.
Panel b, labeled Conventional adiabatic trajectory, shows the Efficiency curve (blue circles) peaking later at approximately 80 percent around 145 to 150 degrees before declining. The Brightness factor curve (red diamonds) peaks much earlier at 132 degrees reaching 1.0, then drops significantly to below 0.2 for the remainder of the temperature range, with a small secondary bump around 160 degrees.
Furthermore, the second-harmonic output power, light-to-light conversion efficiency and output beam quality of the brightness-oriented adiabatic trajectory and the conventional adiabatic trajectory were measured under different fundamental powers, as shown in Figure 7. At the maximum incident fundamental average power of 128 W, the brightness-oriented adiabatic trajectory produced 79.87 W of green output, corresponding to a light-to-light conversion efficiency of 62.4%. For comparison, the conventional adiabatic trajectory produced 101.2 W of green output, corresponding to a light-to-light conversion efficiency of 79.06%. As the input power increased, the second-harmonic output power increased continuously for both trajectories. The conventional adiabatic trajectory produced higher output power and conversion efficiency at high input powers, indicating that its longitudinal phase-mismatch evolution maintained stronger nonlinear energy coupling in the later part of the crystal. However, this was accompanied by pronounced degradation of the output beam quality, with the beam quality factor increasing to
${M}^2=4.46$
 at the maximum output. Because the brightness factor is not only related to the second-harmonic output power or conversion efficiency but is also strongly constrained by the beam quality factor, beam quality degradation can significantly reduce the output brightness. Therefore, although the conventional adiabatic trajectory achieved higher conversion efficiency, its brightness factor was only 3.97. In contrast, the brightness-oriented adiabatic trajectory showed lower conversion efficiency than the conventional trajectory, but maintained better output beam quality throughout the power-scaling process. At the maximum output, the beam quality factor was
${M}^2=1.24$
 , corresponding to a brightness factor of 40.58. These results show that, in high-power picosecond SHG in LBO, simply enhancing nonlinear energy conversion does not necessarily lead to higher-brightness output. If the coupling in the later part of the crystal is excessively strong, thermally induced phase mismatch, spatial walk-off and transverse amplitude and phase distortions caused by nonuniform conversion can accumulate more readily, leading to beam quality degradation. By appropriately reducing the excessive coupling in the later part of the crystal and allowing the main energy-exchange process to be completed more gradually near the middle of the crystal, the proposed trajectory suppresses the accumulation of spatial distortions while maintaining high second-harmonic output capability, thereby enabling higher-brightness picosecond green output.
Comparing the output performance only at the optimum operating point is insufficient to reflect the practically usable operating range of the system under temperature perturbations. Therefore, while keeping all other experimental conditions unchanged, the same overall temperature offset was synchronously applied to the five-section temperature-controlled oven. Here, the overall temperature offset means that all five temperature setpoints were increased or decreased by the same amount while their relative differences were kept unchanged. The conversion efficiency and output beam quality were then measured under each offset condition, and the corresponding variation of the brightness factor with temperature was obtained, as shown in Figure 8. According to the definition in Section 2, the brightness temperature bandwidth is defined as the full temperature width over which the normalized brightness factor remains above 50% of its peak value. The experimental results show that, for the brightness-oriented adiabatic trajectory, the brightness temperature bandwidth is approximately 25°C, whereas the efficiency temperature bandwidth is approximately 34°C. This indicates that, when the system deviates from the optimum operating point, its practically usable range is first limited by beam quality degradation rather than by the decrease in conversion efficiency. In other words, evaluating the temperature acceptance bandwidth solely from the efficiency curve would overestimate the practical usable temperature range under high-brightness operating conditions. Further comparison with the conventional adiabatic trajectory shows that its brightness temperature bandwidth and efficiency temperature bandwidth are approximately 18°C and 21°C, respectively. In contrast, the brightness-oriented adiabatic trajectory not only provides higher-brightness output at the optimum operating point but also maintains a wider temperature bandwidth under overall temperature offsets. This difference in the temperature-dependent behavior is mainly attributed to the different longitudinal phase-mismatch distributions of the two trajectories. Compared with the reference adiabatic trajectory, the optimized trajectory introduces a moderate linear contribution and a slight negative axial offset, which adjusts the zero-mismatch crossing position and reduces excessive nonlinear coupling in the rear part of the crystal. This helps suppress temperature-induced beam quality degradation while maintaining sufficient conversion efficiency. Therefore, the optimized trajectory exhibits a broader brightness-based temperature response, whereas the reference adiabatic trajectory is more sensitive to temperature detuning because its stronger rear-part coupling tends to favor efficiency but can more readily degrade the output beam quality.
4 Conclusion
In this work, a brightness-oriented adiabatic trajectory design method was proposed, and the designed trajectory was implemented through a longitudinal temperature distribution. At the optimum operating point, the brightness-oriented trajectory produced 79.87 W of picosecond green output at 532.286 nm, corresponding to a light-to-light conversion efficiency of 62.4%, with a beam quality factor of M 2 = 1.24. Compared with the conventional adiabatic trajectory, the proposed trajectory effectively suppressed beam quality degradation under high-power operation, thereby enabling higher output brightness. Meanwhile, its brightness temperature bandwidth reached 25°C, which was wider than that of the conventional adiabatic trajectory. This result indicates that the proposed trajectory can improve the output brightness while extending the temperature bandwidth of the system.
Furthermore, a temperature-bandwidth evaluation method based on the brightness factor was introduced. The experimental results show that the brightness temperature bandwidth of the optimized trajectory is smaller than its efficiency temperature bandwidth, indicating that defining the temperature bandwidth solely by conversion efficiency overestimates the practically usable temperature range of high-brightness SHG systems. Therefore, the brightness temperature bandwidth can more accurately reflect the operating range of the system under the joint constraints of output power and beam quality.
In contrast to previous adiabatic frequency-conversion studies that mainly focused on conversion efficiency and temperature tolerance, this work incorporates output beam quality into longitudinal phase-mismatch trajectory design and introduces the brightness temperature bandwidth as an evaluation concept for high-brightness LBO-based picosecond SHG systems. This method not only improves the output brightness of picosecond green generation but also extends the effective operating temperature range in terms of brightness, providing a new route for trajectory design and performance evaluation in high-brightness LBO-based picosecond SHG systems.
Acknowledgments
This work was supported by the National Key Research and Development Program of China (Grant No. 2023YFA1608503).


 Open access

