Introduction
Organic dyes are the most commonly used fluorescent probes for bio-sensing. Due to the small size, they are not likely to interfere biologic interactions monitored.[Reference Tynan, Clarke, Coles, Rolfe, Martin-Fernandez and Webb1] In order to avoid auto-fluorescence of biologic molecules and cells and to achieve high sensitivity, near-infrared (NIR) wavelength is preferentially used for fluorescence bio-sensing.[Reference Tynan, Clarke, Coles, Rolfe, Martin-Fernandez and Webb1] However, NIR luminescent organic dyes often suffer from fast degradation and are not suitable for long-term observations.[Reference Gao, Yang, Petros, Marshall, Simons and Nie2] In addition, the small Stokes shift and resultant difficulty in the complete removal of excitation light degrade the sensitivity.[Reference Resch-Genger, Grabolle, Cavaliere-Jaricot, Nitschke and Nann3] Semiconductor quantum dots (QDs) are considered to be a promising candidate to replace NIR organic fluorescent dyes due to several superior physical and optical properties such as the size controllability of the luminescence wavelength, the narrow luminescence band, the high luminescence quantum yield, and the high photostability.[Reference Gao, Yang, Petros, Marshall, Simons and Nie2–Reference Jaiswal, Goldman, Mattoussi and Simon10] However, in the usage of commercially available cadmium (Cd) chalcogenide, e.g., CdS, CdTe, CdSe, and ZnS-capped CdSe, QDs in biomedical fields and the release of free Cd ions, which are a known carcinogen and cause primary liver cell death, are always a concern.[Reference Tsoi, Dai, Alman and Chan11–Reference Godt, Scheidig, Grosse-Siestrup, Esche, Brandenburg, Reich and Groneberg13]
A silicon (Si)-QD is one of the heavy metal-free QDs potentially suitable for bio-sensing applications due to biocompatibility and the environmental friendliness.[Reference Liu, Erogbogbo, Yong, Ye, Liu, Hu, Chen, Hu, Yang, Yang, Roy, Karker, Swihart and Prasad14–Reference Peng, Su, Zhong, Fan, Lee and He19] Several groups have recently reported conjugation of Si-QDs and bio-substances such as antibodies and DNA towards the development of the biologic applications. Wang et al.[Reference Wang, Reipa and Blasic20] conjugated 1–2 nm diameter Si nanoparticles having the luminescence in the blue range (400 and 450 nm) to a 5′-amino-modified oligonucleotide via two photoinduced reactions followed by a DNA labeling step. He et al.[Reference He, Su, Yang, Kang, Xu, Zhang, Fan and Lee21] reported immunofluorescent cell imaging in an ~500 nm wavelength range by antibody-conjugated oxidized silicon nanospheres about 35 nm in diameter, in which luminescent Si-QDs are confined. Tu et al.[Reference Tu, Awasthi, Chen, Lin, Hamada, Ohta and Li22] demonstrated time-gated confocal fluorescence imaging in a red wavelength range on live cancer cells immune-stained by antibody-conjugated porous Si nanoparticles 100–150 nm in diameter. Recently, Robidillo et al.[Reference Robidillo, Aghajamali, Faramus, Sinelnikov and Veinot23] succeeded in conjugating Si-QDs having a luminescence band around 630 nm and enzymes through a thiol-ene reaction. These previous reports demonstrate the potential of luminescent Si-QDs for bio-sensing and bio-imaging applications. However, there still remains several research and development issues for the practical applications. In many of the previous researches, Si-QDs or the agglomerates encapsulated in thick organic or inorganic shells were used for bioconjugation.[Reference Sugimoto, Fujii, Fukuda, Imakita and Akamatsu24–Reference Fujii, Sugimoto and Imakita26] Because of the thick shells, the overall size is often much larger than that of individual bare Si-QDs. These relatively large particles are sometimes not very suitable for bio-sensing and bio-imaging. Furthermore, compared to blue to red emissions reported for bioconjugated Si-QDs that are in the NIR range is more preferable, because background signals caused by auto-fluorescence of bio-substances can be lowered.
In this work, we develop a process to conjugate NIR luminescent Si-QDs and IgG antibodies. As a Si-QD, we employ a boron (B) and phosphorus (P) codoped all-inorganic Si-QD developed in our group.[Reference Fujii, Sugimoto and Imakita26,Reference Fujii, Sugimoto and Kano27] The codoped Si-QD has a heavily B and P doped amorphous shell on the surface of a crystalline Si core.[Reference Sugimoto, Yamamura, Sakiyama and Fujii28] The shell induces negative potential on the surface of a Si-QD (ζ-potential: −35 mV)[Reference Sugimoto, Fujii, Fukuda, Imakita and Akamatsu24] and prevents the agglomeration in polar solvents such as alcohol and water by electrostatic repulsions.[Reference Sugimoto, Fujii, Imakita, Hayashi and Akamatsu25] Therefore, thick organic shells are not necessary to attain water dispersibility. The Si-QDs exhibit size-tunable luminescence in the NIR range due to donor–acceptor transitions.[Reference Sugimoto, Fujii, Imakita, Hayashi and Akamatsu29,Reference Sugimoto, Yamamura, Fujii and Fujii30] Furthermore, since excitons are confined to the crystalline Si core, the luminescence is stable in an aqueous solution in a wide pH range (1–10).[Reference Sugimoto, Fujii, Fukuda, Imakita and Akamatsu24] Because of these properties, the codoped Si-QDs have high potential for the bio-photonics applications.
In this article, we first develop a process to functionalize the surface of codoped Si-QDs by amino or epoxy groups without degrading the luminescence property and the solution dispersibility by using silane-coupling agents. We then conjugate surface-functionalized Si-QDs and IgG antibodies. We characterize IgG-conjugated Si-QDs carefully by electrophoresis, dynamic light scattering (DLS), and transmission electron microscopy (TEM), and demonstrate the successful conjugation. We also show that the binding property of IgG antibodies to antigens is preserved after the conjugation process.
Results and discussion
Conjugation of Si-QD and antibody
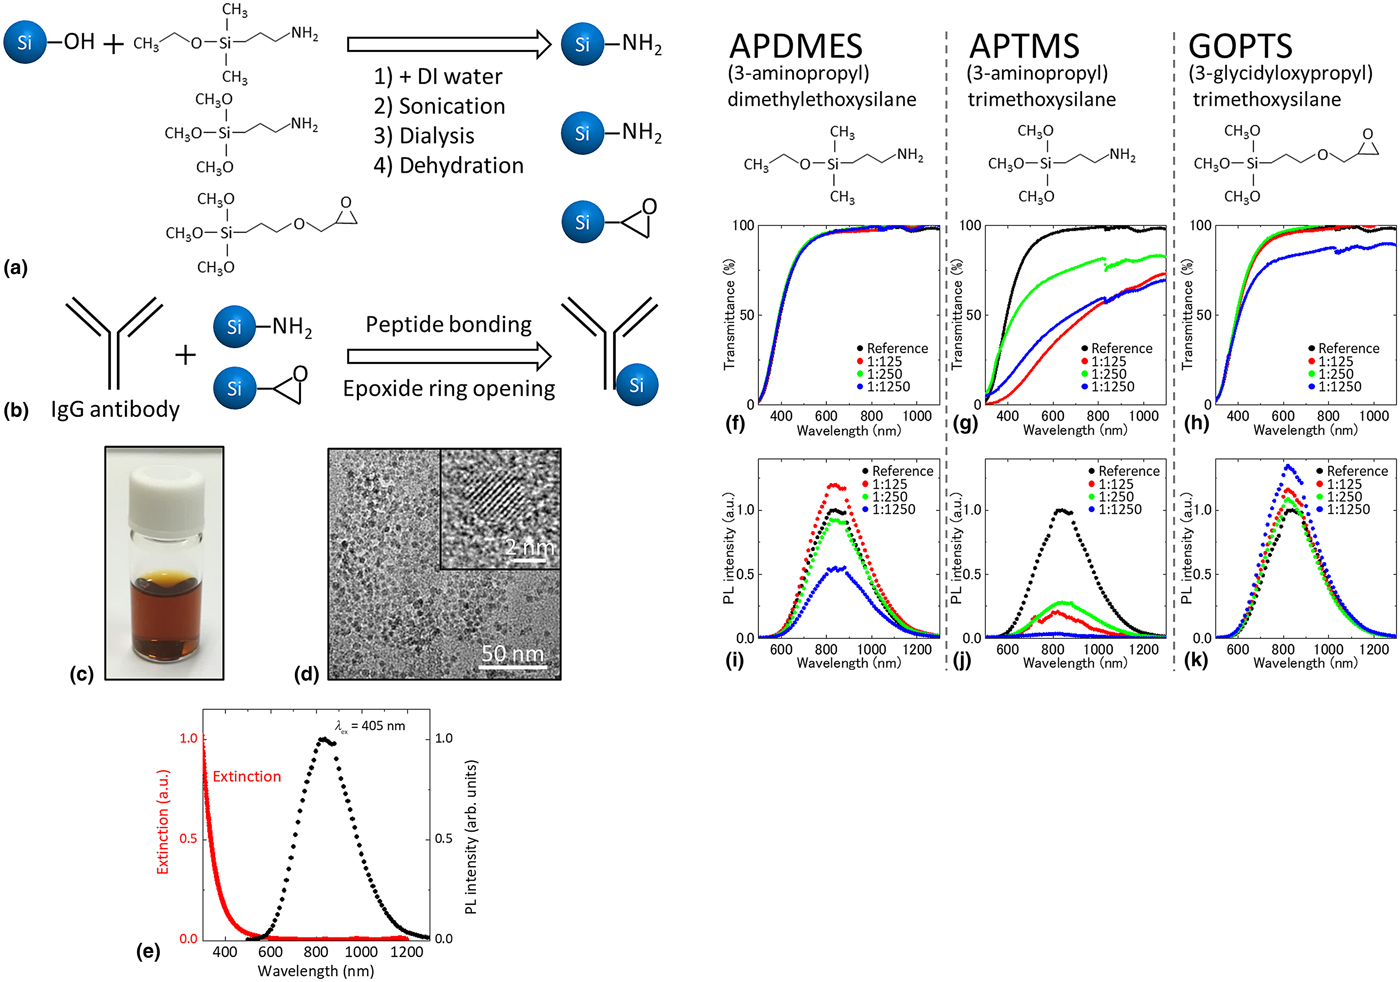
Figures 1(a) and 1(b) show the whole procedure for the conjugation of Si-QDs and antibodies. Details of each process are summarized in the Experimental Methods section. First, the surface of Si-QDs was functionalized by amino or epoxy groups by using silane-coupling agents. We tested three different types of silane-coupling agents, such as (3-aminopropyl) dimethylethoxysilane (APDMES), (3-aminopropyl) trimethoxysilane (APTMS), and (3-glycidyloxypropyl) trimethoxysilane (GOPTS), as shown in Fig. 1(a).[Reference Inoue, Sugimoto, Yaku and Fujii31–Reference Liu, Prall and Klimov33] We then conjugate the functionalized Si-QDs and IgG antibodies (anti-influenza A virus nucleoprotein (NP) antibody (abcam, Cambridge, UK, Ab66191)) (Fig. 1(b)). In the following section, we will show the results of the characterization of Si-QDs after each step.
Schematic diagram of the procedures of (a) surface functionalization of a Si-QD with silane-coupling agents and (b) conjugation of a Si-QD and an IgG antibody. (c) Photograph of colloidal dispersion of Si-QDs (methanol solution). (d) TEM image of a Si-QD monolayer produced by drop coating the colloidal solution on a TEM mesh. Inset is a high-resolution TEM image of a Si-QD. (e) Extinction spectrum (red) and PL spectrum excited at 405 nm (black) of Si-QDs in aqueous solution. (f–h) Optical transmittance spectra and (i–k) PL spectra excited at 405 nm of aqueous solutions of Si-QDs functionalized with different kinds of silane-coupling agents: APDMES: (3-aminopropyl) dimethylethoxysilane; APTMS: (3-aminopropyl) trimethoxysilane; GOPTS: (3-glycidyloxypropyl) trimethoxysilane. The nominal numbers of silane-coupling agents per a Si-QD are 125 (red), 250 (green), and 1250 (blue). The data of untreated Si-QDs are shown as references (black).
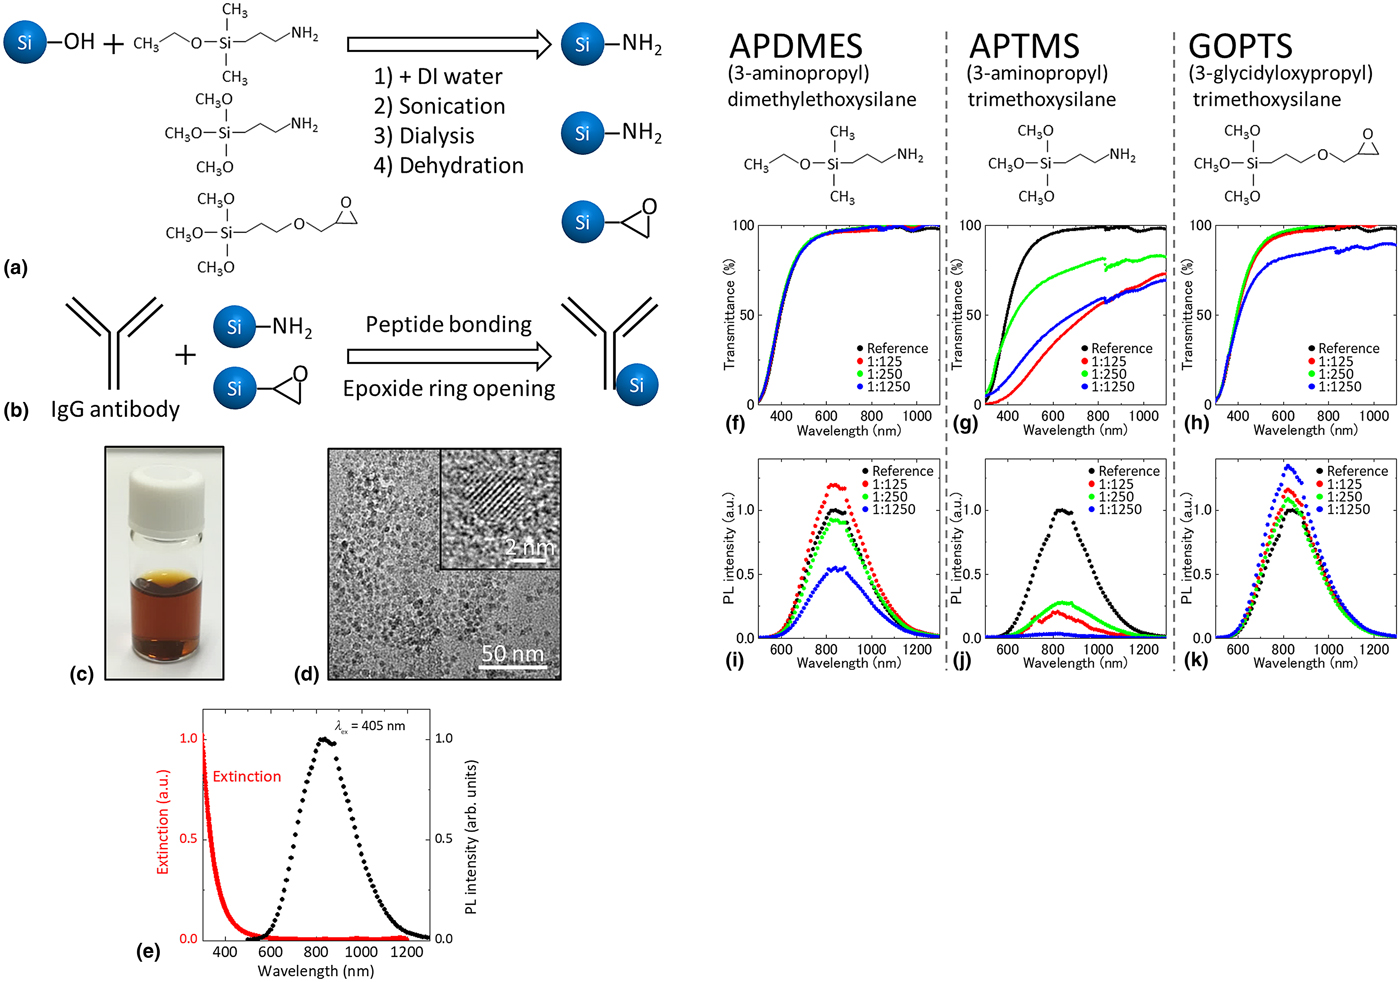
Figure 1(c) shows a photograph of the methanol solution of B and P codoped Si-QDs used in this work. Because of the perfect dispersion of the Si-QDs, the solution is very clear. Figure 1(d) shows a TEM (JEOL, Tokyo, Japan, JEM-2100F) image of a Si-QD layer prepared by drop-casting the diluted methanol solution on a carbon-coated Cu mesh. A densely packed monolayer of Si-QDs is formed and no three-dimensional agglomerates are observed. The lattice fringe in the high-resolution image (inset in Fig. 1(d)) corresponds to {111} planes of Si crystal. The average size and the standard deviation of the diameter estimated from TEM images are 3.9 and 0.8 nm, respectively.[Reference Sugimoto, Fujii, Fukuda, Imakita and Akamatsu24] Figure 1(e) shows the extinction spectrum and the photoluminescence (PL) spectrum excited at 405 nm of an aqueous solution in which Si-QDs are dispersed. Because of the perfect dispersion of Si-QDs in water, the extinction is almost zero in the NIR range. The Si-QDs exhibit a broad PL around 800 nm in water. The PL quantum yield (QY) is about 3.9%.[Reference Sugimoto, Fujii, Fukuda, Imakita and Akamatsu24]
Figures 1(f)–1(h) show the optical transmittance spectra of aqueous solutions of Si-QDs functionalized with three kinds of silane-coupling agents. The molecular number ratios of Si-QDs and silane-coupling agents are 1:125, 1:250, and 1:1250. In the case of APDMES (Fig. 1(f)), the transmittance spectra are not modified by the functionalization process. This means that the process does not degrade the water dispersibility. On the other hand, in APTMS (Fig. 1(g)), the transmittance decreases even in the smallest mixing ratio (1:125). This is due to light scattering by Si-QD agglomerates. A positively charged amino group in APTMS cancels negative surface charges of Si-QDs and weakens the electrostatic repulsion between Si-QDs. The difference between APDMES and APTMS may be explained by different numbers of silanol groups. A larger number of silanol groups in APTMS than in APDMES results in bonding larger number of molecules, and thus the larger number of amino groups, on the surface of Si-QDs. Furthermore, APTMS may promote crosslinking between Si-QDs because of the multiple silanol groups.[Reference Inoue, Sugimoto, Yaku and Fujii31] In the case of GOPTS (Fig. 1(h)), the spectrum changes slightly only in the highest mixing ratio (1:1250). Since epoxy groups do not shield the negative surface charge of Si-QDs, agglomeration observed in the high mixing ratio is due to crosslinking between Si-QDs.
Figures 1(i)–1(k) show the PL spectra of aqueous solutions of functionalized Si-QDs. In all the cases, the PL spectral shape is not affected by the chemical process although the intensity is modified. The insensitiveness of the spectral shape against chemical treatments is a characteristic feature of B and P codoped Si-QDs and is considered to be due to the existence of a heavily B and P doped amorphous shell, which confines excitons in the crystalline Si core.[Reference Inoue, Sugimoto, Yaku and Fujii31] In fact, in conventional organic-capped Si-QDs, strong modification of the PL spectral shape sometimes changes the emission color from red to blue by the chemical treatments reported.[Reference Wang, Reipa and Blasic20,Reference Tu, Awasthi, Chen, Lin, Hamada, Ohta and Li22,Reference Dasog, De Los Reyes, Titova, Hegmann and Veinot34–Reference Cheng, Lowe, Reece and Gooding40] In the case of APDMES (Fig. 1(i)), the PL intensity slightly increases when the mixing ratio is 1:125 and slightly decreases at 1:250. Since the intensity change is very small, the quality of Si-QDs is considered to be not strongly modified when the mixing ratio is below 1:250. The notable PL quenching at very high APDMES concentration (1:1250) may be due to defect formation on the surface. Since the absorbance at the PL excitation wavelength (405 nm) does not change the functionalization process, the PL QY decreases at high APDMES concentration. In fact, in our previous study,[Reference Inoue, Sugimoto, Yaku and Fujii31] we observed shortening of the PL lifetime from around 95 µs (before the functionalization process) to around 57 µs when the APDMES concentration is very high. In the case of APTMS (Fig. 1(j)), the PL intensity decreases in all the mixing ratio. The quenching is explained by the agglomeration of Si-QDs and the resultant inefficient excitation and detection of the PL as well as the defect formation. In the case of GOPTS (Fig. 1(k)), the PL intensity increases slightly in all the conditions. It might be possible that a specific nonradiative process is cured by the functionalization process.[Reference Sugimoto, Hori, Imura and Fujii41] Although this is an interesting phenomenon, it is out of the scope of this paper and we will not discuss it more. From the results in Figs. 1(f)–1(k), the proper condition to achieve high-solution dispersibility and high PL intensity simultaneously after the functionalization process is use of APDMES or GOPTS as silane-coupling agents with the mixing ratio of ~1:250. In the following process for the conjugation of IgG antibodies and Si-QDs, we employ these conditions.
Characterization of Si-QD-conjugated IgG antibody
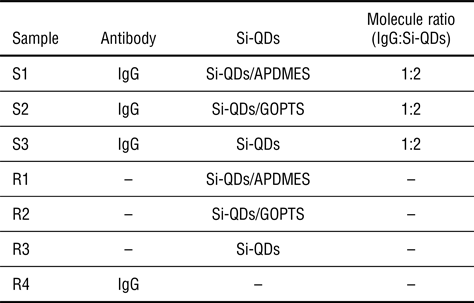
Table I shows the list of the samples. S1 and S2 are the samples produced from APDMES- and GOPTS-, respectively, functionalized Si-QDs and IgG antibodies. S3 is produced by mixing untreated Si-QDs and IgG antibodies. R1, R2, and R3 are APDMES-functionalized, GOPTS-functionalized, and untreated Si-QDs, respectively, without IgG antibodies. R4 is IgG antibodies without Si-QDs. Hereafter, we show the results of characterization of these samples by electrophoresis, DLS, and TEM.
List of samples.

S1, S2, and S3 are samples produced from APDMES-functionalized, COPTS-functionalized, and untreated Si-QDs, respectively, and IgG antibodies. R1, R2, and R3 are APDMES-functionalized, COPTS-functionalized, and untreated Si-QDs, respectively. R4 is IgG antibodies.
Electrophoresis
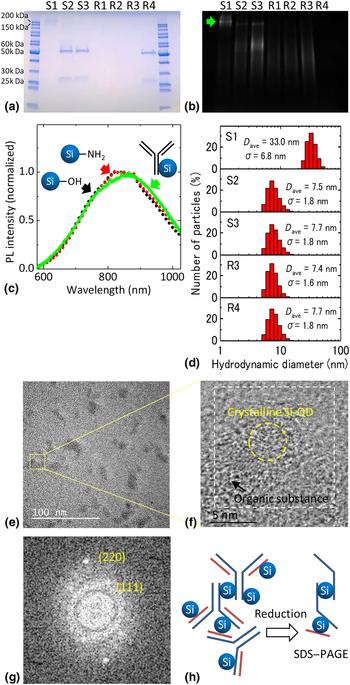
In order to confirm successful conjugation of Si-QDs and IgG antibodies, we perform reducing sodium dodecyl sulfate–polyacrylamide gel electrophoresis (SDS–PAGE) (Figs. 2(a)–2(c)). In SDS–PAGE, the influence of nonspecific adsorption can be minimized, and IgG antibodies are degraded into light and heavy chains by reducing agents. Therefore, we can monitor covalent bonding between Si-QDs and IgG antibodies. As shown in Fig. 2(a), IgG antibodies (R4) exhibit two bands around 25 and 50 kDa, which correspond to light and heavy chains of an IgG antibody, respectively.[Reference Pathak, Davidson and Silva8,Reference Sapparapu, Planque, Mitsuda, McLean, Nishiyama and Paul42,Reference Rižner43] In S1 (IgG antibody and Si-QDs functionalized with APDMES), both the 25 and 50 kDa bands almost disappear, and a wide and faint band appears around 200 kDa. This suggests that Si-QDs bind covalently to both the light and heavy chains. On the other hand, in S2 and S3, the 25 and 50 kDa bands, which are almost identical to those of R4, are seen although the 50 kDa band slightly spreads to the larger molecular weight side.
SDS–PAGE electrophoresis of the samples in Table 1. (a) CBB-stained image of the gel showing the position of IgG antibody (blue bands). (b) Si-QD PL image (800–840 nm) of the gel excited at 312 nm obtained without CBB stain. (c) Normalized PL spectrum of the 200 kDa band of the gel in S1 excited at 405 nm (green). The measurement position is shown by a green arrow in (b). The data of untreated (black) and APDMES-treated (red) Si-QDs are shown as references. (d) Number distributions of hydrodynamic diameter of S1–S3, R3, and R4 measured by DLS. (e) TEM image of sample S1. (f) Expansion of the region shown in a square in (e). (g) FFT image of the region surrounded by a dashed square in (f). (h) A model of IgG antibodies and Si-QD-conjugated composites in solution (left) and in SDS–PAGE (right).
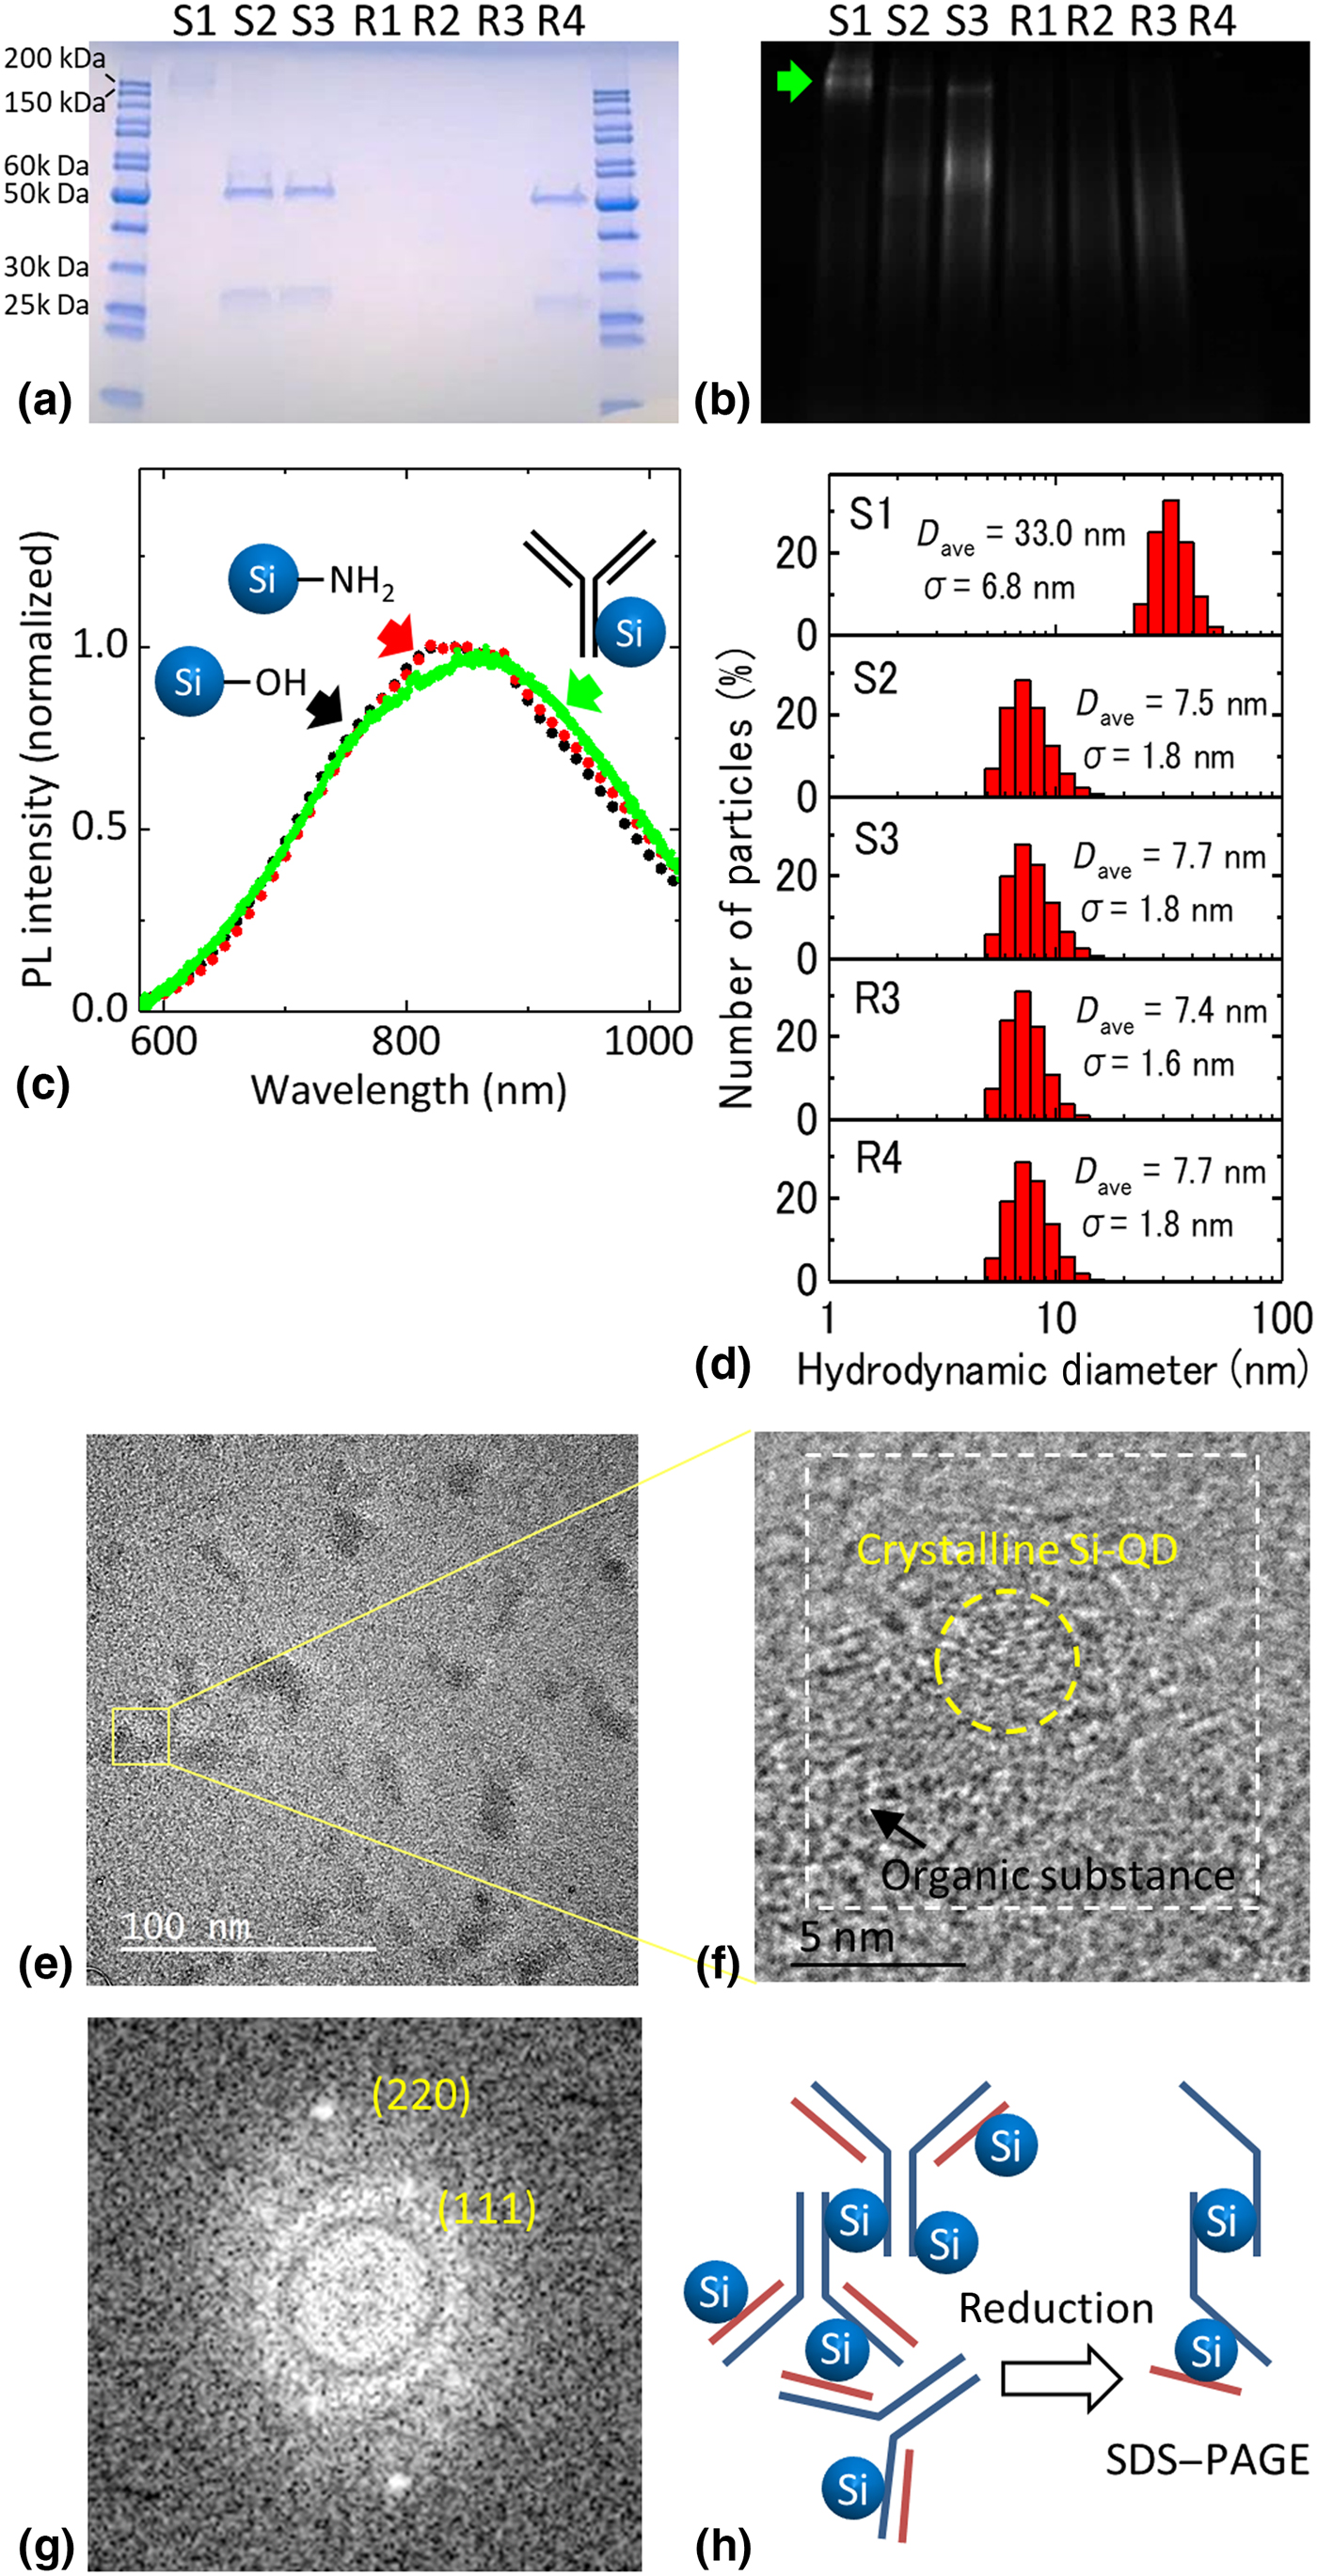
Figure 2(b) shows the PL image of the gel excited at 312 nm. A NIR band pass filter (800–840 nm) was used for the detection in order to extract PL from Si-QDs. In S1, a broad PL band is seen around 200 kDa. The PL band perfectly co-localizes with the IgG antibody-stained band around 200 kDa in Fig. 2(a). In order to confirm that the PL band arises from Si-QDs, we measured the PL spectrum of the gel around 200 kDa. The normalized PL spectrum is shown in Fig. 2(c) together with the spectra of untreated and APDMES-functionalized Si-QDs in solution. The three spectra coincide almost perfectly, indicating that the detected PL is from Si-QDs. If we compare the PL intensity of S1 in a solution with that of APDMES-functionalized Si-QDs in a solution, it is about 57%. Therefore, additional nonradiative processes are introduced by the conjugation process.
The perfect agreement between the PL band and the IgG antibody-stained band around 200 kDa, and the absence of the 25 and 50 kDa bands imply that almost all IgG antibodies conjugate with Si-QDs in S1. The molecular weight as large as 200 kDa after conjugation suggests that multiple Si-QDs are bound to an IgG antibody. Furthermore, it is possible that a few IgG antibodies are bound via Si-QDs. We will discuss the structure of the composites based on the DLS and TEM results later.
In samples S2 and S3, faint PL bands appear around 50–60 and 150 kDa. The appearance of a band around 150 kDa suggests that IgG antibodies/Si-QD composites are formed slightly although the amount is much smaller than that in S1. The appearance of the broad 50–60 kDa PL band is consistent with the spread of the 50 kDa IgG antibody-stained band in Fig. 2(a) and suggests the attachment of Si-QDs to IgG antibodies, although the amount is again very small.
Dynamic light scattering
Figure 2(d) shows the number distributions of the hydrodynamic diameter of S1–S3 and R3–R4 obtained by DLS (Malvern, Zetasizer Ultra). The peak hydrodynamic diameters of the intensity, volume, and number distributions are summarized in SupplementaryFig. S1. The difference in the peak diameters between them is small. This indicates that very large agglomerates outside the abscissa of Fig. 2(d) are not formed. We employed the number distributions for the discussion of the composite size. The average hydrodynamic diameter of Si-QDs (R3) is 7.4 nm, which is larger than the size estimated from TEM observations. Similar discrepancy between a hydrodynamic diameter and a diameter estimated from TEM images is reported in water-dispersed Si-QDs.[Reference He, Zhong, Peng, Wei, Su, Lu, Su, Gu, Liao and Lee44] The average hydrodynamic diameter of IgG antibodies (R4) is 7.7 nm. The average hydrodynamic diameters of S2 and S3 are 7.5 and 7.7 nm, respectively. These values are close to those of R3 and R4, indicating that the majority of IgG and Si-QDs are in isolated states. This is consistent with the electrophoresis data in Figs. 2(a) and 2(b) that the bands from IgG antibodies/Si-QDs composites are very faint in these samples. The average hydrodynamic diameter of S1 is much larger than that of others and it is 33.0 nm. This confirms the electrophoresis data in Figs. 2(a) and 2(b) that IgG antibodies and Si-QDs are successfully conjugated in S1. Note that no particles below 10 nm are observed in the DLS data of S1, indicating that all IgG antibodies and Si-QDs are consumed for the formation of the composites.
Transmission electron microscopy
Figure 2(e) shows a TEM image of S1. To reduce the background noise of an amorphous carbon support film and to observe organic substances clearly, we used a graphene oxide support film.[Reference Sugimoto, Yamamura, Sakiyama and Fujii28] We can see amorphous objects around 20–30 nm in size. They are most probably Si-QD-conjugated IgG antibodies. Figure 2(f) shows an enlarged image of the region surrounded by a yellow square in Fig. 2(e). In an amorphous object, we can see a crystalline particle about 4.2 nm in diameter. Figure 2(g) is the fast Fourier transform (FFT) image of the region surrounded by a dashed square in Fig. 2(f). On halo rings from amorphous objects, we can see several spots. These spots agree well with {111} and {220} planes of crystalline Si (JCPDS No. 27-1402). [Reference Sugimoto, Fujii, Imakita, Hayashi and Akamatsu25] This confirms that the particle seen in Fig. 2(f) is a Si-QD and it is conjugated to an IgG antibody. Note that isolated Si-QDs similar to Fig. 1(d) were not observed in sample S1.
From the electrophoresis, DLS, and TEM results, it is very plausible that, in S1, multiple Si-QDs are bound to an IgG antibody, and a few IgG antibodies are bound via Si-QDs. Figure 2(h) (left) shows a schematic illustration of a model structure of a composite. In this model (Fig. 2(h) (left)), considering the facts that the length of an IgG antibody is ~15 nm and that IgG antibodies and Si-QDs form a three-dimensional complex,[Reference Du, Du, Falini and Fermani45,Reference Nobbmann, Connah, Fish, Varley, Gee, Mulot, Chen, Zhou, Lu, Sheng, Yi and Harding46] the size of the composite is around 30 nm, which is close to the peak value in the size distribution obtained by DLS (Fig. 2(d), S1). The molecular weight obtained by adding the weights of IgG antibodies and Si-QDs in the model in Fig. 2(h) (left) is about 690 kDa. In SDS–PAGE electrophoresis, the reducing agent reduces the disulfide bonds within an antibody that results in the separation of heavy and light chains as schematically shown in Fig. 2(h) (right). In the model structure in Fig. 2(h) (right), the molecular weight is about 205 kDa, which agrees with the PL and IgG antibody-stained bands in Figs. 2(a) and 2(b).
Antibody-binding characteristics
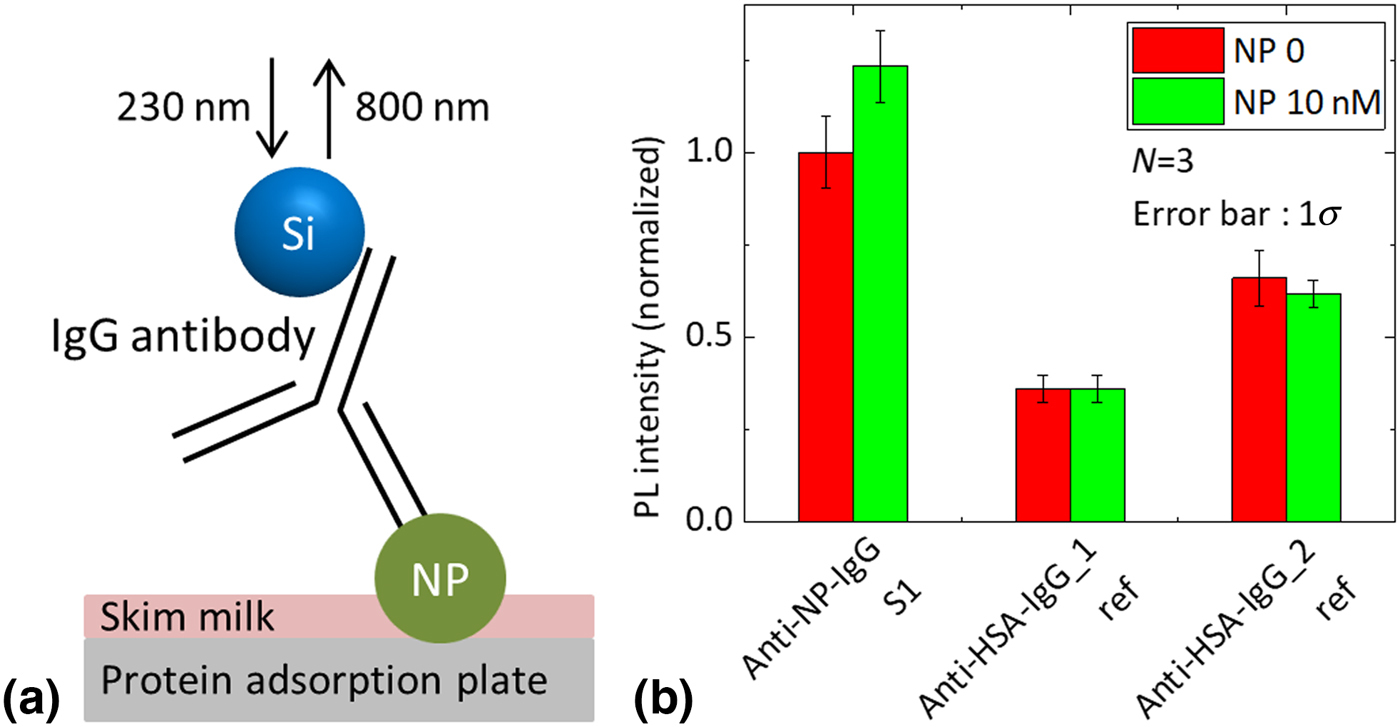
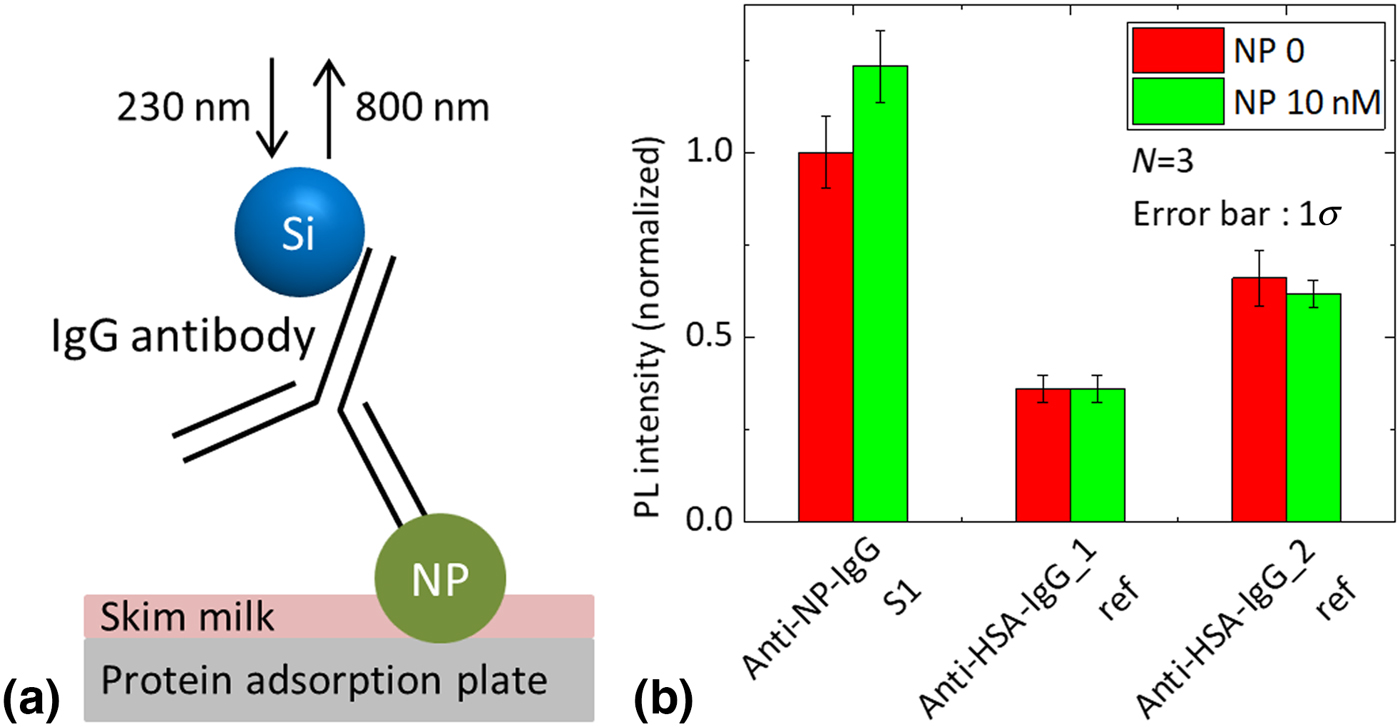
It is crucial that IgG antibodies maintain the binding property to an antigen after conjugation with Si-QDs, in order to confirm that a fluorescent immunoassay was performed using influenza virus NP as an antigen. Figure 3(a) shows the schematic illustration of fluorescence immunoassay for the NP detection. To distinguish the antigen–antibody reaction from nonspecific adsorption, we also prepare APDMES-functionalized Si-QDs conjugated with two kinds of anti-human serum albumin (HSA) antibodies as controls. Figure 3(b) shows PL intensities of Si-QDs on a NP-immobilized protein adsorption plate (green bars). The PL intensities on a NP-free plate are shown by red bars. In sample S1, NP immobilization increases the PL intensity. On the other hand, it does not affect the PL intensity in the samples with anti-HSA antibodies. The observed difference between the anti-NP and anti-HSA antibodies indicates that the PL intensity increase in S1 is due to the antigen–antibody reaction, that is, antigen-binding ability of the IgG antibody is preserved after conjugation with Si-QDs. However, at this stage of research, the PL intensity increase due to the antigen–antibody reaction with respect to the PL due to the nonspecific adsorption is relatively small. In order to improve the sensitivity of the antigen detection, the development of a process to suppress the nonspecific adsorption is indispensable.
(a) Schematic illustration of fluorescence immunoassay for NP detection. (b) PL intensity of Si-QDs (800 nm) on a protein adsorption plate with (green bars) and without (red bars) immobilized NP for three samples: anti-NP IgG antibodies and two kinds of anti-HSA IgG antibodies conjugated with APDMES-functionalized Si-QDs. The excitation wavelength is 230 nm. The bar graph shows the mean value (N = 3) and the error bar shows the standard deviation.
Conclusions
We produced water dispersible and NIR luminescent Si-QDs functionalized with amino and epoxy groups using silane-coupling agents. By using amino-functionalized Si-QDs, IgG antibodies and Si-QDs were successfully conjugated. In order to prove the conjugation, the composite was investigated in detail by SDS–PAGE electrophoresis, DLS, and TEM. The electrophoresis results revealed that Si-QDs are covalently bonded to both light and heavy chains of IgG antibodies. We showed that the conjugation does not affect the luminescence property of Si-QDs. Fluorescence immunoassay confirms that IgG antibodies preserve the binding property with antigen after conjugation with Si-QDs. The successful conjugation of IgG antibody and Si-QDs by covalent bindings paves the way for designing high sensitivity and high bio-compatible-sensing devices/processes.
Experimental methods
Preparation of colloidal solution of B and P codoped Si-QDs
Colloidal solutions of B and P codoped Si-QDs were fabricated by a cosputtering method. Details of the preparation procedure are found in our previous papers.[Reference Sugimoto, Fujii, Imakita, Hayashi and Akamatsu25,Reference Sugimoto, Fujii, Imakita, Hayashi and Akamatsu29] Briefly, Si, SiO2, B2O3, and P2O5 were simultaneously sputtered, and a Si-rich borophosphosilicate glass (BPSG) film was deposited on a stainless-steel plate. The film was peeled off from the plate and annealed in a N2 gas atmosphere at 1100 °C for 30 min to grow codoped Si-QDs in a BPSG matrix. Si-QDs were then extracted from a matrix by hydrofluoric acid (HF) etching. Si-QDs in a HF solution were transferred to methanol.[Reference Sugimoto, Fujii, Fukuda, Imakita and Akamatsu24]
Surface functionalization of Si-QDs
For the functionalization of the surface of Si-QDs by amino or epoxy groups, we use the surface Si–O bonds, which are abundant after a few month storage of Si-QDs in methanol.[Reference Inoue, Sugimoto, Yaku and Fujii31] In order to introduce amino and epoxy groups onto the surface via the Si–O bonds, three different types of silane-coupling agents, such as APDMES, APTMS, and GOPTS, were employed (Fig. 1(a)).[Reference Inoue, Sugimoto, Yaku and Fujii31–Reference Liu, Prall and Klimov33] First, 20 µL of silane-coupling agent was added to a methanol solution of Si-QDs (200 µL). The concentration of Si-QDs was 0.1 mg/mL, while that of silane-coupling agent was chosen so that the number ratio of the molecules per a Si-QD becomes 125, 250, and 1250. The Si-QD concentration was determined from the absorbance data using the previously obtained relationship between the absorbance at 400 nm and the Si-QD concentration measured by inductively coupled plasma atomic emission spectroscopy.[Reference Sugimoto, Fujii, Imakita, Hayashi and Akamatsu29] After mixing, 20 µL of deionized (DI) water was added and sonicated for 15 min to promote hydrolysis. To remove unreacted molecules of the silane-coupling agent, the solution was dialyzed against DI water using Slide-A-Lyzer™ G2 Dialysis Cassettes (Thermo Fisher, 7K MWCO) three times (1 h, 1 h, and 1 night) in a refrigerator at 4 °C.[Reference Li, Shih and Shih47–Reference Chen, Liu, Mao, Yin, Wang and Chen49] The final concentration of Si-QDs in DI water was 0.1 mg/mL. Finally, the solution was heated at 95 °C for 10 min to enhance the covalent bonding of silane-coupling agent with Si-QDs.[Reference Inoue, Sugimoto, Yaku and Fujii31,Reference Park, Park, Han and Lee50,Reference Kulkarni, Ogale and Vijayamohanan51]
Conjugation of Si-QD and antibody
The IgG antibody used in this work is anti-influenza, a virus NP antibody (abcam, Cambridge, UK, Ab66191). Amine-terminated Si-QDs and IgG antibodies were conjugated by peptide bonding using 4-(4,6-dimethoxy-1,3,5-triazin-2-yl)-4-methylmorpholium chloride (DMT-MM) as a condensing agent in phosphate-buffered saline (PBS) buffer (pH 7.4). The number ratio of Si-QDs to IgG antibodies in PBS buffer was two. The incubation was conducted at room temperature for 4 h.[Reference Inoue, Sugimoto, Yaku and Fujii31,Reference Kunishima, Kawachi, Hioki, Terao and Tani52] Epoxy-terminated Si-QDs and IgG antibodies were conjugated by an epoxide ring opening reaction with amines of IgG antibodies via the active amine hydrogen in PBS buffer (pH 7.4). The incubation is conducted at room temperature overnight.[Reference Kanno, Kano, Sugimoto, Tada and Fujii32,Reference Kamra, Chaudhary, Xu, Johansson, Montelius, Schnadt and Ye53]
TEM observation
TEM observations were performed by JEM-2100F (JEOL, Tokyo, Japan) operated at 200 kV. Solutions of Si-QDs or composites were dropped on a copper TEM mesh covered by an amorphous carbon film or graphene oxide monolayers. The background noise of a graphene oxide support film is much smaller than that of an amorphous carbon support film.
Optical characterization
Optical transmittance spectra were measured by a UV–VIS spectrophotometer (Shimadzu, Kyoto, Japan, UV-1600PC). PL spectra were measured by a spectrophotometer equipped with a Xe lamp and a double-grating monochromator as an excitation source and a single-grating monochromator and a photomultiplier as a detector (HORIBA, Kyoto, Japan, Fluorolog-3).
Electrophoresis
SDS–PAGE electrophoresis was performed using a vertical electrophoresis cell (Bio-Rad, CA, USA, Mini-PROTEAN) with precast polyacrylamide gel (Bio-Rad, CA, USA, Any kD Mini-PROTEAN TGX precast gel) in Tris/Glycine/SDS buffer (Bio-Rad) at 200 V for 30 min. Sample buffer (Thermo Fisher, MA, USA, NuPAGE LDS Sample Buffer) and sample reducing agent (Thermo Fisher, MA, USA, NuPAGE Sample Reduction Agent) were added to samples before loading. In staining IgG antibodies in gel, it was immersed in a Coomassie brilliant blue (CBB) staining solution (Atto, Tokyo, Japan, EzStain AQUA) for 1 h and then decolorized with DI water overnight at room temperature. PL bands of Si-QDs in gel were observed using the Chemiluminescence Imaging System (Vilber-Lourmat, Collégien, France, FUSION FX) with a NIR band pass filter (800–840 nm). The excitation wavelength was 312 nm. PL spectra of Si-QDs in gel were measured using a spectrometer with a CCD camera. The excitation wavelength was 405 nm.
Fluorescence immunoassay
In fluorescence immunoassay, the NP of influenza (Sino Biological, China, Recombinant Influenza H1N1 NP) was immobilized on the surface of a protein adsorption plate (Thermo Fisher, MA, USA, F Maxi Sorp) as antigen at room temperature.[Reference Guo, Peng, Yang, Peng, Yu and Wang54] Then, skim milk was spread as a blocking agent to suppress nonspecific adsorption. After removing surplus skim milk, a sample solution was poured onto the plate and left for 3 h at room temperature. After removing the sample solution, the plate was washed three times with PBS-Tween (0.05%) using a plate washer (TECAN, Zurich, Switzerland, HydroFlex). PL was excited at 230 nm and measured by a plate reader (TECAN, Zurich, Switzerland, infinite M1000 PRO). The PL detection wavelength was 800 nm.
Supplementary material
The supplementary material for this article can be found at https://doi.org/10.1557/mrc.2019.98.
Acknowledgments
This work was partly supported by the 2015 JST Visegrad Group (V4)-Japan Joint Research Project on Advanced Materials, JSPS KAKENHI grant numbers 16H03828, 18K14092, and 18KK0141, and JSPS 2018 Bilateral Joint Research Projects (Japan−Australia).