INTRODUCTION
Sexual dimorphism is widespread among the Animal Kingdom (Gilbert & Williamson, Reference Gilbert and Williamson1983; Shine, Reference Shine1989); the most common and studied is body size dimorphism (Shine, Reference Shine1989). Invertebrates and lower vertebrates tend to favour female larger sizes, related to higher fecundity, while in birds and mammals the males are usually larger (Arak, Reference Arak1988). Among gastropods, dimorphism is reported in shell size, radular characteristics, and to a lesser extent in shell shape (Pastorino, Reference Pastorino2007; and citations therein). The relationship of dimorphic characters of the shell with spawning has been previously reported in turrid and olivid species (Shimek, Reference Shimek1984; Kantor & Sysoev, Reference Kantor and Sysoev1991; Pastorino, Reference Pastorino2007), but never in nassariids.
Buccinanops d'Orbigny, 1841, is distributed along the coast of the South-western Atlantic Ocean. Species of this genus are gonochoric with internal fertilization. Embryonic development in Buccinanops sp. is completed within the egg capsule by the ingestion of thousands of nurse eggs (Penchaszadeh, Reference Penchaszadeh1971; Averbuj & Penchaszadeh, Reference Averbuj and Penchaszadeh2010). Buccinanops globulosus (Kiener, 1834) is distributed on soft bottoms from Uruguay to Santa Cruz province (Rios, Reference Rios2009), in Argentina. In Patagonia, it lives in temperate coastal waters of the lower intertidal and upper subtidal zones, usually at depths <5 m, at low tide (Pastorino, Reference Pastorino1993).
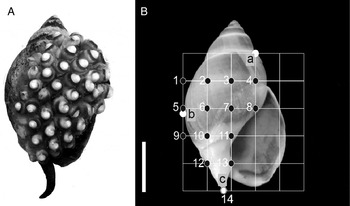
This species is an interesting model to study sexual dimorphism in shell shape, because the adults spawn a variable number of elongated and flexible egg capsules that are attached by stalks to the females’ own shells (Penchaszadeh, Reference Penchaszadeh1971; Scarabino, Reference Scarabino1977; Averbuj et al., Reference Averbuj, Rocha and Zabala2014; Averbuj & Penchaszadeh, Reference Averbuj and Penchaszadehin press). As previously described for other species of Buccinanops, sexual dimorphism is subtle, with the maximum shell size being smaller in males than in females (Narvarte, Reference Narvarte2006; Averbuj et al., Reference Averbuj, Bigatti and Penchaszadeh2010; Avaca et al., Reference Avaca, Narvarte and Martín2012). In respect of the shell shape dimorphism in B. globulosus, 2D shell shape differences were reported by Avaca et al. (Reference Avaca, Narvarte, Martín and Van der Molen2013), indicating that males presented more elongated shells and more slender apertures than the females. Research about the sexual dimorphism of the shell has tended, to date, to focus on overall shape rather than on a particular area of it. Considering that the females attached the egg capsules in the callus and surrounding area (henceforth callus zones) of the shell (Figure 1A), we hypothesized that the shell dimorphism is evidenced in the form (size and shape) of that particular zone of females' shells, compared with the males'. This may be explained by an optimization in egg capsule arrangement that would enable optimal reproductive output by avoiding spatial limitation. Specifically, we predict that the female callus zones present morphological differences compared with males.
Apertural view of the shell of Buccinanops globulosus. (A) Female carrying the egg capsules in the callus zones. (B) Diagram showing the position of the 14 landmarks used (black points) of a total of 36 landmarks created by grid line intersections. Three white landmarks (a: The right edge of the outline of the shell at the 3rd of the lower suture of the penultimate whorl; b: the most external point of the body whorl and c: end of the siphonal channel) were used to delimit the boundaries of callus zones. Scale bar = 1 cm.

We used 3D geometric morphometrics (GM) methods to characterize the shell shape of the callus zone of gastropods (a complex 3D structure); these methods were used instead of 2D GM because they make up one of the main drawbacks of the geometric morphometrics techniques, which consists in studying the 2D shape variation of structures which present very complex 3D structures (Márquez et al., Reference Márquez, González-José and Bigatti2011). Geometric morphometrics methods provide the most effective way to capture information about the shape of an organism, especially when combined with multivariate statistical procedures (Rohlf & Marcus, Reference Rohlf and Marcus1993; Adams et al., Reference Adams, Rohlf and Slice2004; Zelditch et al., Reference Zelditch, Swiderski, Sheets and Fink2004). Another important advantage of GM is that it allows graphical visualization of the results of any multivariate statistical analyses, because the geometric nature implicit in the concept of shape is kept during the analyses (Adams et al., Reference Adams, Rohlf and Slice2004). Geometric morphometrics methods have been used in several applications to study different topics of shape variation in gastropods, from taxonomy to pollution effects (for a review see supplementary data in Márquez et al., Reference Márquez, Nieto Vilela, Lozada and Bigatti2015; Primost et al., Reference Primost, Bigatti and Márquez2016). However, only a few studies have used this approach in 3D (Márquez et al., Reference Márquez, González-José and Bigatti2011, Reference Márquez, Nieto Vilela, Lozada and Bigatti2015). Our findings are not only of interest in terms of the shell dimorphism of the particular area (callus zone) and its reproductive implications, but also provide insights into the evaluation of shell shape variation on areas without anatomical landmarks such as shell surfaces.
MATERIALS AND METHODS
Sampling
A total of 184 snails representing the total size range of reproductively mature individuals (Averbuj et al., Reference Averbuj, Rocha and Zabala2014) were randomly chosen from the sandy subtidal up to 5 m in depth at Cerro Avanzado beach (42°25′S 64°07′W), on the coast of the Nuevo Gulf, Patagonia, Argentina. The sampling was carried out before the reproductive season to prevent collecting females with egg capsules. Individuals were transported to the laboratory and preserved frozen (−20°C). Sex was determined based on the presence or absence of sexual accessory glands (albumen, capsule and pedal glands in females), then shells were carefully cleaned. In total, 90 males (Total Length (TL): 18.02 to 33.71 mm) and 94 females (TL: 21.74 to 49.15 mm) were analysed. All specimens were housed in the Invertebrate Collection at Centro Nacional Patagónico (CENPAT – CONICET), under prefix CNP-INV-1700.
3D geometric morphometrics
Analyses of snails’ shell shape were performed using the software MorphoJ version 1.05c (Klingenberg, Reference Klingenberg2011). Unfortunately callus zones, as with most gastropod shell surfaces, lack type I or II landmarks (Bookstein, Reference Bookstein1991). Type I and type II are defined as anatomical landmarks such as the intersection of sutures, the intersection of insect wing veins or ending point of the structures, cusp of teeth, and apex of shells among others. These problems were addressed by using a set of constructed mathematical landmarks on to the callus zone. We employed a slide projector to superimpose a grid over the studied zone of each snail, as in the protocol developed by Maddux & Franciscus (Reference Maddux and Franciscus2009) for infraorbital landmarks in human skulls. The forms of the callus zone of the shells were captured by the Cartesian coordinates of a three-dimensional configuration of 14 landmarks (Figure 1A, B). To capture these configurations, a standardized grid (5 × 5) was superimposed onto each specimen (with all gridlines oriented either orthogonal or parallel to the apertural plane, with the apex on top, in which each snail was oriented) by a Samsung projector equipped with levelling gauges. The grid was produced in Corel Draw, with the cells set to lock-aspect ratio to automatically maintain proportionality when the vertical and horizontal dimensions of the entire grid are manually adjusted to the boundaries of shell. The boundaries of the superimposed grid were constructed by three anatomical landmarks on the shell (Figure 1B). Once aligned to these three shell boundaries, the vertical and horizontal dimensions of each individual were represented by vertical and horizontal dividing lines. The gridline intersections were easily identifiable and each point of the grid corresponds to the same point on the grid on all specimens. The intersections of these lines on the callus zone were digitized as homologous type III (Bookstein, Reference Bookstein1991) landmarks by one observer (FM) using a 3D Microscribe G2X digitizer. Before the digitalization of individuals, we calibrated the physical workspace of the Microscribe using for each individual the apex (origen), posterior angle of the aperture (X direction) and anterior tip of columella (Y direction) as a custom reference to define the origin and direction of the X and Y axes. Landmark configurations (X, Y, Z) were superimposed by generalized Procrustes analysis (Rohlf & Slice, Reference Rohlf and Slice1990; Slice et al., Reference Slice, Bookstein, Marcus, Rohlf, Marcus, Corti, Loy, Naylor and Slice1996). This procedure translates and rotates the landmark configurations to a common origin and scales them to unit centroid size.
The shape/size variation (allometry) refers to a change in shape associated with size differences. To assess putative allometric effects, we computed multivariate regression of shape (Procrustes coordinates used as dependent variables) on size (centroid size used as independent variable) (Bookstein, Reference Bookstein1991; Monteiro, Reference Monteiro1999; Klingenberg, Reference Klingenberg2011). Klingenberg (Reference Klingenberg2011) suggested that such regression serves to detect the effect of size, age or environmental factors before shape comparisons between groups. To evaluate the independence between the shape and size variables, we carried out a permutation test with 10 000 rounds. The centroid size was used as proxy for shell size and calculated for each specimen as the square root of the sum of the squared deviations of landmarks from the centroid (Bookstein, Reference Bookstein1991; Zelditch et al., Reference Zelditch, Swiderski, Sheets and Fink2004). To test the change in size between male and female, we performed a t-test for non-paired samples on centroid size. Finally, to visualize and test the separation of callus form between male and female, we performed a linear discriminant analysis (DA) using leave-one-out cross validation procedure to estimate the reliability of the discrimination. Shape differences along the discriminant axis were described using a wireframe graph. The statistical significance of pairwise differences in mean shapes was assessed with permutation tests using Mahalanobis distance as the test statistic (1000 permutations per test).
RESULTS
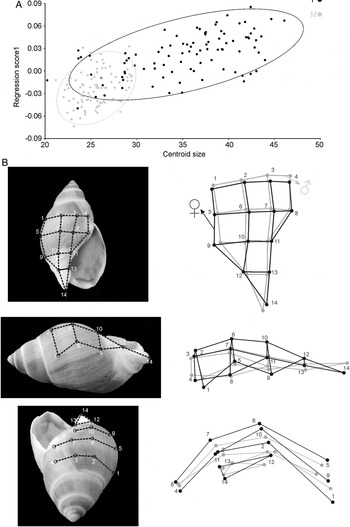
Total shell length ranged between 18 and 34 mm for males and between 22 and 49 mm for females. The relationship between callus shape and size was allometric. The multivariate regression of shape on centroid size was highly statistically significant (permutation test with 10 000 random permutations, P < 0.0001), and accounted for 6.9% of the total amount of shape variation (Figure 2).
Multivariate regression of shape onto size. (A) shape scores as a function of centroid size illustrating allometric growth of the male and female Buccinanops globulosus. (B) Shapes at the opposite extremes of the range of allometric variation are shown by using wireframe in different views (left). The wireframe (right) shows the overlap between the predicted landmark shift corresponding to an increase (black) and decrease (grey) of centroid size by 20 units from the starting mean shell shape. All wireframes and graphics were obtained with MorphoJ software.

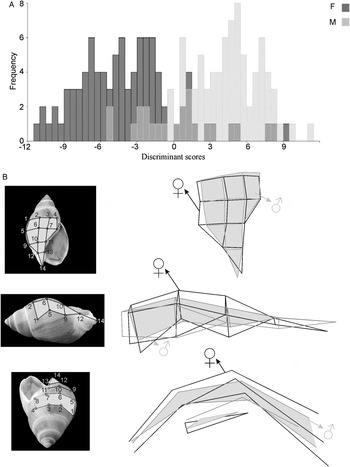
During growth, the main callus shape changes are related to the mean size increment, which is more evident in larger females. These zones were characteristically compressed dorso-ventrally and laterally in males and small females, which gives them a slender and elongated aspect. Meanwhile, large female shells were dorso-ventrally and laterally expanded, and antero-posteriorly compressed, so that the callus zone appeared more inflated. The shell shape variation showed that the males had a rapid change in shell shape while females showed a more gradual growth. The callus shape variation between sexes was successfully discriminated using DA. As there are only two groups, there is a single axis of form differences and scores are shown with histogram bars proportional to their frequency (Figure 3). In addition, the shape deformations depicted by the discriminant vector are shown in Figure 3 as wireframe of callus of B. globulosus. The mean callus forms of males were slender and more elongated than that of females. The Mahalanobis distances between sexes were highly statistically significant (permutation test with 1000 random permutations, P < 0.0001). The cross-validated classification showed that the accuracy of callus shape in predicting sexes was better than an 84% random chance.
Discriminant analysis of callus form differences between female and male. (A) Frequencies of the discriminant scores predicted by a jackknife (leave-one-out) cross-validation are shown using histogram bars. (B) 3D grid in different 2D view representations of the callus zone (left). Mean forms are visualized using 2D wireframe drawings magnified 3 times (right). Female (black vector) and male (grey vector) shaded polygons represent the part of the grid observed at each corresponding view. All wireframes and graphics were obtained with MorphoJ software.

DISCUSSION
Our results showed sexual differences in the callus zone form of B. globulosus. These differences are probably related to the capacity to attach the eggs capsule by females. The females of Buccinanops species spawn a large number of flexible egg capsules that are attached to their own shell (callus and adjacent zone) by short stalks (Penchaszadeh, Reference Penchaszadeh1971; Averbuj & Penchaszadeh, Reference Averbuj and Penchaszadeh2010). The number of egg capsules is not linearly related to female size, while a linear relationship was observed between the shell and capsule size (Averbuj & Penchaszadeh, Reference Averbuj and Penchaszadeh2010; Avaca et al., Reference Avaca, Narvarte and Martín2012; Averbuj et al., Reference Averbuj, Rocha and Zabala2014). As in other marine gastropods, a pedal gland situated in the anterior sole of the foot mould and attach the capsules to the shell (Voltzow, Reference Voltzow, Harrison and Kohn1994). The callus zone serves as the spawning substratum that may become restrictive to the spawn size and therefore represents a limitation to the female reproductive output. The females are rarely observed while spawning (buried), however it was recorded for B. cochlidium females that they make use of the flexible body to attach the capsules to the callus zone (Averbuj & Penchaszadeh, Reference Averbuj and Penchaszadeh2010). The siphonal channel of the females is directed upwards in a way that could facilitate moving of the pedal gland towards the spawning substratum (callus zone). This resembles the observations of Pastorino (Reference Pastorino2007) in Olivella plata from Patagonic waters, which possesses a groove that helps the females to glue the capsules to the shell. Complementarily, the globose shape of the callus zone of B. globulosus females, compared with male ones, expands the area available for spawning in the shell, allowing a larger spawn size.
The presence of allometry can account for a large and statistically significant proportion of morphological variation. We tested it by multivariate regression of callus shape onto size, and the relation between size and shape was detected (allometry) which indicates that the shape variations were dependent on the size variation (Figure 2). The main callus form variation was related to larger individuals (females). This variation was explained by the inflated shape of the anterior callus edge, broadening of the dorso-ventral axis and lateral expansion of the zone, together with an upper trend of the siphonal channel (Figure 2B, C). Avaca et al. (Reference Avaca, Narvarte and Martín2012) reported a size-assortative mating and size selectivity effect that appears to benefit females with a major reproductive output. These size effects may be cloaking a morphological reason focused in the callus zone and related to spawning. Previous studies on size at maturity of Buccinanops species generally analysed diverse parameters such as gametogenesis, reproductive (mating and spawning) organs development and mating behaviour, among others (Averbuj et al., Reference Averbuj, Bigatti and Penchaszadeh2010, Reference Averbuj, Rocha and Zabala2014); but shape changes in the shell are not included as relevant for the females to be able to spawn. However, field observations showed that individuals with mature gonads, copulatory organs and accessory reproductive glands may not carry egg capsules during the spawning season (Averbuj unpublished data); it is possible that morphological aspects of shell development influence females reproductive capacity. According to our results, the expansion of the callus zone of the shell with larger sizes represents an attribute that is probably linked to reproductive success.
A few marine gastropod species are known to be dimorphic in particular characters, with the overall shell size and structure usually being studied, or to a lesser extent the shell shape in 2D configuration (Arakawa & Hayashi, Reference Arakawa and Hayashi1972; HallerStjabbes, Reference HallerStjabbes1979; Ueno, Reference Ueno1997; Son & Hughes, Reference Son and Hughes2000; Pastorino, Reference Pastorino2007; Minton & Wang, Reference Minton and Wang2011). A work on shell shape variation undertaken by Avaca et al. (Reference Avaca, Narvarte, Martín and Van der Molen2013) reported that B. globulosus presents dimorphism in shell shape based on 2D geometric morphometrics (GM) analysis. The use of 2D GM in flat objects such as fly wings and some plant leaves allows us to capture the actual shape, but it fails to represent the shape of 3D anatomical features (Cardini, Reference Cardini2014). Therefore, the study by Avaca et al. (Reference Avaca, Narvarte, Martín and Van der Molen2013) did not describe sexual dimorphism in depth, nor did it relate it with reproduction. Taking the result of that study into account, we made a hypothesis focusing on the variation of a particular zone of the shell in relation with the known specific spawning modality of B. globulosus. Our study applied a 3D GM protocol designed to analyse surfaces without type I or II anatomical landmarks in order to characterize any sexual dimorphism. The use of 3D GM analysis allowed us to characterize, with high resolution, the dimorphism on the callus zone forms variations of B. globulosus. As expected, the callus zone of the females displayed subtle but clearly different forms from the male ones. These findings would not have been reached if we had not used the 3D GM protocol.
CONCLUSIONS
The current study has revealed that female shells are different from male ones (considering only mature individuals), and that those differences are significant on the callus zone where the egg capsules are spawned by the female. Larger individuals present more conspicuous differences. This finding suggests a relationship of the shell form with spawning.
The use of the 3D geometric morphometrics protocol allowed us to describe the callus shape sexual dimorphism in depth.
ACKNOWLEDGEMENTS
We are very grateful to Carolina A. Paschetta for helping with the 3D GM protocol. We are also grateful to two anonymous reviewers whose insightful advice and corrections helped to greatly improve the original manuscript. All research work including sampling and laboratory researches comply with Argentine current laws.
FINANCIAL SUPPORT
This work was partially supported by PICT 2012-078 (F.M.), PICT 2929 (A.A.) and PICT 1232 (A.A.).