


Introduction
Bioregenerative advanced life-support (ALS) systems have been proposed for human exploration missions to the Moon and Mars to regenerate oxygen, water and food (Tibbits & Alford Reference Tibbits and Alford1982; Ming & Henninger Reference Ming and Henninger1989; Eckart Reference Eckart1996; Wheeler et al. Reference Wheeler2003). Bioregenerative ALS systems are likely to reduce the ‘equivalent system mass’ (ESM) of a life-support system by reducing the initial launch mass and the long-term resupply of human habitats. The ESM of a space-based ALS system is defined as the summation of all of the components that go into the design, construction, launch and operation of a life-support system and may include the direct launch mass, the energy requirements of all subsystems, the personnel time required for maintenance and repair, and the operational constraints dictated by the systems (Drysdale et al. Reference Drysdale, Ewert and Hanford1999; Ewert et al. Reference Ewert, Drysdale, Hanford and Levri2001). One technology that would lower the ESM of a bioregenerative ALS system would be an automated remote sensing system that could monitor crops within the ALS plant-growth modules for productivity and disease outbreaks. Such an automated remote sensing system would greatly reduce astronaut time required for monitoring crop productivity.
Recently, several studies have proposed that a combination of spectral reflectance, leaf fluorescence and thermal imaging are likely to provide superior results in diagnosing plant stress within bioregenerative ALS systems (Woodhouse et al. Reference Woodhouse, Heeb, Berry, Hoshizaki and Wood1994; Omasa Reference Omasa, Tako, Shinohara, Komatsubara and Nitta2001; Norikane et al. Reference Norikane, Goto, Kurata and Takakura2003; Schuerger & Richards Reference Schuerger and Richards2006). However, we were unable to find any literature that explored the effects of canopy structure and imaging geometry on spectral reflectance measurements within simulated bioregenerative ALS systems. First, bioregenerative ALS systems will be highly compartmentalized with genetically modified crops to utilize as much volumetric space as is possible (Figs 1(a) and (b)). Thus, imaging whole canopies from nadir positions (i.e. directly above the canopies) will be very challenging; either a very high number of stationary cameras may be required, or extreme wide-angle lenses would need to be used, which produce images that are generally more difficult to interpret. Second, many diverse lighting systems will be employed within ALS systems (Olson et al. Reference Olson, Oleson and Slavin1988; Brown et al. Reference Brown, Schuerger and Sager1995; Schuerger & Brown Reference Schuerger and Brown1997; Wheeler & Martin-Brennan Reference Wheeler and Martin-Brennan2000) including high-pressure sodium lamps (Figs 1(a) and (b)), light-emitting diode (LED) arrays (Fig. 1(c)) or fluorescent systems (Figs 1(d)–(g)). The different lighting systems pose unique challenges to collecting useful remote sensing data, and few studies now exist that have characterized the effects of these lighting systems on remote sensing measurements. In a recent paper, Schuerger & Richards (Reference Schuerger and Richards2006) examined seven different artificial lighting systems for remote sensing measurements and found that although several types of lamp could be used for collecting useful spectral reflectance measurements, tungsten-halogen and LED lamps offer the most advantages over other types. Third, the background surfaces of growing trays in bioregenerative ALS systems will likely be highly reflective white or mirrored surfaces (Figs 1(d) and (e)) in order to redirect as much useful photosynthetic active radiation (PAR; 400–700 nm) back up and into the plant canopies. Thus, the reflectance signatures off of young and incompletely closed canopies will likely be very complex, and may not represent typical reflectance spectra from fully closed canopies. Fourth, the physical geometries of where to place the remote sensing cameras (Figs 1(f) and (g)) and the reflectance calibration targets (Fig. 1(g)) will be critical to properly interpret the remote sensing results. Fifth, and finally, the diversity of crop canopies (Fig. 1) used within a bioregenerative ALS system will likely require unique models for each plant species in order to optimize the remote sensing data acquired by the crop monitoring system.
Canopy structure and imaging geometries for bioregenerative ALS modules. (a) Simulated ALS module growing lettuce at the Kennedy Space Center, FL (circa 1995) (photo courtesy of NASA). (b) Simulated terrestrial ALS module growing lettuce at McMurdo Station, Antarctica (circa 1997) (photo courtesy of Phil Sadler). (c) Swiss chard growing under red and blue LED arrays within an ALS system at Kennedy Space Center, FL (circa 2003). (d) Radish canopy showing nutritionally stressed leaves with a white reflective surface below the crop canopy. (e) Healthy onion canopy exhibiting white reflective surface and complex canopy structure. (f) Strawberry canopies imaged by the 150-band VNIR 100E Hyperspectral Imaging system. Note the 45° off-nadir position of the imager and the complex nature of the strawberry canopy. (g) Onions, radish and lettuce grown in a multi-cropped ALS simulation at the Kennedy Space Center, FL; arrow points to a 99% Spectralon calibration target.

The current research is part of an ongoing effort to develop a fully automated remote sensing system for use within bioregenerative ALS modules intended for human exploration missions to the Moon or Mars. Previously, we have reported on the advantages and disadvantages of using different artificial lighting systems for the collection of spectral reflectance measurements of plant stress in ALS systems (Schuerger & Richards Reference Schuerger and Richards2006). The primary objectives of the current study were to evaluate the effects of canopy structure and imaging geometry on the efficiency of measuring plant stress using a simple band ratio (760/685 nm) and the normalized difference vegetation index (NDVI) algorithms (see Lillesand & Kiefer Reference Lillesand and Kiefer1994; Lichtenthaler Reference Lichtenthaler1996; Schowengerdt Reference Schowengerdt1997).
Materials and methods
Plant biometric procedures
The following plants were used in these experiments: (a) pepper (Capsicum annuum L., cv. ‘California Wonder’); (b) lettuce (Lactuca sativa L., cv. ‘Flandria’); and (c) tomato (Lycopersicon esculentum Mill., cv. ‘Early Girl’). Lettuce plants were started from seed, and tomato and pepper plants were started from seedlings purchased at a local nursery.
Plants were grown in a controlled environment chamber (model M-48, Environmental Growth Chambers, Chagrin Falls, OH, USA; see Fig. 2(a)). Plants were transplanted or seeded in silica sand and irrigated for one week with a complete nutrient solution (Schuerger & Mitchell Reference Schuerger and Mitchell1992) that contained the following elements: N (175 mg l−1), P (31), K (175), Ca (180), Mg (40), S (53), Fe (5), Mn (0.4), B (0.4), Zn (0.3), Cu (0.2) and Mo (0.005). Plants were illuminated with cool-white fluorescent lamps adjusted to deliver 350 μmol m−2 s−1 of PAR (400–700 nm) for 16 h per day. Temperature and relative humidity were controlled at 25(±2)°C and 70(±10)% RH, respectively. Carbon dioxide was elevated slightly by an automatic CO2 injection system within the M-48 plant growth chamber, and was maintained at 500 ppm throughout the experiments. Plants were grown six weeks prior to the initiation of remote sensing activities.
Experimental set-up used in the current study. (a) Tomato, lettuce and pepper plants grown under fluorescent illumination in a plant growth chamber. (b) Laboratory set-up used to capture nadir remote sensing measurements. The 150-band VNIR 100E Hyperspectral Imaging System was positioned at the nadir position above plant canopies, and the tungsten-halogen lamps were positioned 75 cm from crop canopies at 45° off-nadir. (c) Laboratory set-up for capturing the horizontal crop canopies. The 150-band hyperspectral imager and the tungsten-halogen lamps were positioned at 90° off-nadir and approximately 90 or 120 cm, respectively, from the crop canopies. (d) Tomato leaves were excised from healthy and symptomatic plants and laid out horizontally on a black cloth. The hyperspectral imager and lights were configured as in Fig. 2(b).

Plants were irrigated with the complete nutrient solution listed above for one week to promote the establishment of seedlings (pepper and tomato) or germination of seed (lettuce). Thereafter, individual plants were irrigated with nutrient solutions altered in one of four ways to induce a diversity of nutritional stress symptoms in the plants. The following treatments were applied to the tomato, pepper and lettuce plants for the remainder of the experiment: (i) control plants receiving the complete nutrient solution on all irrigations; (ii) zero Fe (iron) nutrient solution (NS); (iii) zero phosphorus (P) nutrient solution; and (iv) 20% of the control nutrient solution.
Remote sensing imager
The VNIR 100E Hyperspectral Imaging System was developed by the Institute for Technology Development (NASA Stennis Space Center, MS, USA). The VNIR 100E system incorporates a patented line scanning technique (Mao Reference Mao2000) that requires no relative movement between the target and the sensor. By scanning an input image within the focal plane of a front lens and dispersing an input image line vertically as a function of the spectral wavelengths, the hyperspectral focal plane scanner eliminates the requirement of a mobile platform in a pushbroom scanning system. The sensor uses a prism-grating optic to separate incoming light into component wavelengths with a high signal-to-noise ratio. Image data are recorded by a 12-bit CCD (charge coupled device) camera with a 1376×1040 pixel array. The variable binning capability of the camera allows image acquisition at user-specified spatial and spectral resolutions. Each output image contains a complete reflectance spectrum from 400 to 1000 nm.
Collection of hyperspectral remote sensing data
The hyperspectral measurements of plant canopies were conducted inside a darkened laboratory by transferring plants (as required) from the M-48 plant growth chamber to the laboratory. Two different set-up protocols were employed. First (Fig. 2(b)), two 125 W tungsten-halogen lamps were set up on light stands and were adjusted to be approximately 75 cm from the plant canopies. The lights were adjusted to give uniform illumination across the entire field of view of the remote sensing imager. The camera lens to plant canopy distance was also set at 75 cm. The camera was generally kept at the nadir position (i.e., directly above plant canopies) and the lights were adjusted to be approximately 45° off-nadir. A 99% Spectralon reflectance white target (Labsphere, Inc., North Sutton, NH, USA) was included in all images as a standard. Second, on a small set of plants, the sides of plant canopies were imaged (Fig. 2(c)). In this set-up, the plants and the remote sensing camera were placed at the same level with the plants oriented against a black cloth, and the lights near the camera and adjusted to be slightly off-centre. This second configuration was used to highlight the difficulties in collecting leaf remote sensing data from the sides of complex plant canopies. A 99% Spectralon target was also included in all of the horizontal measurements.
Plant canopies from lettuce and pepper plants were structured in a way to easily permit nadir and horizontal images to be collected using the geometrical set-ups depicted in Figs 2(b) and (c). However, tomato plants had highly elongated and complex canopies that could not be easily measured from either a nadir or horizontal orientation. Thus, individual leaves from healthy and symptomatic canopies (Fig. 2(d)) were excised from plants and arranged on a flat tray with a black cloth background. Thus, hyperspectral data could be collected of symptomatic tissues independent of the complex plant canopies that were exhibited by the tomato plants.
Image calibration
A series of pre-processing steps were applied to each raw hyperspectral image in order to set up the correct image orientation, minimize the image noise and calibrate illumination. The following pre-processing steps were programmed in HyperVisual® (a proprietary software from the Institute for Technology Development, Stennis Space Center, MS, USA) and executed in batch mode. The imaging sensor recorded only raw digital counts of reflectance; therefore, dark and reference scans were needed to convert the raw digital counts to percentage reflectance. For reflectance calibration, the following equation was used:

where Reflectance λ is the reflectance at wavelength λ, S λ is the sample intensity at wavelength λ, D λ is the dark intensity at wavelength λ and R λ is the reference intensity at wavelength λ.
The random noise removal step used a low-pass spectral filter. The low-pass filter had a window size of five and ran a moving average along the wavelength for each pixel. After pre-processing, the calibrated image cube had 150 bands (i.e., separate but aligned images) with wavelengths from 400 to 1000 nm. The resulting image cube of 688×525 pixels per band had a total file size of 825 MB.
Statistical analysis
Spectral reflectance images were analysed with the program MaxIm DL (Diffraction Limited, Nepean, ON, Canada). All images were first calibrated by normalizing the reflectance values of the 99% Spectralon target to 100. Images for NDVI and 760/685 were manipulated by hand and rechecked for consistency prior to processing data. Regions of interest (ROIs) were then drawn on the plant canopies at specific locations and the data were transferred to Excel spreadsheets. Statistical analyses were conducted with version 9.0 of the PC-based Statistical Analysis System (SAS) (SAS Institute, Inc., Cary, NC, USA). Regression models for Fig. 7 were generated with PROC REG (P⩽0.05).
Results
Plant biometric measurements of the pepper, lettuce and tomato canopies are given in Tables 1, 2 and 3, respectively. In all cases, the healthy control plants exhibited larger canopies with higher overall biomass and chlorophyll concentrations, as compared with the nutritionally stressed plants. Each plant species responded differently to the nutritional stresses. For example, Fe deficiencies induced more dramatic reductions in plant biomass and leaf chlorophyll levels in peppers than were observed in tomatoes; and zero P treatments induced the worst stunting in lettuce as compared with both peppers and tomatoes. The most sensitive plant biometric parameters to nutritional stress were found to be chlorophyll levels in leaves and canopy biomass (Tables 1–3).
Plant biometric data for pepper (Capsicum annuum L.)
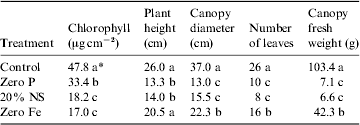
* Data were analysed with ANOVA and protected least-squares mean separation tests (P⩽0.05; n=2). Letters in columns indicate significant differences among treatments.
Plant biometric data for lettuce (Lactuca sativa, L.)
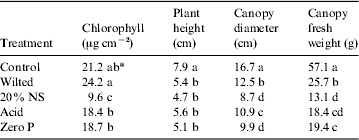
* Data were analysed with ANOVA and protected least-squares mean separation tests (P⩽0.05; n=3). Letters in columns indicate significant differences among treatments.
Plant biometric data for tomato (Lycopersicon esculentum, L.)
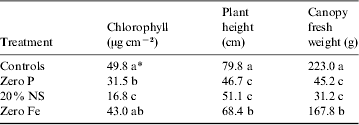
* Data were analysed with ANOVA and protected least-squares mean separation tests (P⩽0.05; n=2). Letters in columns indicate significant differences among treatments.
Canopy structure was examined to determine whether any particular geometrical approach to remote sensing of plants in ALS systems could be used for all plants tested. First, pepper canopies were examined with spectral reflectance measurements of (i) 760 nm band alone, (ii) NDVI images (NDVI=(760image – 685image)/(760image+685image)), and (iii) 760/685 nm band ratio images. Results indicated that large healthy canopies of peppers formed generally flat canopy tops with most leaves held in horizontal orientations (Figs 3 and 4). In contrast, lettuce canopies often had extensive gaps in the canopy structure (arrows; Fig. 5) caused by severe shading effects between leaves. Tomato canopies were very complex and difficult to image (Fig. 6(a)) because of the indeterminate growth characteristics of the commercial variety, Early Girl, used in these experiments. Of the three plants tested, pepper canopies were the easiest to image from the nadir position, and tomatoes were the most problematic.
Pepper canopies imaged with the hyperspectral remote sensing instrument. (a) Healthy pepper canopy imaged at 760 nm from the nadir position. (b) The same healthy pepper canopy depicted in (a), but imaged at 760 nm using the horizontal imaging position described in Fig. 2(c). (c) Nutritionally stressed pepper plant irrigated with only 20% of a complete nutrient solution.

A single pepper canopy imaged at 685 and 760 nm from a nadir position, and then presented as 760 nm alone, NDVI and 760/685 nm images. No understory cloth was used for images (a), (c) and (e); backgrounds were composed of silica sand and pot rims. In contrast, a black cloth was used as an understory background in (b), (d) and (f). Square box inserts are ROIs drawn for three leaves under all conditions; reflectance values for ROIs are presented in Table 4.

Compact lettuce canopies imaged from (a) the nadir and (b) the horizontal positions, and presented as 760/685 nm band ratio images. Plants were exposed to either 20% nutrient solution or a complete nutrient solution. Square boxes represent ROIs drawn for each view to determine the effects of imaging position on reflectance values. Arrows indicate shading artefacts observed for both the nadir and horizontal images.

High-resolution spectral scans for tomato leaves. (a) Complex and open structure of tomato canopies imaged at 760 nm. (b) Excised tomato leaves from (left-to-right orientation) healthy, zero Fe, zero P and 20% nutrient solution treatments imaged on a black cloth from a nadir position (RGB image). Numbers designate the ROIs drawn for the small areas from which the high-resolution spectral scans were obtained. (c) Plots of the high-resolution spectral scans of healthy (#1), chlorotic tissue due to a reduction in leaf chlorophyll level (#2), yellow/orange pigmented tissues most likely due to changes in carotenoids and xanthophylls in leaves (#3), orange pigmented tissues on severely stressed leaves (#4) and necrotic tissue on zero Fe treated leaves (#5).

Next, the effects of background materials were tested with pepper canopies of nutritionally stressed plants (Fig. 4). We compared the effects of using a white reflective surface (silica sand; Figs 4(a), (c) and (e)) and a black cloth (Figs 4(b), (d) and (f)) to the interpretation of spectral reflectance images with (i) 760 nm band, (ii) NDVI and (iii) 760/685 nm algorithms. First, the canopies of pepper plants irrigated with only the 20% nutrient solution exhibited shading artefacts on many leaves when imaged with the 760 nm band only (Figs 4(a) and (b); examine the leaf edges marked with boxes 1 and 2). The shading artefacts often disappeared when the canopies were imaged as NDVI (Figs 4(c) and (d)) or 760/685 nm ratios (Figs 4(e) and (f)). The frequency of shading artefacts observed for NDVI and 760/685 nm images were, in general, similar and of low frequency. When using the highly reflective silica sand as a background, the pepper canopies were often blurred with the background (Fig. 4(a)). This artefact was greatly reduced when a black cloth was placed over the highly reflective silica sand prior to imaging the canopies (Fig. 4(b)). However, when the NDVI and 760/685 nm images were generated with and without the black cloth as a background, the canopies exhibited several striking differences as compared with the images at 760 nm alone. The two most important observations were that (a) the NDVI and 760/685 nm images of pepper without the black cloth as a background exhibited the cleanest signatures of the canopies, and the backgrounds were muted (Figs 4(c) and (e)); and (b) the black cloth actually enhanced the severity and the quantity of artefacts in the scene for NDVI (Fig. 4(d)) but not 760/685 nm (Fig. 4(f)) images.
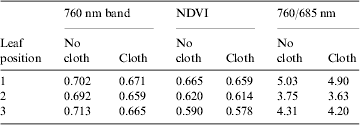
The boxes labelled 1, 2 and 3 in Fig. 4(a) were used to compare remote sensing results from images of the (i) 760 nm band, (ii) NDVI and (iii) 760/685 nm algorithms. Data are given in Table 4, and show that although some variability was noted when the black cloth was used in the 760 nm images, the differences with and without the black cloth were greatly reduced in the NDVI and 760/685 nm images. While the use of the black cloth often decreased the infrared reflectance of the plant canopies by 5–7%; the differences between the cloth and no-cloth images of the NDVI and 760/685 nm reflectance values were well within the errors of acquiring data by designating the ROIs drawn on leaves. Thus, it seems apparent that the use of highly reflective backgrounds may not overtly degrade the remote sensing images of plant canopies, as was initially expected.
Lettuce canopies were the most compact of the three species tested, but these canopies exhibited two significant types of artefact, as compared with pepper canopies. First, the overall canopy reflectance values for both NDVI (data not shown) and 760/685 nm images (Fig. 5) indicated that the horizontal views were, in general, 12–15% brighter than the images collected in the nadir positions (shading artefacts were not measured in this comparison). This was observed for both healthy and nutritionally stressed (Fig. 5) plants. Thus, in the tight quarters typically encountered in bioregenerative ALS systems (Fig. 1), difficulties might be encountered when comparing images collected from nadir and horizontal positions. Second, shading artefacts in the NDVI (not shown) and the 760/685 nm (arrows; Fig. 5) images occurred, and if not removed by either hand or automatic processing of the images, would likely bias the overall reflectance averages of the canopies. For example, when the shading artefacts in the control canopies (red arrows; Figs 5(a) and (b)) are included in the overall averages of the spectral reflectance values of the canopy (ROI boxes in red; Figs 5(a) and (b)), the reflectance values of this canopy are depressed by approximately 15%.
Tomato canopies were the most difficult to image (Fig. 6(a)) because the cultivar was an indeterminate variety that exhibited strong lateral shoot development. Thus, individual leaves were excised from healthy and nutritionally stressed plants to directly compare the reflectance spectra from a diversity of symptomatic tissues (Fig. 6(b)). Leaves were imaged from healthy control, zero Fe, zero P and 20% nutrient solution plants. Unique signatures were observed for several diverse symptoms that suggest that some diagnostic interpretations might be possible within a bioregenerative ALS system if adequate characterization and calibration studies can be completed before launch. For example, in the high-resolution spectra (Fig. 6(c)) derived from plotting the numbered ROIs (Fig. 6(b)), unique spectra were observed for healthy (plot #1), chlorotic (plot #2), yellow/orange (plot #3), orange (plot #4) and necrotic (plot #5) tissues. Changes can be observed in the yellow (500 nm), green (550 nm), red (685 nm) and NIR (700–725 nm) regions. Reflectance values generally (i) increased in all tissues in which chlorophyll was lost, but not yet dead (from 475 to 700 nm), (ii) changed to a nearly straight line rise in reflectance from 525 to 725 nm for necrotic tissues and (iii) the red-edge from 685 to 725 nm (i.e., the NIR rise in reflectance) shifted to shorter wavelengths. Necrotic tissues exhibited a unique spectral shape that was lacking a chlorophyll absorption band at 685 nm (Fig. 5(c)). Furthermore, the production of carotenoids and xanthophylls that produced the yellow/orange and orange colorations in severely stressed leaves irrigated with 20% nutrient solution (Fig. 5(b)) had different spectral features (Fig. 5(c)) compared with a simple loss of chlorophyll noted in the zero Fe treated leaves.
The remote sensing imager used in these studies collected 150 images over the range from 400 to 1000 nm, with each uncompressed image being 5.5 MB. Images from 440, 550 and 685 nm were used to generate the RGB images depicted in many of the figures, and images from the 685 and 760 nm bands were used to generate the NDVI or 760/685 nm images. Thus, although each plant was imaged at 150 separate bands, most images were not used when generating visual maps of plant stress. For example, the RGB image of nutritional stressed tomato leaves (Fig. 7(a)) was generated first in order to visually evaluate the diverse symptoms on the healthy and nutritionally stressed leaves. Then the NDVI and 760/685 nm images were generated. These three unique views (Fig. 7) only required images from three of the 150 bands in the image cube, thus reducing the bandwidth to only 2% of what would be required to download the entire image cube.
When comparing the NDVI and the 760/685 nm images, two advantages of the 760/685 nm images were observed. First, shading effects of curved leaves on the black cloth were noted for NDVI (arrows; Fig. 7(b)), but not 760/685 nm images (Fig. 7(c)). These shading artefacts decreased the quality of the NDVI image rendering it slightly more difficult to determine which part of the image was stressed tissue and what part of the image was background. Second, the dynamic range of the reflectance values between healthy and stressed leaves for the 760/685 nm image (Fig. 7(c)) was significantly larger than the dynamic range of the NDVI image (Fig. 7(b); see also Fig. 8). Although, the 760/685 nm image proved to be slightly better in indicating plant stress than the NDVI image, no additional bandwidth would have been required to produce both images because the NDVI and 760/685 nm images used only two bands to generate the algorithmic images.
Manufactured images of excised tomato leaves from 440, 685 and 760 nm bands collected with the 150-band VNIR 100E Hyperspectral Imaging System. (a) A RGB colour-composite image depicting tomato leaves from (left-to-right orientation) healthy, zero Fe, zero P and 20% nutrient solution imaged on a black cloth from a nadir position. (b) The same scene as above, but presented as an NDVI image. Note the significant levels of shading artefacts (arrows) at leaf margins. (c) The same scene as above, but presented as a 760/685 nm band ratio image. Note the dramatic reductions in the shading artefacts, and the increased dynamic range of the reflectance values between the healthy and the severely stressed leaves irrigated with a 20% nutrient solution.

Linear models derived from measuring the reflectance values of lettuce, pepper and tomato plants from NDVI ((a), (c), (e) and (g)) and 760/685 nm ((b), (d), (f) and (h)) images. The boxes represent the healthy control plants for each plant species and image type. Note that when all data are merged for either the (g) NDVI or (h) 760/685 nm images, the ‘healthy’ control plants for lettuce are positioned in the middle of the overall model. Thus, it is unlikely that a single overall model that compares leaf chlorophyll concentrations to remote sensing algorithms such as NDVI or 760/685 nm will be useable for all ALS crops. The unique qualities of each plant species will likely require unique models.

A quantitative comparison was made between NDVI and 760/685 nm images to determine which algorithmic image would be the most useful in detecting plant stress (Fig. 8). Results indicated that the 760/685 nm models were superior to the NDVI models in two essential ways. First, the slopes of the linear models were always greater for 760/685 nm images, as compared with the NDVI images. As slope values increase, the sensitivity of a linear model increases because slight changes in chlorophyll concentrations can yield more easily interpreted changes in the spectral reflectance values. Second, in general, there was a slight increase in the r 2 values for the 760/685 nm data, thus indicating a slight reduction in the variability of the data.
Finally, we sought to determine whether either the NDVI or 760/685 nm images could be combined into an overall model of plant stress for the three plant species tested, or whether each plant species must be treated separately (Fig. 8). The linear models for the NDVI and 760/685 nm images for each plant species were plotted separately (Figs 8(a)–(f)), and then all data were combined into single models for all three crops (Figs 8(g) and (h)). The boxes drawn around individual data points in Fig. 8 represent the healthy control plants for each species for each algorithm. When individual species were modelled separately, the healthy control plants always appeared at the far right of the data sets and represented high chlorophyll concentrations matched to bright reflectance values (Figs 8(a)–(f)). In contrast, when all data were pooled (Figs 8(g) and (h)), the healthy control plants for lettuce were in the middle of the range. The healthy control plants for both tomato and pepper tended to overlap at the far right-hand side of the models. This effect is caused by the generally lower chlorophyll concentrations in healthy lettuce leaves, as compared with healthy tomato and pepper plants. Thus, it appears that individual remote sensing models will have to be developed for each plant species because healthy control plants might not be similar in their chlorophyll, carotenoid or xanthophyll concentrations.
Discussion
Future bioregenerative ALS systems will be selected based on their production efficiencies, functional robustness and competitive ESM ratings. In all three categories, an automatic remote sensing system would contribute to the efficient operation of a future space-based ALS system. First, an automated remote sensing system would contribute to the monitoring of plant health within the ALS modules. Remote sensing would be one of several technologies used to monitor crop production, including both modelling of crop growth yield under nominal conditions, and monitoring of crop canopies for biological and abiological problems. Second, as a bioregenerative ALS system is operated over time, the dynamics of the robustness of various subsystems and components of the ALS system could be tracked by how these changes affect plant health. Third, an automated remote sensing system would effectively lower the ESM of a space-based ALS module by reducing the time required for direct human monitoring of the plants. In all three cases, automation is the key. However, before the design of such an automated remote sensing system can be developed for bioregenerative ALS systems, several key questions must be answered. Unfortunately, only a few reports have appeared in the literature that investigate how an automated remote sensing system might be designed for space-based ALS systems (Woodhouse et al. Reference Woodhouse, Heeb, Berry, Hoshizaki and Wood1994; Omasa Reference Omasa, Tako, Shinohara, Komatsubara and Nitta2001; Norikane et al. Reference Norikane, Goto, Kurata and Takakura2003; Schuerger & Richards Reference Schuerger and Richards2006).
The primary objective of the current study was to examine the effects of canopy structure and imaging geometry on spectral reflectance measurements within simulated ALS crops. A key goal was to determine whether the cramped quarters of an ALS module might place significant limitations on the utility of spectral reflectance imaging and preclude the use of some common algorithms. Results generally indicated that spectral reflectance could provide extremely useful information on the health of plant canopies in ALS systems with some constraints likely on the orientation of the imaging systems relative to crop canopies.
First, true nadir imaging of plant canopies seems unlikely within ALS systems because crops will be engineered for optimum productivity with a minimum use of volumetric space (Tibbits & Alford Reference Tibbits and Alford1982; Olsen et al. Reference Olson, Oleson and Slavin1988; Ming & Henninger Reference Ming and Henninger1989; Wheeler & Martin-Brennan Reference Wheeler and Martin-Brennan2000). A review of the images of several ALS crops in Figs 1(a), (b) and (c) clearly demonstrates that many crops will have minimum headspaces between the tops of plant canopies and the illumination sources. The LED arrays depicted in Fig. 1(c) are of particular interest because LED lighting systems produce very small heat signatures (Brown et al. Reference Brown, Schuerger and Sager1995; Schuerger & Richards Reference Schuerger and Richards2006) and, thus, can be lowered to close proximity to plant canopies. This would greatly enhance photosynthesis without adding undue heating constraints on plant leaves. However, with such an approach, nadir imaging of crop canopies is almost impossible. Use of high numbers of CCD cameras to capture nadir images in cramped quarters does not seem to be an acceptable solution because the high numbers of cameras would increase the ESM of a plant habitat and increase the bandwidth required to download large numbers of images. Therefore, the imaging of LED illuminated plants might require remote sensing instruments to be located in off-nadir or horizontal positions. However, the canopy structure would then become important. Compact crop canopies such as lettuce (Figs 1(a), (b) and 5), chard (Fig. 1(c)) and pepper (Fig. 3) are likely to be relatively easy to image from off-nadir positions. However, open canopies such as onion (Fig. 1(e)), radish (Fig. 1(d)), tomato (Fig. 6(a)) and wheat (not shown) are likely to be problematic.
Second, the bandwidth available for downloading large digital files may become a limitation if high numbers of high-resolution digital images are collected. For example, the camera used in these experiments was capable of collecting 150 images (5.5 MB each) from bands spread from 400 to 1000 nm for a total size of 825 MB per image cube. When properly calibrated and aligned, the image cubes were used to produce the high-resolution spectra depicted in Fig. 6(c) by selecting specific ROIs shown in Fig. 6(b). High-resolution spectra of healthy and stressed tissues offer unique views into the diversity of symptoms caused by specific stressing agents. However, 150 5.5 MB images are likely to cause serious problems in downloading data from remote sites such as bioregenerative ALS modules on the Moon or Mars. Although data-compression algorithms can significantly reduce the total size of these files, it seems unlikely that even large compressed files of tens of megabytes each will be easily downloaded when bandwidth is limited. In addition, consider that for a full-scale bioregenerative ALS system in which hundreds of square metres of crops are grown (see Fig. 1(a)), dozens of remote sensing images are likely to be required to properly monitor all of the plant canopies on a daily basis.
Third, in contrast, high-resolution spectra of ROI-selected scenes offer significant amounts of data that could be used to diagnose particular plant stresses. In the current study using only a spectral reflectance imager, unique spectral features were observed for healthy leaves, chlorophyll-loss induced chlorosis, carotenoid/xanthophyll induced changes in the colouration of leaves and necrotic tissues (Fig. 6(c)). So even though there are questions on how to handle high data flows when bandwidth for downloading large images is limited, there is a distinct advantage in using remote sensing imagers that are capable of producing the high-resolution spectra depicted in Fig. 6(c). Thus, we propose that high-resolution imaging systems have significant advantages over two or three band multi-spectral imagers and should be used within bioregenerative ALS systems. Problems with bandwidth can be handled by imaging crop canopies with only a few bands during routine daily monitoring, and then high-resolution full spectral scans can be requested if additional data is required when a problem is detected. Several recent studies (Omasa Reference Omasa, Tako, Shinohara, Komatsubara and Nitta2001; Norikane et al. Reference Norikane, Goto, Kurata and Takakura2003; Schuerger et al. Reference Schuerger, Capelle, De Benedetto, Mao, Thai, Evans, Richards, Blank and Stryjewski2003) have demonstrated that multiple remote sensing technologies applied together offer a great advantage over a single instrument when trying to diagnose plant stress problems.
Fourth, background surfaces in ALS crop production units will be selected for optimum reflectivity to enhance the photon flux that contributes to photosynthesis (Figs 1(d), (e) and (g)). Originally we hypothesized that the white reflective surfaces would interfere in generating NDVI and 760/685 nm band-ratio images depicted in Figs 4, 5 and 7. However, our results support the rejection of this hypothesis, and the conclusion that bright backgrounds may actually decrease shading artefacts and enhance edge resolution. Thus, although we did not try to optimize the background material for optimum reflectivity for plant photosynthesis, and for minimum constraints on spectral reflectance measurements, we believe that this problem is easily solvable.
Fifth, shading artefacts did pose a significant challenge for easily interpreting the spectral reflectance 760 nm alone, NDVI and 760/685 nm images. In all cases, the shading artefacts seemed significantly more pronounced in the 760 nm alone and NDVI images, and were either lacking or greatly suppressed in the 760/685 nm images. In addition, the 760/685 nm images exhibited a greater dynamic range in reflectance values compared with the NDVI images. Thus, there may be unique spectral reflectance images that will greatly suppress artefacts of the canopy structure, background materials and lighting effects.
Sixth, and finally, the NDVI and 760/685 nm images yielded data that were used to estimate linear models for determining correlations between nutritionally stressed canopies and reductions in leaf chlorophyll levels (Fig. 8). Although results were very consistent with published reports on spectral reflectance of greenhouse grown plants (Schuerger et al. Reference Schuerger, Capelle, De Benedetto, Mao, Thai, Evans, Richards, Blank and Stryjewski2003), crops grown in simulated ALS systems (Omasa Reference Omasa, Tako, Shinohara, Komatsubara and Nitta2001; Schuerger & Richards Reference Schuerger and Richards2006) and traditional agricultural ecosystems (Lillesand & Kiefer Reference Lillesand and Kiefer1994; Lichtenthaler Reference Lichtenthaler1996; Schowengerdt Reference Schowengerdt1997), the results indicated that unique remote sensing models are likely to be required for individual plant species because the ranges of normal chlorophyll levels in healthy leaves differed significantly among the three plant species tested, and, thus, one model would not be precise enough to yield clear information on a diversity of crops. For example, (i) the healthy lettuce canopies fell within the range of nutritionally stressed tomato and pepper leaves and (ii) slope values for the models between healthy and stressed plants were all different among tomato, pepper and lettuce plants. Thus, the best way to predict the health of any plant species would be to rely on a unique model for each crop that correlates a remote sensing algorithm to specific levels of stress in each species. Combining the responses into one overall model clearly obscured the interpretations of which individual plants were stressed and which were healthy.
Based on the results presented here and from data published on the remote sensing of other ALS crops (Omasa Reference Omasa, Tako, Shinohara, Komatsubara and Nitta2001; Schuerger & Richards Reference Schuerger and Richards2006), it seems reasonable to predict that spectral reflectance approaches to monitoring crop health in bioregenerative life-support systems will be possible, regardless of the lighting system used or the plant species grown. The few constraints and potential problem areas discussed above seem solvable. In addition, although we limited our studies to the testing of spectral reflectance measurements of simulated ALS crop canopies, other technologies (e.g., leaf fluorescence, thermal imaging) will likely add significant information to an overall automated ALS remote sensing system. Based on the results presented herein, we propose that an automated remote sensing system for ALS applications should be developed that would utilize a high-resolution hyperspectral imaging system in which routine images were constrained to perhaps a few bands to generate key images for general monitoring of ALS crops, but would then be available for high-resolution hyperspectral imaging of scenes if problems were detected.
The results presented here were part of an ongoing project to develop an automated remote sensing system for monitoring crop health within bioregenerative ALS modules. Such a system is essential for space-based ALS units in order to reduce the ESM of the life-support system to acceptable levels. By using an automated remote sensing system, astronauts and mission controllers are likely to minimize the time required for direct human monitoring of the biological components within the ALS modules. Such an automated remote sensing system would combine various instruments, heuristic computer algorithms, environmental sensors and periodic human intervention to deliver optimum crop productivity within the space-based bioregenerative ALS system.
Acknowledgements
The research was supported by two NASA grants from Marshall Flight Center (#NNM06AA02A; entitled ‘Hyperspectral Imaging’) and Stennis Space Center (#NNS05AB56A; entitled ‘Hyperspectral Fluorescence and Reflective Based Imaging’). The authors would also like to thank Dr Robert Ryan from Science Systems & Applications, Inc. (Stennis Space Center) for technical assistance.



