Introduction
In order to understand current and changing patterns of population health, particularly in the developing world, there is a clear need for high-quality health indicators. Several types of health status measures have emerged to fill this need, some costly and labour-intensive (such as physical examinations or biomarkers) and some inexpensive and straightforward (such as self-report and objective health indicators). Of the health status measures, global self-rated health is a simple survey instrument that can be constructed from individuals' answers to a question such as, ‘In general, would you say that your health is excellent, very good, good, fair, or poor?’ There is a great interest in determining the validity of this question as an indicator of health status.
Based on the Manitoba Longitudinal Study on Aging, Mossey & Shapiro (Reference Mossey and Shapiro1982) reported for the first time that self-rated health predicted survival independently of objective health status indicators. Subsequently, several studies from developed countries (Kaplan & Camacho, Reference Kaplan and Camacho1990; Wolinsky & Johnson, Reference Wolinsky and Johnson1992; Idler & Kasl, Reference Idler and Kasl1995; Borawski et al., Reference Borawski, Kinney and Kahana1996; Idler & Benyamini, Reference Idler and Benyamini1997; Yu et al., Reference Yu, Kean, Slymen, Liu, Zhang and Katzman1998) have demonstrated that self-rated health is a good predictor of mortality and functional ability, even after controlling for other objective health measurements. Several studies in developed countries show sex differences in the association between self-rated health and mortality, with a stronger association for men than for women (MacCallum, et al., Reference MacCallum, Shadbolt and Wang1994; Bath, Reference Bath2003; Benyamini et al., Reference Benyamini, Bulmstein, Lusky and Modan2003).
It has been argued that the relationship between self-rated health and subsequent mortality may be weaker in developing countries than developed countries because of differences in levels of economic development and disease patterns (Frankenberg & Jones, Reference Frankenberg and Jones2004; Kuhn et al., Reference Kuhn, Rahman, Menken, Cohen and Menken2006). In fact, studies of the relationship of self-rated health with functional ability or mortality have been extremely limited in developing countries. However, the studies that do exist have documented a strong relationship between self-rated health and physical functioning (Wu & Rudkin, Reference Wu and Rudkin2000; Zimmer et al., Reference Zimmer, Natividad, Lin and Chayovan2000) and subsequent mortality (Yu et al., Reference Yu, Kean, Slymen, Liu, Zhang and Katzman1998; Kuhn et al., Reference Kuhn, Rahman, Menken, Cohen and Menken2006). The benefits of cross-national studies of ageing to understand the demographic and epidemiological transitions have been widely recognized (National Research Council, 2001; Banks et al., Reference Banks, Marmot, Oldfield and Smith2006). The United States Health and Retirement Study, and other surveys such as the English Longitudinal Study on Ageing, have provided the necessary evidence to address the needs of older persons in higher income countries. Yet, the majority of older persons now and into the future will reside in lower income countries where the evidence base is very limited. The World Health Organization Study on Global AGEing and Adult Health (SAGE) survey platform and the International Network for the Demographic Evaluation of Populations and Their Health in developing countries (INDEPTH) have generated data from eight countries and provided a valuable data collection platform for cross-national comparisons of ageing. The health indicators derived from this survey are self-rated health, overall health state, quality of life and disability level.
The major objective of this study is to examine the association of each of these four health indicators collected in 2007 with mortality over a 2-year follow-up period using a population-based random sample of individuals aged 50 years or more in the Matlab Health and Demographic Surveillance System of the International Centre for Diarrhoeal Disease Research, Bangladesh (icddr,b).
Methods
Setting
Data for this study come from Matlab Upazila (sub-district) where the icddr,b has maintained a field station since 1963. Matlab is a rural area located about 55 km south-east of Dhaka. In the past major modes of transport within the area were walking, country boat and in some cases small steamer or launch; however, in recent years most of the villages have been accessible by road. Farming is the dominant occupation, except in a few villages where fishing is the means of livelihood (Van Ginneken et al., Reference Van Ginneken, Bairagi, Francisco de, Sarder and Vaughan1998). Most of the farmers are in marginal situations with fewer than 2 acres of land, and 40% of them are landless. Some people also work in mills and factories in other areas while their families remain in the study area. Women are largely restricted to activities in the home, with little opportunity to venture outside the home, although these restrictions have eased in recent years. Rates of illiteracy are high, particularly among the elderly.
Since 1966 the icddr,b has maintained a Health and Demographic Surveillance System (HDSS) in the Matlab area covering about 225,000 people. The surveillance system collects data on births, deaths, migrations, marriages, divorces and household divisions (Razzaque & Streatfield, Reference Razzaque, Streatfield and Sankoh2002). These data are collected during regular household visits (every 2 weeks until 1997, every month between 1998 and 2006, and every 2 months since then) by trained Community Health Research Workers (CHRWs). In addition, cross-sectional socioeconomic data were collected in 1974, 1982, 1996 and 2005.
Since October 1977 half of the surveillance area has been exposed to Maternal Child Health and Family Planning (MCH-FP) services while the other half is a comparison/government service area. These services are targeted mainly at the mother and child, except services for diarrhoeal diseases. In Matlab the government runs a 31-bed free general hospital with nine doctors (Upazila Health Complex) along with several Family Welfare Centres, each with a Sub-assistant Community Medical Officer and a Family Welfare Visitor; however, such services are less intensive than the service of the icddr,b area. Except those of Upazila Health Complex, all other services are targeted at maternal and child health. Moreover, there are private practitioners, private clinics and traditional practitioners across the country.
Sample
The SAGE and INDEPTH surveys collected data in eight countries in Asia and Africa. The present study includes surveillance data from Matlab HDSS and data collected in 2007 as a part of the SAGE–INDEPTH study. For the survey, questionnaires developed by WHO were piloted in the field after translation into local languages. Out of 31,400 people 50 years or older, 4300 were selected randomly from the HDSS database of those living in the icddr.b service area (half of the HDSS area). The area of residence was restricted to minimize travel time needed to visit the sample households for the survey.
The survey was conducted by a team of female college graduates with data collection experience. Interviewers received extensive training on data collection, particularly around sensitive topics and the data collection tools. The interview was conducted at the respondent's residence in a face-to-face interview. Out of 4300 people 50 years or older, 4037 (2016 males and 2021 females) were successfully interviewed. As a quality check, about 1% of participants were re-interviewed by an independent fieldworker/supervisor and feedback was incorporated accordingly.
Outcome variable
Each SAGE-2007 survey participant was subsequently followed for death or out-migration using HDSS records until December 2009. The outcome of the study was mortality between the SAGE-2007 survey and end of the follow-up period until 31st December 2009.
Independent variables
Four health indicators were derived from the SAGE-2007 survey:
Self-rated health
Self-rated health employed a Likert-type response scale with five categories. The participant was asked ‘In general, how would you rate your health today? Would you say very good, good, moderate, bad or very bad?’ Studies documented that the global self-rated health question is a good predictor of many health and health-related outcomes (Frankenberg & Jones, Reference Frankenberg and Jones2004; Bardage et al., Reference Bardage, Saskia, Pluijm, Pedersen, Deeg and Jylha2005).
Health state
The WHO health state score (WHOHSS) was calculated based on self-reported health in eight domains, covering affect (feeling), cognition, interpersonal activities/relationships, mobility, pain, self-care, sleep/energy and vision. Each domain included at least two questions to provide more robust assessment of individual health and to reduce measurement error for any single self-reported item. Item response theory was used to generate a composite health score using a partial credit model (Andrich, Reference Andrich2004; Wilson et al., Reference Wilson, Allen and Li2006). Each item was taken into account and the raw scores were transformed through Rasch modelling into a continuous scale where a score of 0 represents worst health and 100 represents best health.
Quality of life
An eight-item version of the WHO quality of life instrument (WHOQOL) was used to assess perceived well-being (Schmidt et al., Reference Schmidt, Muhlan and Power2006). This is a cross-culturally valid instrument for comprehensively assessing overall subjective well-being. Results from the eight items were summed to get an overall quality score, which was then transformed to a 0–100 scale, similar to the health state score.
Disability
Self-functioning was assessed using the standard twelve-item WHO disability assessment scale (WHODAS), Version 2 (World Health Organization, 2009). It is a well-tested instrument, with published psychometric properties and a good predictor of global disability (O'Donovan & Doyle, Reference O'Donovan and Doyle2007; Sousa et al., Reference Sousa, Dewey, Acosta, Jotheeswaran, CastroCosta and Ferri2010; Luciano et al., Reference Luciano, Ayuso-Mateos, Fernandez, Serrano-Blanco, Roca and Haro2010). This instrument also provides an assessment of severity of disability (World Health Organization, 2001). Results from the twelve items were summed to get an overall disability score, which was then transformed to a 0–100 scale, with 0 as no disability and 100 maximum disability. However, for the purposes of this analysis, the scores were converted, i.e. 0 represents worst disability and 100 represents best functioning.
To measure the relationship between health indicators and mortality, all four health indicators were converted into three categories. Self-rated health was grouped as very good/good, moderate and bad/very bad. For each of the WHO measures, the population tertiles were used to reflect these categories. For WHOHSS, bad/very bad ranged from 0 to 55.22, moderate from 55.23 to 63.10 and very good/good from 63.11 to 100. For WHOQOL, the ranges were 0 to 96.89 (bad/very bad), 97.00 to 97.51 (moderate) and 97.62 to 100 (very good/good). The ranges for the WHODAS score were 0 to 55.57 (bad/very bad), 58.33 to 77.78 (moderate) and 80.55 to 100 (very good/good).
Covariates
Age was categorized into four groups: 50–59, 60–69, 70–79 and 80 years or older. Sex was categorized as male or female. Educational level was categorized into three using completed years of schooling: no schooling, 1–5 years and 6 years or more. Marital status had two categories: now single, or currently married. The proportion of household members over 50 years of age was categorized into four levels: <0.25, 0.25–0.49, 0.50–0.74 and 0.75 or more. These variables were drawn from the HDSS database. Household asset index was based on the 2005 cross-sectional socioeconomic survey. This index was calculated using the number of consumer items (radio, watch, etc.), dwelling characteristics (wall and roof material), type of drinking water and toilet facilities in the household (Razzaque et al., Reference Razzaque, Streatfield and Gwatkin2007). In this study the asset index was categorized into quintiles of the 2005 population, with 1st quintile as poorest and 5th quintile as richest.
Correlation between health indicators
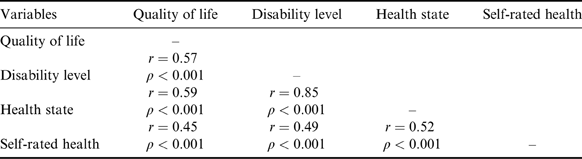
To measure the correlation between health indicators, self-rated health was categorized as very bad=1, bad=2, moderate=3, good=4 and very good=5, while for the three other health indicators (health state, quality of life, disability level) scores were used; t-tests (2-tailed) were performed for significance level.
Analyses
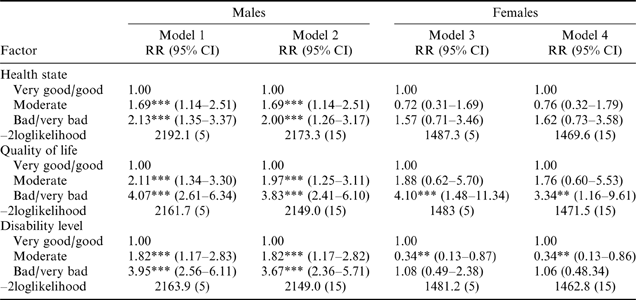
For bivariate analyses, rates and ratios were calculated. All analyses were stratified by sex because of the significant difference between men and women in the distribution of the health indicators. For multivariate analyses, Cox proportional hazard regression was applied with survival time as the dependent variable. All other variables were treated as categorical. In Tables 4 and 5, Model 1 (men) and Model 3 (women) show the association of the four health indicators with mortality, adjusted for age. Model 2 (men) and Model 4 (women) show the association of the health indicators with mortality when age and socioeconomic variables are added to the model.
Results
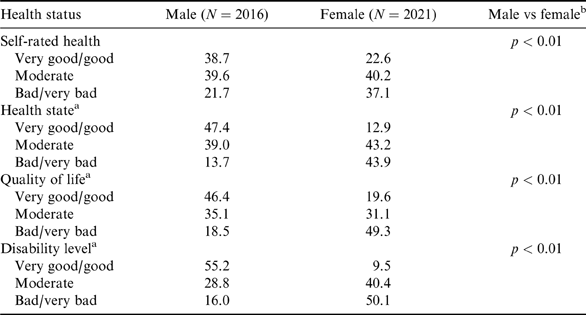
Table 1 shows the distribution of respondents for each of the health indicators by sex. The distribution of each health indicator varies significantly by sex. For self-rated health, more men reported good health than bad health (38.7% vs 27.7%), while for women the distribution was reversed (22.6% good vs 37.1% bad). The same pattern was seen in each of the WHO measures as well. For the health state score, 47.4% of men reported good health vs 13.7% reporting bad health, while for women 12.9% reported good health vs 43.9% reporting bad health. Men reported higher quality of life (46.4% good vs 18.5% bad), while women reported the reverse (19.6% good vs 49.3% bad). Finally, more men had good physical function than bad (55.2% good vs 16.0% bad), whereas women reported the reverse (50.1% bad vs 9.5% good).
Distribution of respondents aged 50 years and over (%) by health status and sex, Bangladesh

a For each of the WHO measures, population tertiles were used to reflect the category.
b Based on chi-squared test.
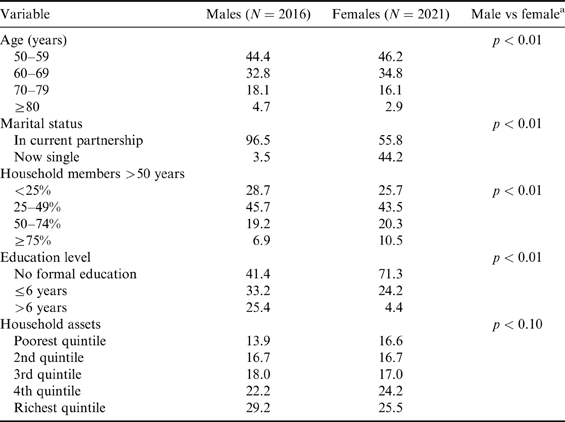
Table 2 shows the distribution of respondents according to socio-demographic variables and sex. The distributions by socio-demographic variables vary significantly by sex (p<0.01), except for household asset index, which is marginally significant (p<0.10). For both sexes about 45% were aged 50–59, with 5% of men and 3% of women being aged 80 or over. Marital status differs considerably for men and women: 95% of men were married compared with 55% of women. About 29% of men lived in households where less than a quarter of members were over the age of 50, with 26% of women in a similarly aged household. Education level varies considerably by sex: about 41% of men vs more than 70% of women had no schooling. The household asset index also varies by sex (p<0.10): 29% of men vs 25% of women were in the top quintile.
Distribution of respondents aged 50 years and over (%) by socio-demographic variables and sex, Bangladesh
a Based on chi-squared test.
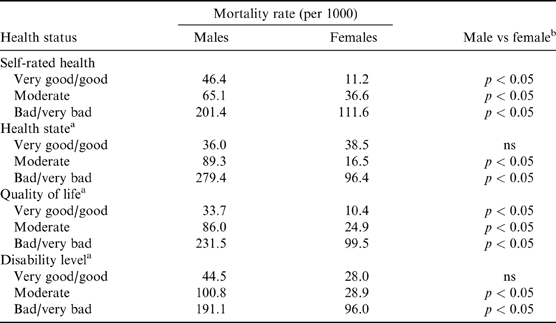
Table 3 shows mortality rates for each of the health indicators by sex. For all health measures, mortality rates are usually significantly higher for men than for women except for the very good/good category of health state and disability level. The mortality rate for men is about 80 per 1000 population compared with about 50 per 1000 population for women. Among both men and women, survival is at high level for those reporting very good/good self-rated health, with a very good/good health state score, very good/good quality of life score and low disability score, while survival for the moderate category for each health indicator usually falls closer to that of the very good/good health category.
Mortality rates of respondents aged 50 years and over (per 1000) by health status and sex, over-50-year-olds, Bangladesh
a For each of the WHO measures, population tertiles were used to reflect these categories.
b Based on Z-test.
Self-rated health
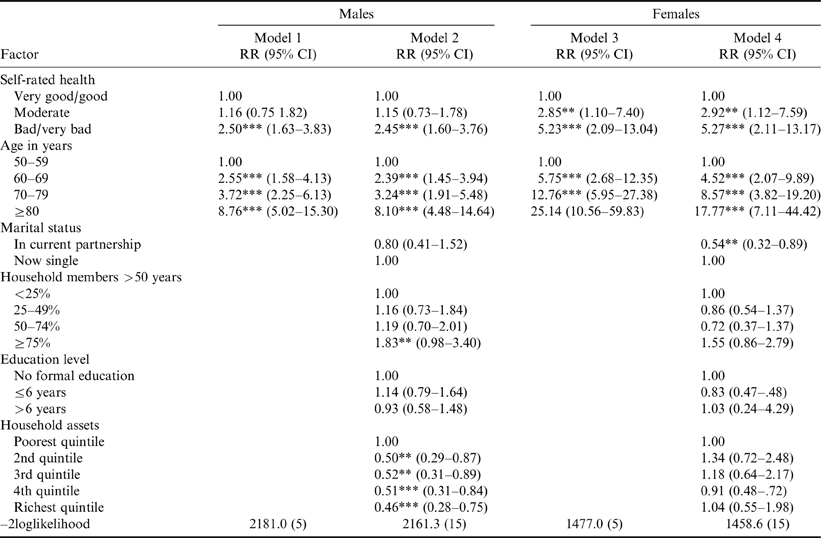
Model 1 (men) and Model 3 (women) in Table 4 show the association of self-rated health and subsequent mortality adjusted for age. Among men, those with bad self-rated health had a hazard ratio of 2.50 (CI: 1.63–3.83) compared with those with good self-rated health (p<0.001). Among women, the pattern is similar, but the hazard ratio is much higher than for men, at 5.23 (CI: 2.09–13.04) for bad self-rated health compared with good self-rated health (p<0.001). Adding the socio-demographic variables in Model 2 (men) and Model 4 (women) improved the model fit significantly (p<0.05) for both men and women. The hazard ratio for self-rated health was not significantly attenuated by addition of the covariates. Being currently married had a significant (p<0.01) protective effect for women (hazard ratio 0.54, CI: 0.32–0.89) but not for men (hazard ratio 0.80, CI: 0.41–1.52). Living in a household where three-quarters or more of its members were over age 50 is a significant (p<0.01) predictor for mortality among men (hazard ratio 1.83, CI: 0.98–3.40) but not for women (hazard ratio 1.55, CI: 0.86–2.79). For men, there was a strong relationship between household assets and mortality, with hazard ratio decreasing significantly as asset quintile increased but there was no such significant relationship between household assets and mortality among women. Education had no effect in either sex. As expected, the hazard ratio increased significantly as age increased for both men and women.
Relative risk of death of respondents aged 50 years and over as a function of self-rated health and socio-demographic variables by sex, Bangladesh
Models 1 and 3 are adjusted for age; Models 2 and 4 are adjusted for age and socio-demographic variables.
RR=Relative Risk; CI=Confidence Interval.
***p<0.001; **p<0.01; *p<0.05.
Health state
Model 1 (men) and Model 3 (women) in the top panel of Table 5 show association of the WHOHSS score and subsequent mortality adjusted for age. Among men, those with bad WHOHSS score had significant higher risk (p<0.001) of mortality compared with those with good score (hazard ratio 2.13, CI: 1.35–3.37). However, the WHOHSS score had no significant effect on mortality among women (hazard ratio 1.57, CI: 0.71–3.46). Adding the socio-demographic variables in Model 2 (men) and Model 4 (women) improved the model fit for both men and women, and improvement was statistically significant for men (p<0.05) and only marginally significant for women (p<0.10). The hazard ratio of WHOHSS was not significantly attenuated by the addition of covariates. The pattern of associations between the socio-demographic variables and mortality are similar to those seen for self-rated health: being married was significantly (p<0.01) protective for women but had no effect among men; living in an older household had significant higher risk (p<0.05) of mortality for men but had no effect among women; there was a significant and decreasing relationship with increasing household assets and mortality among men but not among women. Education had no effect in either sex. As expected, the hazard ratio increased significantly as age increased for both men and women.
Relative risk of death of respondents aged 50 years and over as a function of health state, quality of life and disability level, Bangladesh
Models 1 and 3 are adjusted for age; Models 2 and 4 are adjusted for age and socio-demographic variables.
RR=Relative Risk; CI=Confidence Interval.
***p<0.001; **p<0.01; *p<0.05.
Results of socio-demographic variables are not shown, as these are similar to those in Table 4.
Quality of life
Model 1 (men) and Model 3 (women) in the middle panel of Table 5 show association of the WHOQOL score and subsequent mortality adjusted for age. Those who reported a bad WHOQOL score had significant higher risk (p<0.01) for subsequent mortality compared with those reporting a good WHOQOL score for both men (hazard ratio 4.07, CI: 2.61–6.34) and women (hazard ratio 4.10, CI: 1.48–11.34). Adding the socio-demographic variables in Model 2 (men) and Model 4 (women) did not improve the model fit significantly for both men and women. The hazard ratio of WHOQOL score was not significantly attenuated by the addition of the covariates. In this model, being married no longer has a significant protective effect for women. However, living in an older household and fewer household assets continued to be significantly (p<0.05) associated with subsequent mortality for men only. Education had no effect in either sex. As expected, death rate increases significantly as age increases.
Disability level
Model 1 (men) and Model 3 (women) in the bottom panel of Table 5 show association of the WHODAS score and subsequent mortality adjusted for age. Among men, those who have the highest disability had a hazard ratio of 3.95 (CI: 2.56–6.11) compared with those with the lowest WHODAS score (p<0.001). Among women, a moderate WHODAS score was significantly protective against subsequent mortality (hazard ratio 0.34, CI: 0.13–0.87), an unexpected finding. Adding the socioeconomic variables in Model 2 (men) and Model 4 (women) improved the model fit significantly for women (p<0.05) but not for men. The hazard ratio of WHODAS was not significantly attenuated by the addition of covariates. In this model, being married was significantly (p<0.05) protective for women but had no effect among men. Living in an older household no longer showed a significant effect on mortality for men; however, for the first time, this effect was seen in women (hazard ratio 1.64, CI: 0.91–2.95). Fewer household assets continued to be significantly associated with subsequent mortality for men only. Education had no effect in either sex. As expected, death rate increases significantly as age increases.
Table 6 shows the correlation between health indicators. The results show that all four health indicators are significantly (p<0.001) related to each other. The value of r lies between 0.45 and 0.85. The lowest value of r is for self-rated health and quality of life (r=0.45) and the highest value r is for health state and disability level (r=0.85).
Correlation between health indicators of respondents aged 50 years and over, Bangladesh
Self-rated health is categorized as very bad=1, bad=2, moderate=3, good=4 and very good=5; for the other three health indicators scores are used (0–100).
Discussion
This study not only evaluated the association of self-rated health with subsequent mortality but also evaluated, for the first time, the association of mortality with three other WHO health indicators: health state, quality of life and disability level. Self-rated health was found to be significantly associated with subsequent mortality for both men and women. Those reporting bad health had higher subsequent mortality than those reporting good health, even controlling for socio-demographic factors. The excess mortality risk associated with reports of bad self-rated health is consistent with many studies in developed countries (Kaplan & Camacho, Reference Kaplan and Camacho1990; Wolinsky & Johnson, Reference Wolinsky and Johnson1992; Idler & Kasl, Reference Idler and Kasl1995; Borawski et al., Reference Borawski, Kinney and Kahana1996; Idler & Benyamini, Reference Idler and Benyamini1997; Yu et al., Reference Yu, Kean, Slymen, Liu, Zhang and Katzman1998) as well as the few available from developing countries (Yu et al., Reference Yu, Kean, Slymen, Liu, Zhang and Katzman1998; Kuhn et al., Reference Kuhn, Rahman, Menken, Cohen and Menken2006). The findings support the argument that an individual can effectively assess their own health in settings where interaction with health care providers is low (Idler & Benyamini, Reference Idler and Benyamini1997).
The WHO health indicators were developed to provide more robust health measures based on self-report. Our study finds that, among men, these indicators are significant predictors of subsequent mortality. However, for women, only the quality of life indicator (WHOQOL) was a significant predictor of subsequent mortality. Further, among women, moderate disability as measured by WHODAS had a protective effect on subsequent mortality. This may have been an effect of the fact that fewer than 10% of the women in this sample reported low disability.
The magnitude of the relative risk of ‘bad’ health for predicting mortality by WHO health indicators varies by sex. Comparing good with bad health among men, WHOQOL had the highest hazard ratio (hazard ratio 3.83) and WHODAS had a similar magnitude (hazard ratio 3.67). In contrast, self-rated health had a hazard ratio of 2.45 and WHOHSS, 2.00. Among women and comparing good with bad health, self-rated health had the highest hazard ratio (5.27). The hazard ratio for WHOQOL was 3.34, while the other WHO health indicators showed no significant difference in risk between good and bad health. Among the WHO indicators, the WHOHSS, which covers eight different domains of health, is nonetheless the least predictive. In contrast, self-rated health, a simple and easy to implement measure of health, significantly predicted subsequent mortality for both men and women. More studies are needed in different settings to draw conclusions regarding validity of the WHO health indicators.
More men than women reported good health but subsequent mortality was higher for men than women. Higher reporting of bad health by women could be due to them being more aware of health problems as pregnancy and childbirth provides them with more interaction with health care providers. In addition, women may face more health problems during the post-menopausal period, but these problems are more likely to be non-life-threatening compared with those of men. A recent study documented that more men than women die during adulthood and many of these deaths are due to infectious disease and injury (Razzaque et al., Reference Razzaque, Carmichael and Streatfield2009). Higher survival of older women compared with older men may be due to biological superiority once the risk of death associated with pregnancy is over. Earlier findings from the Matlab area documented that, during childhood, rate of survival of boys was better than for girls, because girls are discriminated against both for health care and food allocation (Chen et al., Reference Chen, Huq and D'Souza1981). However, in recent years, this sex differential in childhood mortality has reduced substantially (Rahman et al., Reference Rahman, Alam, Razzaque and Streatfield2011).
Being married confers a protective benefit among old adults. This confirms findings of a previous study (Rahman et al., Reference Rahman, Menken and Foster1992). Widowed/divorced people are often isolated and may have suffered mental disturbance/grief associated with the transition from being married, both factors that could lead to higher mortality. An earlier study from Matlab reported higher mortality among younger adults (15–59 years) for lower socioeconomic status. However, this study found higher mortality among older adults (50 years or more) for lower socioeconomic status among men only. This probably reflects the control of resources by men.
Self-rated health, a simple measure, predicts mortality significantly irrespective of sex. The three other health indicators (health state, quality of life and disability level) proposed by the WHO predict mortality significantly for men, but for women it is only quality of life that predicts mortality significantly. More study of the WHO health indicators is needed in different settings to understand this sex difference in subsequent mortality.
Acknowledgment
This research was funded by icddr,b's core donors, and the INDEPTH Network. The icddr,b acknowledges with gratitude the commitment of the INDEPTH Network for its research efforts, and also gratefully acknowledges the following donors, who provide unrestricted support: Australian Agency for International Development (AusAID), Government of the People's Republic of Bangladesh, Canadian International Development Agency (CIDA), Swedish International Development Cooperation Agency (Sida) and the Department for International Development, UK (DFID). Or Matha Fay helped to finalize the paper.