


Introduction
Ice cores are an excellent medium for understanding past changes in the climate and atmospheric environment, because so many parameters are recorded in the same core. As well as the basic climate variables such as temperature (from water isotope ratios) and accumulation rate, ice cores contain information about a host of climatic forcing factors and related environmental changes. Much of this information is tied up in the water-soluble chemical components (Reference Legrand and MayewskiLegrand and Mayewski, 1997). from among these components, one can hope to derive information about, for example, the volcanic history of the Earth (Reference Zielinski, Mayewski, Meeker, Whitlow and TwicklerZielinski and others, 1996), marine biogenic activity in the oceans (Reference Legrand, Feniet-Saigne, Saltzman, Germain, Barkov and PetrovLegrand and others, 1991), atmospheric circulation (Reference MayewskiMayewski and others, 1994) and sea-ice extent (Reference GrumetGrumet and others, 2001). There have been hundreds of such studies, although the interpretation of the chemical data in terms of environmental variables is rather difficult (Reference Wolff, Wolff and BalesWolff, 1996). However, the need to obtain large amounts of accurate high-resolution chemical data remains.
For both deep and shallow ice cores, it has now become routine to measure the ionic chemistry of the ice core, and until now this has most commonly been done by ion chromatography (IC). Several ice cores have already been analyzed continuously at high resolution in order to capture detailed signals (e.g. Greenland Ice Sheet Project 2 (GISP2) (Reference MayewskiMayewski and others, 1997) and Taylor Dome, Antarctica (Reference MayewskiMayewski and others, 1996)). However, because it is time-consuming to cut and analyze samples by IC, chemical datasets from many deep ice cores have been discontinuous (e.g. Reference Legrand, Lorius, Barkov and Petrov.Legrand and others, 1988). Partly for this reason, and partly to analyze new species not available from IC, continuous flow analysis (CFA) methods have been introduced in the last few years (Reference Fuhrer, Neftel, Anklin and MaggiFuhrer and others, 1993), and expanded to a range of ions and neutral chemicals. Such methods allow a rapid analysis to be made in the field, and at high resolutions (one to a few cm) in order to capture the annual variability of the signal. While at present not all the ions measured by IC can be measured with sufficient sensitivity by CFA, the range that can be determined is increasing (Reference RöthlisbergerRöthlisberger and others, 2000). A third method, known as fast ion chromatography (FIC), has recently been developed (Reference UdistiUdisti and others, 2000). This uses the IC analytical method, but adapted to work at high resolution in the field for a few components.
The European Project for Ice Coring in Antarctica (EPICA) has as its first target a drilling to bedrock at the central Antarctic site, Dome C (75˚06’ S, 123˚24’ E). All three methods (IC, CFA and FIC) are being used along the entire length of the core. Data are available at present from the surface to 788 m depth, representing some 45 kyr. This provides an excellent opportunity to compare the data retrieved by the three methods, and to discuss the advantages and disadvantages of each.
Analytical Methods
Ion chromatography
IC was used to determine a large number of anions (F–, methanesulphonate (MSA–), Cl–, NO3 –, SO4 2–, acetate, oxalate, formate) and cations (Na+, NH4 +, K+,Mg2+ and Ca2+).
For the top 580 m, the samples for analysis were obtained from 55 cm long subsections of the core, shipped back to Europe. These strips of ice were distributed to the five IC laboratories (each laboratory received one in every five 55 cm sections), and then decontaminated and cut into 5 cm samples in cold rooms. the resolution was occasionally higher (2.5 cm) for sections containing specific events. Below 580 m, a faster alternative was used to produce the samples: meltwater was collected directly into sample bottles from the CFA meltwater stream, sampling at 10 cm resolution. Each laboratory received samples from one in every five 1.1 m sections of core, totalling about 330 samples per laboratory.
The IC analysis was carried out in clean laboratories by five institutes, according to the experimental conditions described in Table 1. At Dome C concentrations, the reproducibility of the method varies for one laboratory in the range 4–10% depending on the species and concentrations.
Experimental conditions for the IC analysis

Continuous flow analysis
CFA is based on a steady sample stream, which is split into several lines and led into different detectors. the continuous sample is obtained by slowly melting a subsection of the core on a melting device. It splits the melting liquid from the inner part of the core (presumed clean) from the outer part (possibly contaminated). Only the stream from the inner part is used for the chemical analysis and for the IC samples mentioned above. At Dome C, the CFA included four fluorescence spectrometers for NH4 +, Ca2+, H2O2 and HCHO, two absorption spectrometers for Na+ and NO3 –, and a commercially available conductivity cell and conductivity meter. the depth resolution achieved with the set-up used is approximately 1cm. A more detailed description of the analytical set-up is found in Reference RöthlisbergerRöthlisberger and others (2000).
Fast ion chromatography
The anions, Cl–, NO3 – and SO4 2– were also determined by a semi-continuous method, in which a part of the output from the CFA melter (again the stream from the inner part of the core) was directed to an ion chromatograph (Reference UdistiUdisti and others, 2000). A sample was injected into the IC every 1min, giving approximately one measurement for every 4 cm of ice. A volume of 0.75 mL of meltwater was loaded onto a pre-concentrator column, and then eluted through the IC using 1–2mM Na2CO3 and 0.1–0.5 mM NaHCO3. the method was initially designed for sulphate only, so determinations of the other anions carried out in the 1997/ 98 field season (depths 99.0–358.6m) at Dome C are only approximate, especially since the non-sulphate peaks were close to the water dip. In the 1998/99 field season, conditions were optimized, and then further improved for the final section of processing (core below 580 m) that occurred in 2000. Injecting a lower sample volume into a pre-concentration column and increasing the eluent concentration allowed separation of the peaks from the water dip. It is estimated that detection limits of 0.5 mg kg–1 were achieved, with reproducibility at typical concentrations at Dome C of 2% for NO3 – and SO4 2– and 4% for Cl– (Reference UdistiUdisti and others, 2000).
Inter-laboratory comparison between the five IC groups
An inter-laboratory comparison exercise was undertaken in 1999 using Dome C ice samples. Identical samples were supplied to each laboratory, taken from a pooled sample of melted ice. the laboratories were asked to analyze each sample on two separate occasions, using their normal methods. A second intercomparison is currently underway.
Results and Discussion
Inter-laboratory comparison between the five IC groups
In this exercise, two samples of Holocene ice (with low concentrations of many ions) were analyzed. There was good agreement between the laboratories for some ions. However, only for sulphate (around 100 mg kg–1) was the agreement between the laboratories better than 5%, the uncertainty often quoted by IC laboratories. This variation corresponds to a ±2.5% spread of the results from each laboratory around the mean, with the spread expressed as the standard deviation of the results from the five laboratories. for Cl– (15–20μg kg–1 range) and Na+ (around 20 mg kg–1), the spread around the mean was about ±10%, and it was around ±15% for MSA– (2–4μg kg–1 range) and Mg2+ (2–3μg kg–1 range). Considering the very low levels of these last ions, the ability to discriminate confidently between samples that are <1 μg kg–1 different is encouraging. the concentrations of these Holocene samples are among the lowest that are encountered in polar snow for many elements, and some laboratories are having to learn to operate nearer to their detection limits than is customary for them.
The agreement for some other ions was not so good. for nitrate (around 10 mg kg–1) the spread was >±50%, but comparison of the data generated by the laboratories subsequently suggests that better performance is achieved in routine analysis. We could not rule out the possibility that nitrate had been affected by problems in sample preparation and storage. Finally, for the cations, K+ (around 2 mg kg–1) and Ca2+ (around 10 mg kg–1), the agreement was poor with a spread of order ±30%. In the combined record from all the laboratories, and for low-concentration Holocene ice, it would be difficult confidently to differentiate short-term changes in background concentration from inter-laboratory differences, although there should be no difficulty in identifying and quantifying sporadic peaks or long-term trends, or in analyzing the dustier ice of the pre-Holocene period.
Comparison of sample-analysis statistics from the five IC groups
Because the inter-laboratory comparison was quite limited, we also tested whether similar populations of samples from the five laboratories were reported as having similar mean concentrations. This acts as a further check on the calibration between the laboratories.
This comparison concerns the 200 msection of glacial ice at 585–788m depth, and the 330 samples received by each laboratory were evenly distributed across the full section. the overall mean concentrations from each laboratory for each species measured are generally similar, as shown in Figure 1. for most species, at least four of the mean results reported lie within the range of the confidence interval. the main differences between the mean values can probably be ascribed to the analytical source, and may only partly be influenced by unusual concentrations in certain sections. Sulphate is a clear exception to this rule, though we are confident that this is a result of an uneven distribution of sample values. Superimposed on the general background sulphate value of around 130–210 mg kg–1 lie many large volcanic spikes, some >1000μg kg–1, but these large peaks are not distributed evenly among the laboratories. from the result of the inter-laboratory comparison exercise, we know that the five laboratories are very consistent in the reporting of sulphate (this result is compared in Figure 1 with the actual ice analyses).
Comparison of the samples analyzed by the five IC laboratories in the depth interval 585–788 m. Each marker represents the mean concentration over the whole depth interval for one species obtained by one laboratory; the error bar represents the 99% confidence interval.

Sodium: CFA vs IC
To handle the wide difference in resolution between the two methods, we compile the data into 55 cm (``bag’’) averages and plot in Figure 2 the comparison in results from identical bags. Overall, the two methods are in good agreement: linear regression slope of 1.04  and even distribution on both sides of the theoretical line y = x up to 90 mg kg–1. At higher concentrations (90–140 mg kg–1), the CFA tends to overestimate Na+, probably due to a calibration uncertainty. These results were determined using a linear calibration, and then applying a general correction above 50 mg kg–1 to compensate the non-linearity of the response at high concentrations. the method has now been improved by using a non-linear calibration. One can occasionally note a deviation higher than the average: a clear example is point ``a’’ in Figure 2. A detailed examination of this section showed that an erroneous calibration of the CFA has caused a systematic offset. the CFA produces a large number of data, and only a careful reprocessing could allow us to discard such a point. the detailed sections (Fig. 3 and 4a) confirm the quantitative agreement of the two methods, respectively at both low (10– 20 mg kg–1) and higher concentrations (60–90μg kg–1). Some variations can occasionally occur due to the different resolutions and some slight depth shifts between the two methods (e.g. in Figure 3, peaks at 349.9 and 351.1m). With a 5 cm sample resolution (Fig. 3), the IC detects most of the peaks, whereas only the main features remain with a 10 cm resolution (Fig. 4a). the high resolution of the CFA captures the detailed structure of the signal, providing further information for an analysis of the high-frequency variability.
CFA vs IC for the sodium 55 cm mean values up to 670 m.

Comparison of CFA  and IC 5 cm resolution
 sodium data at low concentrations. the vertical lines delimit the 55 cm sections of the core. for each section the IC laboratory that carried out the analysis is indicated. the horizontal lines represent the corresponding 55 cm CFA and IC
 mean values.

Some detailed results for the depth interval 663– 670 m:(a) CFA and IC 10 cm resolution sodium data. the vertical lines delimit the 1.10 m sections of the core. the horizontal lines represent the corresponding 1.10 m CFA and IC mean values. for each section the IC laboratory that carried out the analysis is indicated (also applicable to (b–d)). (b) CFA and IC 10 cm resolution calcium data. (c) CFA FIC  and IC 10 cm resolution nitrate data. (d) FIC and IC 10 cm resolution chloride data.

Calcium: CFA vs IC
Data from the high-resolution CFA analyses and the lower-resolution IC analyses are available through the Holocene, transition and late glacial periods, allowing us to compare data across a wide range of concentrations. According to the 55 cm (bag) averages analysis (Fig. 5), we can claim that in general the two methods produce similar values: the actual gradient of CFA vs IC is 1.04 (r2 = 0.934) close to unity. Over a 6m section (Fig. 4b) the IC data have the appearance of a smoothed version of the high-resolution CFA data, and the values measured appear consistent. However, when we compare some sections in detail (Fig. 6) we can see problems arising. At low concentrations (Fig. 6a) the IC records values rather higher than the CFA: this is common throughout the Holocene samples. This discrepancy could arise from a difference in the ability of the two methods to measure all the Ca2+ present; the eluent used in IC (see Table 1) means that IC measures at approximately pH2, where more particulate Ca2+ will be soluble. However, the poor comparison between the five IC laboratories at the lowest concentrations for Ca2+ in the inter-laboratory comparison also raises doubts about the IC analysis near to the detection limit. Further work is needed to decide which, if either, method, is quantitatively accurate at low concentration. At higher concentrations, such as found in the transition (Fig. 6b), the concentration recorded by the two techniques is broadly similar, but it is clear that the CFA captures details that the low-resolution IC sampling does not.
CFA vs IC for the calcium 55 cm mean values up to 670 m.

Detailed calcium results at different depths and concentrations showing the CFA and IC data.

Ammonium: CFA vs IC
Ammonium (NH4 +) was analyzed by CFA in the field and by IC in three laboratories. the available data up to 580 m show two distinct parts depending on the depth. for the top 100m, the concentrations determined by IC are 5–50 times higher than the CFA ones (Fig. 7). This section of the core corresponds to the porous firn easily contaminated by trace gases from the ambient air. the level of contamination decreases progressively from the surface as the density of the firn increases. the schedule of the sampling may explain the difference between the CFA and IC results: the CFA analysis was carried out in the field 1–2 years earlier than the processing of the firn core for IC analysis in Europe. It seems difficult during a long storage and transport to prevent the NH4 + contamination of the firn sections. Below 100m, the majority of the IC concentrations are lower, but the two methods still show a significant difference. When plotting the CFA results against the IC (Fig. 8), we notice a considerable deviation from the theoretical line y = x, but one laboratory did produce more consistent results than the others. Despite all the usual precautions taken for the IC analysis (minimize the contact with the ambient air, analysis as soon as the samples are melted, etc.), it seems difficult to avoid some contamination. It is well known that the ammonia present in the ambient air easily contaminates liquid samples (Reference Legrand, de Angelis and Delmas.Legrand and others, 1984), hence the CFA method seems more appropriate than the IC as the meltwater does not come into contact with the ambient air before analysis.
Ammonium data for the top 150 m of the core. Comparison between the CFA (−) and the IC 55 cm mean concentrations (each type of marker represents an IClaboratory).

CFA vs IC for the ammonium 55 cm mean values at 100–580 m. Each type of marker represents an IC laboratory.

Nitrate: CFA vs IC and FIC vs IC
``Bag’’ average concentrations of nitrate measured by IC and CFA are available from the whole of the Holocene, through the transition and into the early part of the glacial period: 0–584m (except 123–320m for the CFA when the data are considered unreliable) plus one deeper section. for the FIC technique, while the full range of ice between 0 and 788m was measured, the section 99–358m was also considered unreliable due to the immaturity of the technique. Figure 9 plots the data from the two rapid techniques against the IC results. the linear regression of FIC on IC gives a slope of 1.05 (r2 = 0.88), while CFA on IC has a slope of 1.15 (r2 = 0.88), implying that the rapid techniques generally give higher values than the IC. CFA and FIC appear to agree better, with a linear regression slope CFA on FIC of 1.02 (r2 =0.92). Examination of a 6 m section of the core in detail (Fig. 4c) shows the origin of this general result. the IC data track the pattern of the high-resolution CFA profile but at a lower concentration, and without capturing the sharp, high-value peaks, while the FIC technique appears slightly better at these sharp peaks. One bag section of IC data appears anomalously low, with CFA and FIC agreeing closely across this bag. Other bag sections show a better correspondence between FIC and IC. Generally, once the three techniques were mature, they all gave good, reliable data, with the occasional short section where each of the techniques gave poor results.
Nitrate data: (a) CFA vs IC for the 55 cm mean values up to 580 m; (b) FIC vs IC for the 55 cm mean values at 0– 99 and 358–788 m.

Sulphate: FIC vs IC
The FIC method was originally developed for SO4 2–, so it is pleasing to note that the agreement between the techniques for this ion is good, both quantitatively and qualitatively. Detailed features are seen similarly in both methods (Fig. 10), and although there is in some cases an offset (indicating a calibration difference) between the two methods, the average of the absolute difference between the methods for a single 55 cm interval is <10%, only slightly larger than the precision of IC by itself. the linear regression of FIC on IC for 55 cm averages has a slope of 1.03 and a correlation coefficient of 0.92. FIC therefore seems to be suitable for analysis of SO4 2– in the Dome C ice core.
Detailed sulphate results at different depths and concentrations showing the FIC data and IC 5 cm resolution data

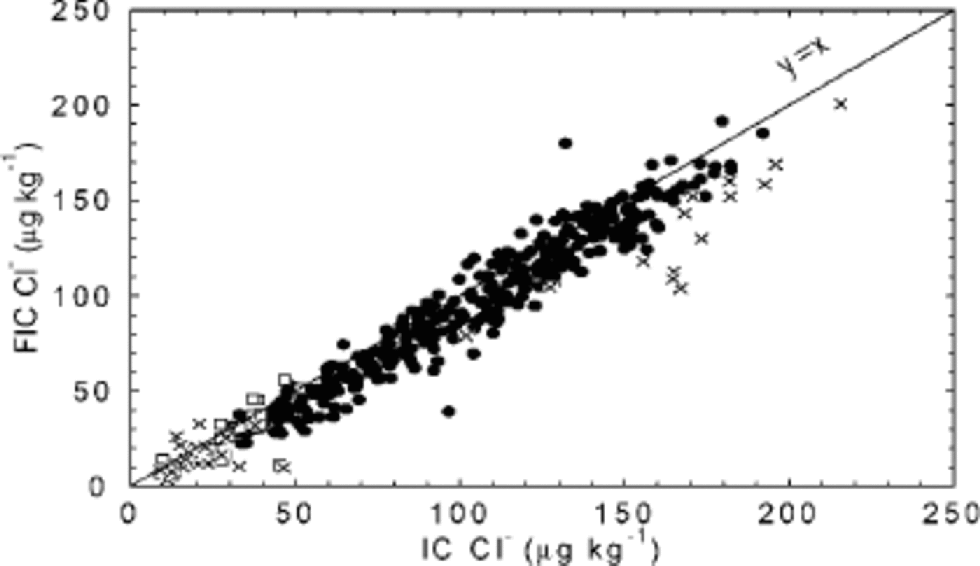
Chloride: FIC vs IC
With the very short analysis time of FIC, the Cl– peak is hard to capture, and may be found in the water dip present at the start of the chromatogram. In the 1997/98 season, Cl– by FIC was not considered a mature method, while improvements for the 1998/99 season allowed reporting of results. Further improvements for the processing carried out in 2000 seem to have solved remaining problems, and the two methods now show very similar results, both in detail (Fig. 4d) and on average (Fig. 11). Quantitative accuracy is of particular importance when data are used to derive ratios between ions (such as Cl–/Na+), and is achieved in data from 585 m downwards.
FIC vs IC for the chloride 55 cm mean values up to 788 m. FIC results were obtained during three field seasons: 1997/98 (□), 1998/99 (×) and 1999/2000 (•).
Conclusions
The IC, widely used until now for ice-core ionic analysis, is a well-established method to determine a wide range of ions. It benefits from the ability to calibrate carefully and frequently, and re-analyze samples when problems are identified, but is very time-consuming. the slow sample preparation and analysis make the method unsuitable for high-resolution analysis in the field.
The development of the CFA has allowed fast analysis to be carried out in the field for a smaller range of ions. the method provides very high-resolution results, but requires careful attention to calibration and to processing of the large number of data. the comparison clearly showed that the CFA gives better results than the IC for NH4 +, as it reduces the risk of contamination. for other ions (Na+, Ca2+, NO3 –), the CFA generally gives good results.
The other fast technique (FIC) developed to provide high-resolution data in the field covers a few ions (Cl–, NO3 –, SO4 2–) and offers a complement to the CFA by rapidly analyzing ions not previously available by CFA (Cl–, SO4 2–). It has proved to give excellent results for SO4 2–. Initially, it was able to capture peaks and trends for the other ions, but could not be used in situations where accurate quantification was important. However, after improvements to the method in the later analyses, it now also gives good results for Cl– and NO3 –.
We conclude that the determination of the full range of species still requires a combination of analytical methods. the CFA and FIC can be used to measure the main species (Na+, NH4 +, Ca2+, Cl–, NO3 –, SO4 2– ), and the IC allows analysis of the other ions, as well as checking the analytical quality of the results obtained by the two fast techniques. Some of the speed advantages of the in situ methods can be kept for the IC by collecting meltwater in the field for the IC samples.
Acknowledgements
This work is a contribution to the ``European Project for Ice Coring in Antarctica’’ (EPICA), a joint European Science Foundation (ESF)/European Commission (EC) scientific programme, funded by the EC and by national contributions from Belgium, Denmark, France, Germany, Italy, the Netherlands, Norway, Sweden, Switzerland and the United Kingdom. This is EPICA publication No. 39. We would like to thank the many people involved in the collection, cutting and analysis of the Dome C core.



