Introduction
Scanning transmission electron microscopy (STEM) at atomic resolution is now in wide general use, with Z-contrast imaging and electron energy-loss spectroscopy (EELS) being well established.Reference Pennycook, Pennycook and Nellist1, Reference Allen, Findlay, Oxley, Pennycook and Nellist2 This review discusses an extension of STEM to obtain atomic-level chemical maps using energy-dispersive x-ray (EDX) spectroscopy. The first such results were published by D’Alfonso and co-workersReference D’Alfonso, Freitag, Klenov and Allen3 using a test sample of <001> SrTiO3. The specimen, estimated to be 100 nm thick, was illuminated by a 300 kV probe formed using a lens with an aperture semi-angle of 9.6 mrad and with a third-order spherical aberration coefficient C s = 1.2 mm. This gave an estimated probe size of 0.14 nm and a beam current of 10–20 pA. The EDX detector subtended a collection angle of 0.13 sr. Subsequently, these results were confirmed in an experiment led by Chu et al. using a similar system.Reference Chu, Liou, Chang, Choa and Chen4
Since the first results were reported,Reference D’Alfonso, Freitag, Klenov and Allen3, Reference Chu, Liou, Chang, Choa and Chen4 there has been considerable progress from an experimental point of view.Reference von Harrach, Dona, Freitag, Niculae and Rohde5–Reference Schlossmacher, Klenov, Freitag, von Harrach and Steinbach7 Detectors enabling count rates an order of magnitude better than those used in the earlier work have been developed and installed in microscopes that have correction for spherical aberration,Reference Kujawa, Freitag and Hubert8, Reference Freitag, Erni, Inoke, Stekelenburg and Hubert9 allowing for the use of finer probes. A brief review of aberration correction in electron microscopy can be found in Reference Reference Hawkes10. In this article, we present an overview of these new state-of-the-art systems and illustrate the potential for applications by considering three case studies. First, we consider a crystalline slab of GaAs oriented along <001> and show maps obtained for both K-shell and L-shell ionization in Ga and As. We next consider <100> SrTiO3 and obtain chemical maps by monitoring the x-rays associated with ionization of the constituent elements.Reference von Harrach, Dona, Freitag, Niculae and Rohde5 Last, we study a SrTiO3-PbTiO3 interface. In all cases, first-principle calculations are presented that confirm and facilitate the interpretation of the experimental maps. The calculations allow us to discuss issues such as probe channeling and spreading, the contribution from thermal scattering (electrons that have already excited phonons), and delocalization of the images.
Experiment
The signal strength in EDX spectroscopy (for a given specimen) is determined by three experimental STEM parameters: the accelerating voltage, the probe current, and the collection efficiency of the detector. For the atomic resolution chemical mapping described in this review, we discuss the last two—in particular, the improvement in probe current using a high-brightness field emission gun electron source (XFEG) in a C s corrected microscope and the increased collection efficiency afforded by the innovative design in the latest detectors.
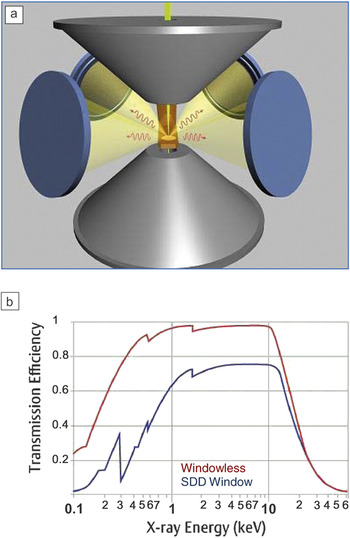
Increasing the probe current is a strategy that is limited by the electron dose the sample can tolerate before specimen damage occurs. Therefore improved x-ray collection efficiency is ultimately necessary to maximize the signal for a sustainable electron dose if we are to obtain usable increases in the signal-to-noise (S/N) ratio. Substantial progress in this direction has been achieved by the new Super-X detector,Reference von Harrach, Dona, Freitag, Niculae and Rohde5–Reference Schlossmacher, Klenov, Freitag, von Harrach and Steinbach7 where multiple silicon drift detectors (SDDs) are used to obtain high signal throughput. In the Super-X detector, four SDDs are symmetrically placed around the optical axis close to the sample area,Reference Schlossmacher, Klenov, Freitag, von Harrach and Steinbach7 as shown in Figure 1a. All four signals are combined into one spectrum to improve the collection efficiency. A total sensor area of 120 mm2 and integration of the detectors deep inside the electron-optical column result in a detection solid angle of 0.7 sr on the microscope used, a C s-corrected FEI Titan. In addition, the detector is windowless, which allows for higher collection efficiency, since absorption by the window material is avoided.Reference Schlossmacher, Klenov, Freitag, von Harrach and Steinbach7 As can be seen in Figure 1b, the improvement in sensitivity is not only in the low-energy range, but even at high energies such as 8 kV, a 30% increase in signal is obtained.
(a) Positioning of the four silicon drift detectors (SDD) in the pole piece of the microscope. (b) A comparison of collection efficiency between x-ray detectors with and without a window.Reference Schlossmacher, Klenov, Freitag, von Harrach and Steinbach7

The case studies in this review were conducted on an FEI Titan G2 microscope equipped with a Super-X detector. The probe C s-corrector and a high-brightness XFEG were operated at an accelerating voltage of 200 kV. The results were recorded using probes with convergence semi-angles in the 21–25 mrad range (and with a probe size of about 0.1 nm). The probe current ranged between 50 and 200 pA. Chemical maps were acquired on a 64 × 64 pixel array using iterative drift correction and with a 25 μs dwell time.
Theory
Simulations of the chemical maps can be performed using a model for thermal diffuse scattering based on a Born-Oppenheimer (BO)-type approximationReference Forbes, Martin, Findlay, D’Alfonso and Allen11 extended to incorporate ionization11–14 by both elastically and thermally scattered electrons. The BO approximation is based on the fact that the incoming fast electrons have an energy (hundreds of keV) that is much larger than the energy associated with phonon excitation (on the order of meV). The BO modelReference Forbes, Martin, Findlay, D’Alfonso and Allen11 is a quantum-mechanical approach to solving the many-body Schrödinger equation, which models the distribution of both elastically scattered electrons and those that have been inelastically scattered (perhaps multiple times) due to excitation of a phonon (and with a consequent energy loss on the order of meV). The BO model is conceptually quite different than the well-known frozen phonon (FP) model,Reference Hillyard, Loane and Silcox15, Reference Kirkland16 which assumes that each incoming electron sees the crystal lattice frozen in a particular vibrational configuration. The BO model yields results for the totality of the elastic and inelastic scattering intensity that is numerically equivalent to the widely used FP model.
Using the BO model, the contribution to the ionization cross-section for a particular edge from both elastically and inelastically scattered electrons can be calculated. An effective potential is used to describe the ionization.Reference Oxley and Allen12 To calculate x-ray yields, it is assumed that the cross-section for all x-ray emission, which occurs when a hole is filled post-ionization, is simply proportional to the cross-section for inner-shell ionization in EELS, where a detector spanning the whole solid angle is assumed (thus registering electrons inelastically scattered in all directions), and all energy losses above the threshold energy for ionization are taken into account. Using the BO model correctly takes into account the x-ray yield due to ionization events by electrons that are thermally scattered. The fact that a large detection area leads to an effectively local inelastic scattering potential has been discussed in detail elsewhere.Reference Findlay, Oxley and Allen17 The integration over all energy losses tends to localize (i.e., peak up) this local potential relative to EELS, with a small energy window above the threshold.Reference Wang, D’Alfonso, Findlay, Allen and Bleloch18 This means that unexpected contrast reversals, as have been noted in EELS,Reference Wang, D’Alfonso, Findlay, Allen and Bleloch18 are much less likely to occur. In the BO model, the cross-section expression for ionization as a function of probe position R and sample thickness t is given by

Here A is the area of the unit cell seen by the incident electrons, J is the number of atom configurations assumed in the BO model, v = hk 0/m is the incident electron’s velocity with h Planck’s constant, m the mass , and k 0 = 1/λ0 (λ0 the wavelength) the wave number. Furthermore, ψj(R,r,z) is the probe electron wave function for the j th atomic configuration, and r is a vector in the plane at a depth z in the specimen. The effective local ionization potential V(r) is given in terms of transition potentials Hn 0(r) as follows:
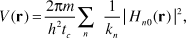
where tc is the distance along the z-direction over which the potential is projected. The modulus squared of the transition potentials simply gives the probability of an ionization event from an initial state, labeled 0 to a final state labeled n. The quantity kn is the wave number of the inelastically scattered electron after such a transition. The summation over index n is over all possible final states.
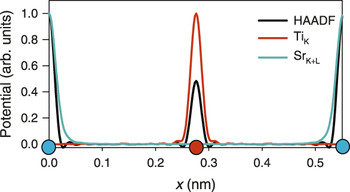
The form of Equation 1 implies that chemical mapping based on EDX is an incoherent imaging mode akin to Z-contrast imaging, since it depends only on the product of the intensity of the probe wave function and the inelastic scattering potential at each point in space. There is therefore likely to be a one-to-one correspondence between image and structure. The effective scattering potentials for an incident energy of 300 kV for Z-contrast imaging, EDX mapping based on the Ti K shell, and EDX mapping based on the sum of the Sr K-shell plus L-shell signals are shown in Figure 2.Reference D’Alfonso, Freitag, Klenov and Allen3 The Z-contrast potential is the most peaked about the atomic columns and corresponds closely to the projected structure. It is more peaked around the Sr columns than on the Ti columns. The EDX potentials are also quite peaked and have localization about the atomic columns comparable to the Z-contrast potential. These potentials are pertinent to a particular atomic species in a sub-lattice. The relative full widths at half-maximum (FWHM) of the respective EDX potentials are 0.022 and 0.033 nm, respectively, indicating that the chemical maps will be at atomic resolution.
Effective Z-contrast inelastic scattering potential (denoted HAADF due to the high-angle annular dark field detector used in such imaging) for a detector spanning 60–160 mrad and effective ionization potentials for Ti K-shell x-ray emission and for the combined Sr K- and L-shell energy-dispersive x-ray (EDX) spectroscopy signals. The scattering potentials are for the <110> direction for a single unit cell of SrTiO3 oriented along [001] and with the distance along the <110> direction denoted by x. The Sr and Ti sites are indicated by the blue and red circles, respectively. Each line plot has its maximum value normalized to unity.Reference D’Alfonso, Freitag, Klenov and Allen3

Z-contrast imaging and chemical mapping based on EDX are both described by Equation 1, and the effective potential V(r) is localized about the atomic columns in both cases, as was shown in Figure 2. Therefore, we expect chemical mapping based on EDX to behave in a similar way to Z-contrast imaging but with additional chemical information.
Case studies
Gallium arsenide
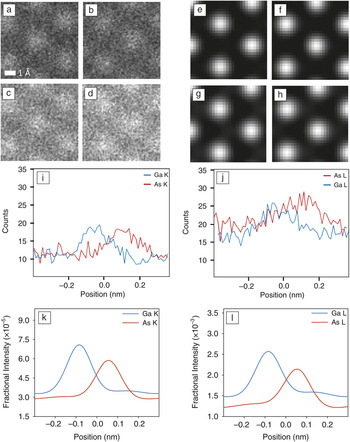
A crystalline specimen of GaAs was imaged along the <110> zone axis.Reference Freitag, Klenov, von Harrach, D’Alfonso and Allen19 GaAs is a III/V semiconductor used in the manufacture of integrated circuits, light-emitting diodes, laser diodes, and solar cells.The microscope used was an aberration-corrected FEI Titan STEM equipped with a Super-X detector, as described previously. The probe-forming aperture was 22 mrad. Chemical maps are shown for the Ga K shell in Figure 3a, the As K shell in Figure 3b, the Ga L shell in Figure 3c, and the As L shell in Figure 3d. These images are unfiltered, representing the raw intensities of the characteristic edges at each point in the map. The corresponding simulations are shown in Figure 3e–h. It should be noted that the predicted column positions in the simulations concur with the experiments. Line scans extracted from Figure 3a–d are shown in Figure 3i–j. As the data for each image was recorded simultaneously, probe channeling was the same for each data point. Not surprisingly, Figure 3i–j demonstrates a pronounced delocalization about the atomic site when images are constructed from the lower lying L-shell ionization event. The corresponding simulated line scans are shown in Figure 3k–1. The simulations were carried out using the BO model on a 512 × 512 grid sampling in a 2.83 nm × 2.90 nm area and assuming a 70 nm thick specimen. A total of 40 distinct atomic configurations were used for the calculation, with averaging being performed over 20 parameterizations of the atomic coordinates for each slice in the calculation. To more accurately model the experiment, the finite source size was modeled by convolving with a Gaussian of 0.12 nm FWHM.
Experimental energy-dispersive x-ray (EDX) results for (a) the Ga K shell, (b) the As K shell, (c) the Ga L shell, and (d) the As L shell. The corresponding simulations are shown in (e), (f), (g), and (h). Line scans in the experimental data for (i) the K shell and (j) the L shell. The simulations corresponding to (i) and (j) are shown in (k) and (l), respectively.Reference Freitag, Klenov, von Harrach, D’Alfonso and Allen19

Clearly evident in Figure 3i–1 is a difference in localization between the Ga and As signals. Furthermore, we see a delocalized background. This delocalized background is attributed to the dechanneled thermally scattered electrons, as simulations using only the elastic channel (not shown) predict a reduced background. The lower lying L edges produce a more significant background (relatively speaking).
The lower lying L shell edge has an effective potential that is more delocalized than the K shell, an assertion supported by data and simulation. Furthermore, the differences in localization between Ga and As effective potentials for the same target inner shell electron are smaller compared to differences between different inner shells.
Strontium titanate
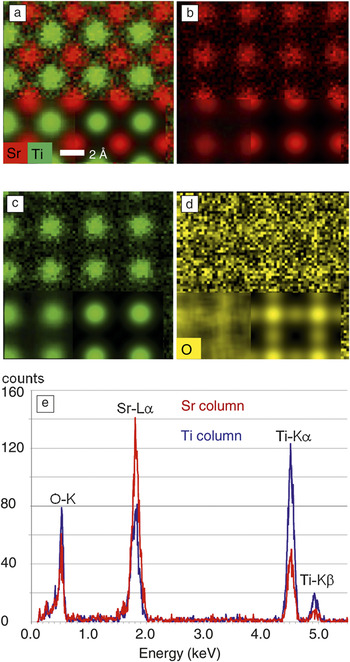
Figure 4 shows a comparison of experimental and calculated chemical maps taken on SrTiO3 orientated along <001>.Reference Klenov and Lazar20 Applications of SrTiO3 are in diamond simulation, precision optics, and advanced ceramics. The sums of the Sr L shell and K shell, and Ti K-shell and O K-shell signals were monitored. A composite of the Sr and Ti maps is shown in Figure 4a. The top half of the figure shows raw experimental data. At the bottom left are filtered chemical maps (using a moving average filter), and to the right of that a simulation is inlaid. The component Sr and Ti maps and the corresponding inlays are shown in Figure 4b–c, respectively. The results for oxygen are shown in Figure 4d. The averaged experimental result (bottom left) and the simulation (inlaid to the right of that) are seen once again to be in good qualitative agreement.
(a) Composite Sr/Ti chemical map with an averaged map obtained from several such maps, inset at bottom left, and a simulation to the right of that; the top half of the map is the raw data from a single scan. (b) The Sr (K- plus L-shell) contribution to (a). (c) The Ti K-shell contribution to (a). (d) O K-shell map with average and simulations inset as before. (e) Typical energy-dispersive x-ray spectra with the probe placed above the Sr and Ti-O columns.Reference Klenov and Lazar20

Typical EDX spectra with the probe placed above the Sr and Ti-O columns are shown in Figure 4e. We note that when the probe is on a Sr column, a signal is also obtained from Ti and O atoms. This is due to probe spreading and the contribution from electrons thermally scattered away from the column of large atomic number Sr atoms, which leads to a delocalized background of thermally scattered electrons.Reference Klenov and Stemmer21–Reference LeBeau, Findlay, Allen and Stemmer23 Similarly, when the probe is on the Ti columns (which also contain O atoms), there is a significant signal from Sr atoms.
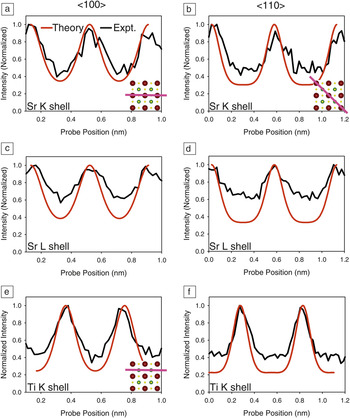
Line profiles extracted from the maps in Figure 4 are shown in Figure 5, where a comparison with simulations is made in each case. Figure 5a–b shows Sr K-shell scans along the lines indicated. In Figure 5c–d, the Sr L-shell signals are along the same line scans. Figure 5e–f shows the Ti K-shell results—the line scan is as indicated in Figure 5e. For Figure 5f, the scan is along the same line as in Figure 5b–d. For Sr, the L shell has a more delocalized signal compared to the K shell. This is in agreement with the observations on GaAs in the previous subsection, where the higher energy shell has better localization than the lower one. This is confirmed by the simulations. While in each case there is a significant, largely structureless background between columns, the maximum intensity for each element always stays at the corresponding atomic column.
(a–b) Sr K-shell scans along the lines indicated. (c–d) Sr L-shell signals along the same line scans, respectively. (e–f) Ti K-shell results. For (e), the scan is as indicated, for (f), as in (b) and (d). Sr atoms are colored red, Ti atoms are green, and O atoms are yellow in the insets indicating the scan directions.

EDX mapping across an interface
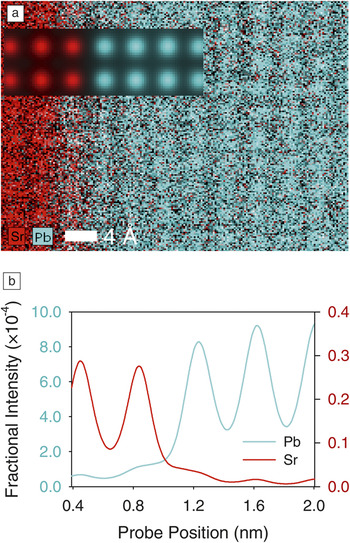
Figure 6a shows a selected area from an EDX map of the epitaxial (001) SrTiO3-PbTiO3 interface recorded along <100>.Reference Klenov, Freitag, von Harrach, D’Alfonso and Allen24 This is an example of a double perovskite in which a wide range of phenomena are found, ranging from ferroelectricity to superconductivity to half-metallicity. The probe convergence semi-angle was 21.5 mrad, corresponding to a probe size of approximately 0.14 nm and with a current of 67 pA. The data presented are once again raw data obtained by only extracting the intensities of the characteristic absorption edge of the elements. The complete map size is 200 × 200 pixels, with a total mapping time of approximately 300 s. Clearly, the positions of the Sr and Pb atomic columns can be visualized in the x-ray map shown in Figure 6a, revealing the chemical structure at the interface. It is noteworthy that, for interface studies, a symmetric detection of the signal around the specimen is beneficial, since anisotropic secondary effects such as differences in fluorescence of the different materials in different directions can be avoided. For a particular detector design, the relationship of the interface to the detector direction can influence the signal due to anisotropic effects and can create artifacts. These effects have not been taken into account in the simulations and are not required considering the symmetric design of the Super-X detector. EDX mapping confirms that the Ti sublattice is continuous across the interface. The Sr and Pb sublattices do not show an atomically abrupt termination at the interface, with some intermixing evident. In the first instance, this could be expected due to probe spreading and the background of thermally scattered electrons.
(a) Atomic resolution energy-dispersive x-ray map of a SrTiO3/PbTiO3 interface (Sr and Pb signals are shown). Microscope imaging parameters are given in the text. Inlaid are simulated maps for Sr and Pb, assuming an atomically abrupt interface. (b) Line traces through the simulations inlaid in (a) along the columns and across the interface.Reference Klenov, Freitag, von Harrach, D’Alfonso and Allen24

Simulations were made with the assumption of an atomically sharp interface and are shown inlaid on Figure 6a. The finite size of the source was simulated by convolving the calculated map with a Gaussian with a FWHM of 0.12 nm. Line traces across the simulations are shown in Figure 6b. The specimen was assumed to be 50 nm thick. The Pb map was constructed from the addition of the Pb M4,5 and L2,3 chemical maps. The Sr map was constructed from K-shell ionizations. The simulations suggest that the interface is not atomically abrupt everywhere, since the experiment shows more mixing than is indicated by the simulation and that this mixing therefore cannot be accounted for by probe spreading or thermally scattered electrons. It is speculated that during specimen preparation, the focused ion beam may have caused “smearing” of some lead across the interface, resulting in the increased mixing of the signal.
Summary
We have reviewed the technique of atomic-resolution chemical mapping using energy-dispersive x-ray spectroscopy. New ultrasensitive energy-dispersive x-ray (EDX) detectors installed on microscopes with C s-correction have made possible the routine collection of high-quality EDX maps with atomic resolution. We have also discussed a theoretical framework and used it to carry out simulations that give insight into why we might expect that the EDX signal will generally correspond directly with the positions of atomic columns in the specimen. Good agreement between theory and experiment is demonstrated, and this suggests that quantification may be possible in the future. EDX chemical mapping is an incoherent mode of imaging, as is Z-contrast imaging, but with the advantage that chemical information is directly available for a range of different elements and x-ray peaks. A primary advantage of EDX mapping is the accessibility of higher energy-loss peaks and their associated increased localization. Used in tandem with Z-contrast imaging and/or chemical mapping using EELS, EDX provides complementary chemical information and further enhances the utility of scanning transmission electron microscopy, providing a powerful approach to investigate structural chemical and functional information at the atomic resolution for a wide variety of materials.
Acknowledgments
L.J.A. acknowledges support by the Australian Research Council. The authors thank M. Kurasawa, Y. Chen, and P.C. McIntyre from Stanford University for providing the SrTiO3/PbTiO3 sample.