


1 Introduction
In a squib in this journal, Patterson & Caponigro (Reference Patterson and Caponigro2015; hereafter P&C) claim based on an acceptability rating experiment that who free relatives (FRs) are rarely judged acceptable, and that the degree of unacceptability of who-FRs varies according to positional factors. This article challenges the former claim by exploring circumstances in which who-FRs can be judged highly acceptable, and shows that positional factors have more nuanced effects on the status of who-FRs than P&C report.
Free relatives are embedded non-interrogative wh-clauses that have the distribution and interpretation of DPs (Caponigro Reference Caponigro2003, Reference Caponigro and Young2004). To illustrate in (1), the embedded wh-clause what Samir cooked is an embedded interrogative in (a), but the FR complement of a DP-selecting predicate in (b), where it is interpreted like the definite DP in (c) (P&C: 341, ex. (1)):
(1)
(a) Ana wondered what Samir cooked.
(b) Ana tasted what Samir cooked.
(c) Ana tasted the stuff Samir cooked.
There is a puzzling asymmetry in English between FRs introduced by what versus who (Caponigro Reference Caponigro2003: 23). P&C found that who-FRs are always judged less acceptable than what-FRs, echoing passing claims in the literature that who-FRs are ungrammatical (Jespersen Reference Jespersen1927: 62; Bresnan & Grimshaw Reference Bresnan and Grimshaw1978: 340). Compared against sentences containing what-FRs like (2a), for example, P&C note that ‘the acceptability of analogous sentences containing who FRs in [(2b)] is degraded, often to the point of ungrammaticality’ (p. 341) (P&C: 342, exx. (2c), (3c)):
(2)
(a) [What Glenn said] didn't make much sense.
(b) [Who Glenn married] didn't make much money.
On the contrary, we show that who-FRs can be very highly acceptable, for instance, in some cases when a who-FR is the complement of a copula (3), or when who introduces a transparent free relative (TFR) (4):
(3) Looking through the mug shots, he suddenly proclaimed, ‘That's [who broke into my house]!’
(4) The authorities are interviewing [who they believe to be international drug dealers].
In outline, the next section sets the scene with some attested examples of who-FRs from contemporary professional and scripted writing. The core of the article discusses the results of a rating experiment designed to examine a wider range of who-FRs to explore how acceptable they can sound. Our experiment was inspired by P&C's and included their critical items, as outlined in section 3.1. Section 3.2 reports a new manipulation involving transparent free relatives (TFRs), which shows that who-TFRs degrade following a pattern analogous to P&C's standard who-FR items, while receiving higher ratings overall. Section 3.3 reports data on further factors that might affect the acceptability of who-TFRs – number and embedded subject position. Section 4 concludes. Appendix A reports ratings for sentences containing who-FRs – both standard and transparent – inspired by naturally occurring examples from the Web (see section 2), which were rated even higher than most of the constructed examples.
2 Attested examples of who-FRs
To begin, we observe that who-FRs are attested in contemporary professional writing. The following examples from magazines and novels are drawn from the Corpus of Contemporary American English (Davies Reference Davies2008–):Footnote 2
For famous, wealthy Black women, the ratio is even more startling – about one man for every 100 women. ‘You marry [who's available],’ emphasizes Dr. McAdoo, …
(Lynn Norment, ‘Guess who's coming to dinner now?’, Ebony 47(11), 1992: 48)
Once, before they came home, he dreamed that [who took Ben] was a witch, like in ‘Hansel and Gretel’.
(Jacquelyn Mitchard, The Deep End of the Ocean, New York: Penguin, 1996: 148)
I should, I should. I have never been good about that word. You can't love [who you should love], you can't stop loving [who you shouldn't].
(Louise Erdrich, ‘Line of credit’, Harpers Magazine 284(1703), 1992: 55)
‘In my house, this man I called to serve me was poisoned in my house!’ Pigeons in the cotes beneath the palazzo eaves fluttered as the great booming voice washed over them. Roused to anger, Il Cardinale was a marvel to behold, a true force of nature. ‘I will find [who did this].’
(Sara Poole, Poison: A novel of the Renaissance, New York: St Martin's Griffin, 2010: 5)
Who-FRs are also encountered in scripted television programming, including entertainment and news programming. (5a) is from the WB television series 7th Heaven, episode Monkey Business 1, which originally aired on 16 September 2002. (5b) was part of a CNN news report on 18 April 2003 (Caponigro Reference Caponigro2003: 23, exx. 34d, 34e):Footnote 3
(5)
(a) You are not gonna meet [who I am going out with].
(b) Abu Dhabi TV also released a separate audiotape of [who they claimed to be Saddam].
Given their attestation in professional writing – and our native-speaker judgments that all the examples in this section are perfectly acceptable – there seems to be further nuance to (the puzzle of) the degraded status of who-FRs in English. The rest of this article reports the results of an acceptability rating experiment inspired by P&C, designed to shed light on those nuances.
3 Position-dependent acceptability in who-FRs
3.1 P&C's original experiment
The first part of our experiment directly replicates P&C's finding that the relative (un)acceptability of who-FRs can depend on the internal and external distribution of the FR: both the configuration of the wh-dependency inside the FR and the position of the FR in the containing clause.
P&C used Amazon Mechanical Turk to collect acceptability judgments from native speakers on a scale from 1 (‘completely unacceptable’) to 7 (‘fully acceptable’). The relevant part of their experiment manipulated three factors:Footnote 4 (i) the wh-word introducing the FR (who, what); (ii) the syntactic position of the FR clause in the matrix clause (subject, direct object); and (iii) the syntactic position of the trace of the wh-word within the FR (subject or direct object). They tested three items like (6) containing who-FRs, with the combinations of factors (ii) and (iii) creating four conditions, each represented by one sentence token per item.Footnote 5
(6)
(a) The young woman kissed [FR who she met t ACC at the party].
(b) The young woman kissed [FR who t NOM met her at the party].
(c) [FR Who the young woman met t ACC at the party] kissed her on the way home.
(d) [FR Who t NOM met the young woman at the party] kissed her on the way home.
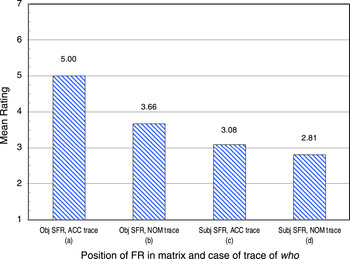
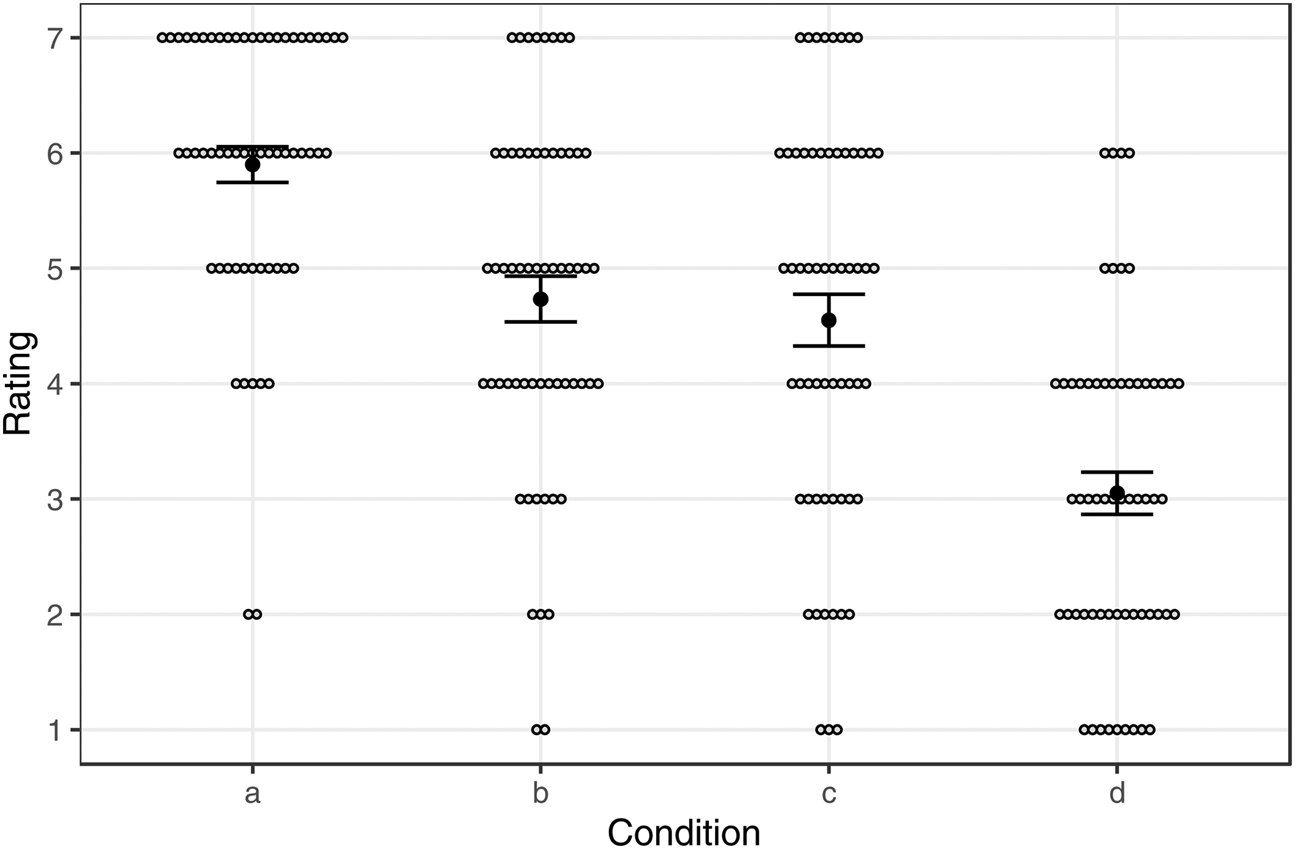
As shown in figure 1, P&C found when averaging over the items that condition (a), where the who-FR is the matrix object and the trace of who is the object of the relative clause, was rated much more acceptable than (b) and (c), which were in turn rated better than (d). What-FRs, by contrast, did not show any significant position-related pattern of degradation, and were all rated more acceptable than even the best who-FRs (e.g. (6a)):
P&C's ratings for their configurational manipulation of who-FRs

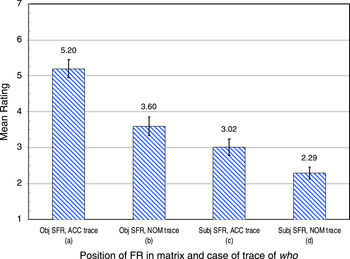
Using P&C's materials like (6), we replicated this general pattern for who-FRs as part of our own acceptability rating experiment, likewise conducted on Amazon Mechanical Turk using a 1–7 rating scale (and detailed in appendix B). This replication establishes that our experiment was sensitive to the same sorts of factors as P&C's – our subjects were not doing something wildly different from theirs. The mean ratings from our experiment are plotted in figure 2.
Our ratings for P&C's configurational manipulation of who-FRsFootnote 7

P&C reported a significant main effect of position, with object FRs ((a) and (b)) being rated higher than subject FRs ((c) and (d)), which we replicated: means 4.11 vs 2.94, t(178) = 4.39, p < .001. As for the effect of trace position, they reported that the difference between conditions (a) and (b) was significant, while the difference between conditions (c) and (d) was not. In our replication, both of these comparisons were significant: (a) vs (b): t(88) = 4.40, p < .001; (c) vs (d): t(88) = 2.59, p < .02.Footnote 6 Our finding a significant (c) vs (d) contrast where they did not does not reflect greater power in our design – P&C had 25 subjects rating each token in each condition while we had 15. It seems rather to reflect the lower mean rating attributed to (d) by our subjects.
Aside from (a), these ratings are quite low. However, all of P&C's stimulus sentences deliberately included ‘past tense, episodic verbal predicates in order to try to induce a specific interpretation of the FR, so avoiding the potential confounding factor of free choice readings (i.e. who FRs interpreted as whoever FRs), and thereby reducing the number of variables to be controlled in the study’ (p. 343).Footnote 8 Tense was one thing we changed in constructing our own experimental items, as introduced in the next subsection.
3.2 Transparent free relatives
We examined whether a wider range of who-FRs would reveal a wider range of acceptability.Footnote 9 We constructed four of our own quartets analogous to (6) that avoided (episodic) past tense, while still taking care to exclude whoever-type readings – by our native-speaker judgments, all of the critical items sound unacceptable with whoever in place of who. Our sentences received overall higher ratings than P&C's, while still conforming to their position-related pattern.
These items contained so-called ‘transparent’ free relatives (TFRs). There is debate as to the precise criteria distinguishing transparent from standard free relatives (SFRs) (see van Riemsdijk Reference Riemsdijk, Everaert and van Riemsdijk2017 for an overview). For our purposes, TFRs can be defined as FRs with the additional properties in (7):Footnote 10
(7) Transparent free relatives
(a) have the wh-word base-generated as a small clause subject
(b) can trigger plural verbal agreement
(c) receive an ‘indefinite’ interpretation
First and foremost, the base trace of the wh-word in a TFR must be in the subject position of a small clause (SC), as indicated in (8):
(8) John is watching [TFR whati he believes t i to be [SC t i raccoons]].
Second, TFRs can trigger plural verbal agreement, while SFRs cannot (9) (cf. McCawley Reference McCawley1988: 733). The SFR in (b) disallows a plural matrix verb even in a context where we know that I see multiple things that scare me:
(9)
(a) [TFR What seem to be [SC t raccoons]] are/*is eating our garbage.
(b) [SFR What I see t] scares/*scare me.
Third, while SFRs can receive only definite interpretations (recall (1)), TFRs receive ‘indefinite’ interpretations (Grosu Reference Grosu2016: 1247–8): they can be used in contexts where a headed relative paraphrase with an indefinite article sounds felicitous while one with a definite article does not. For example, out of the blue (8) seems to mean ‘John is watching (some) creatures he believes to be raccoons’, not ‘John is watching the creatures he believes to be raccoons’. Our experimental items use present tense to bring out such indefinite construals. Moreover, TFRs can appear as the associates in existential there sentences (10a), while SFRs generally give rise to ‘definiteness effects’ (10b):Footnote 11
(10)
(a) There were [TFR what could best be described [SC t as pebbles]] strewn across the lawn.
(b) *There is [SFR what you ordered t] on the desk. (Wilder Reference Wilder1999)
A fourth, widely assumed property of TFRs is that they can be introduced only by what (van Riemsdijk Reference Riemsdijk, Everaert and van Riemsdijk2017; cf. Wilder Reference Wilder1999), whereas SFRs can be introduced by the full range of wh-words (except why) (Caponigro Reference Caponigro2003). This supposed property of TFRs is challenged by the high acceptability of who-TFRs reported below and attested examples like those in section 2 – for additional counterarguments, see Schütze & Stockwell (Reference Schütze, Stockwell and Farrell2019).
While it is a defining syntactic property of TFRs that the base trace of the wh-word is a small clause subject, the structure above the small clause can render the chain of the wh-word more subject- or object-like. This is achieved in (11) using a raising-to-object structure in (a/c) and a raising-to-subject structure in (b/d). Thus the TFR item in (11) is broadly parallel to the one for P&C's SFRs in (6); in particular, the case features of the traces are the same:
(11)
(a) In a highly classified operation, the Secret Service is tracking [TFR who it suspects t ACC to be [SC t a female assassin]].
(b) In a highly classified operation, the Secret Service is tracking [TFR who t NOM is suspected to be [SC t a female assassin]].
(c) In a highly classified operation, [TFR who the Secret Service suspects t ACC to be [SC t a female assassin]] is being tracked.
(d) In a highly classified operation, [TFR who t NOM is suspected to be [SC t a female assassin]] is being tracked by the Secret Service.
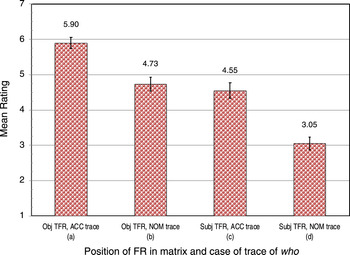
As displayed in figure 3, our subjects rated the four items containing TFRs like (11) higher overall than they did P&C's SFR items; this main effect was significant: means 4.56 vs 3.53, t(418) = 5.73, p < .001. Still, the condition ratings conformed to the same configurational pattern as in the previous subsection. Specifically, the same comparisons were significant. Object FRs ((a) and (b)) were rated higher than subject FRs ((c) and (d)): means 4.40 vs 2.66, t(178) = 7.05, p < .001. Trace position was likewise significant: (a) vs (b): t(88) = 4.40, p < .001; (c) vs (d): t(88) = 2.59, p < .015.Footnote 12
Ratings for our configurational manipulation of who-TFRs

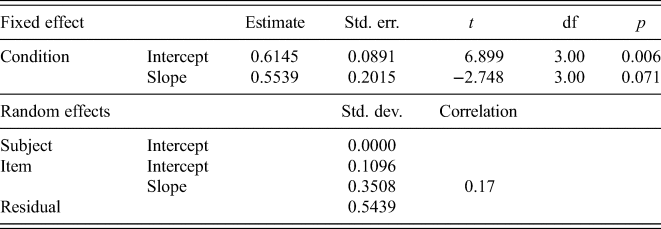
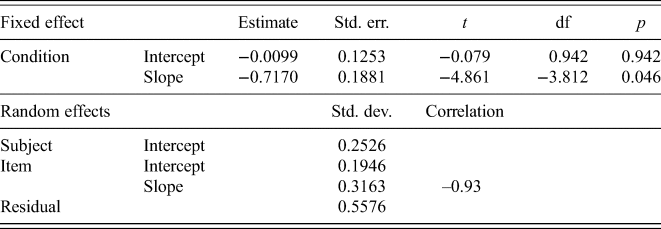
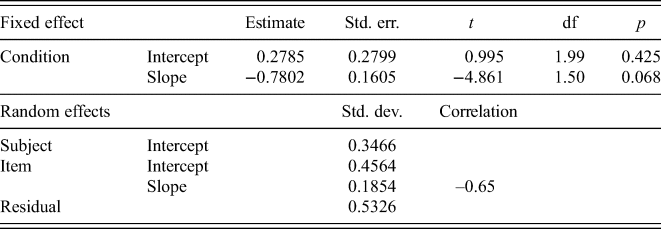
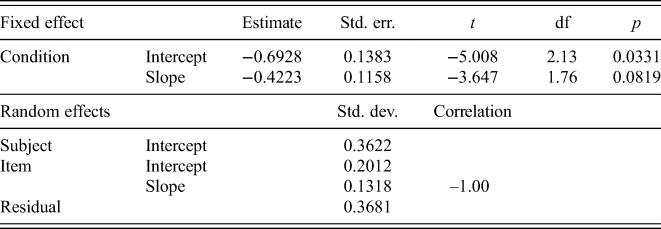
An analysis using a linear mixed effects model, conducted on z-scores, was performed on the data sets discussed in this and the previous subsection, with condition (a–d) as the fixed effect and subjects (intercepts only) and items (slopes and intercepts) as random effects, using the lme4 package (Bates et al. Reference Bates, Maechler, Bolker and Walker2015) in R (R Core Team 2018). We calculated p-values using the lmerTest package, which uses the Satterthwaite approximation for degrees of freedom (Kuznetsova et al. Reference Kuznetsova, Brockhoff and Christensen2017). For our TFRs, the (a) vs (b) comparison was marginal (means 0.614 vs 0.061, p = .071), while the (c) vs (d) comparison was significant (means −0.010 vs −0.727, p < .05). For P&C's SFRs, the (a) vs (b) comparison was marginal (means 0.291 vs −0.493, p = .068) and the (c) vs (d) comparison was also marginal (means −0.686 vs −1.106, p = .082). Full details of these analyses can be found in appendix B.4.
The reliability of the (c) versus (d) comparisons seriously challenges P&C's claim that ‘when who FRs are in subject position in the matrix clause, the position of the gap does not make a difference’ (p. 344). Furthermore, the mean rating of 4.55 for examples of type (11c) challenges P&C's conclusion that ‘subject position who FRs are crashingly bad, that is, they are deprecated below a minimal level of acceptability’ (p. 344).
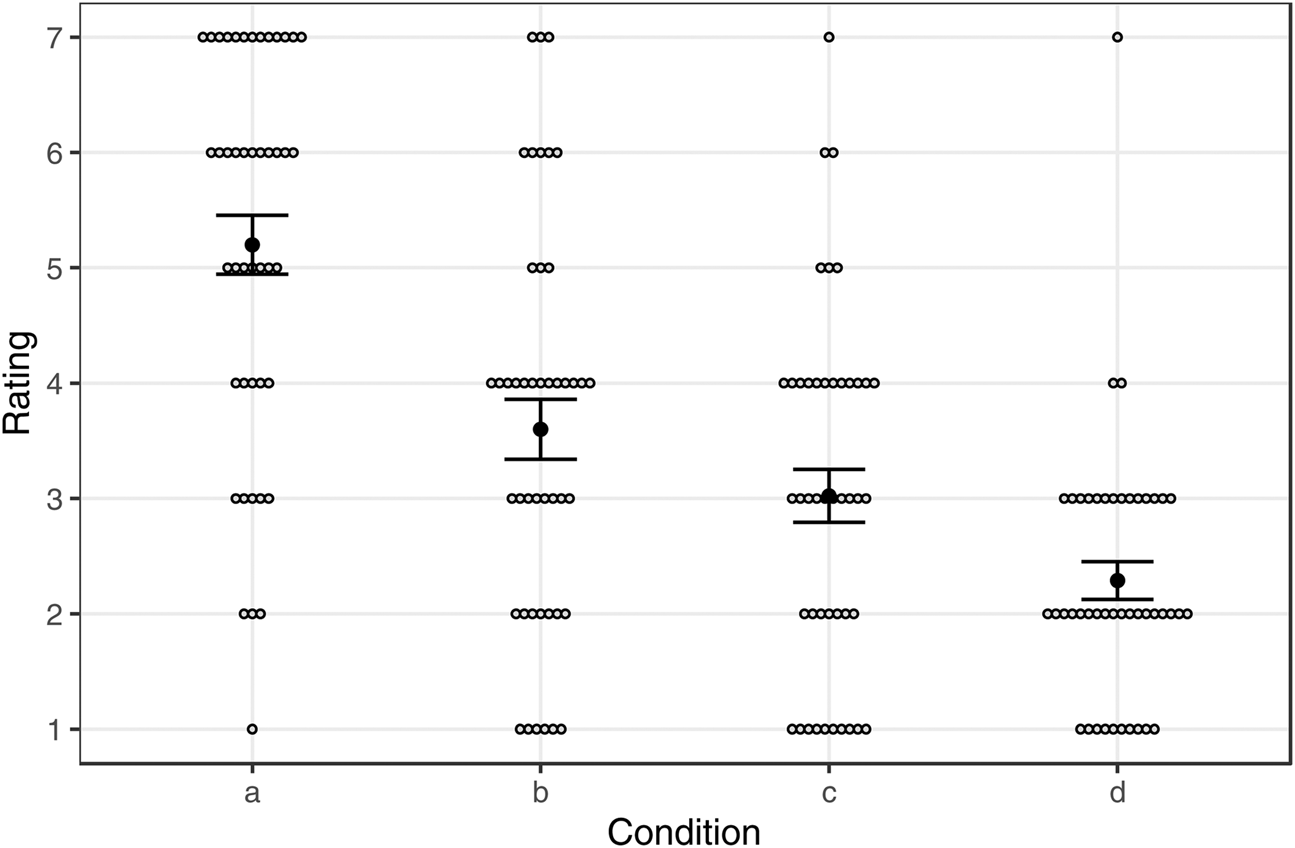
For additional insight, we plotted the distribution of individual responses in each of the conditions represented by a bar in figures 2 and 3. The results in figures 4 and 5, respectively, show an absence of bimodal distributions, hence the absence of a dialect split. That is, it is not true that sentences receiving mean ratings in the 2–5 range are the result of two underlying populations, one of which rates them fully acceptable and the other of which rates them fully unacceptable; rather, most subjects assigned an intermediate rating to these sentences. (For a more fine-grained examination, see appendix C.)
Distribution of our subjects’ responses to P&C's configurational manipulation of who-FRsFootnote 13

Distribution of our subjects’ responses to our configurational manipulation of who-TFRs

In sum, TFRs exhibit a parallel pattern of degradation to SFRs in terms of the position of the FR in the clause, and the configuration of the wh-dependency inside the FR. This finding bears on the theoretical debate regarding the nature of TFRs. According to Grosu (Reference Grosu2003, Reference Grosu2016), TFRs and SFRs have fundamentally the same structure. According to opposing views, TFRs have radically different structures from SFRs, involving amalgams with multiple dominance (cf. van Riemsdijk Reference Riemsdijk and Frascarelli2006) or parentheticals with ellipsis (Wilder Reference Wilder1999; cf. Schelfhout et al. Reference Schelfhout, Coppen, Oostdijk, Blaho, Vicente and Vos2004). The similar positional sensitivities of TFRs and SFRs are more consistent with Grosu's unified view.
Consequently, TFRs can be brought to bear on the acceptability of who-FRs. The ratings for who-TFRs in object position, especially with an acc trace, suggest that who-FRs can be highly acceptable. This point is explored more thoroughly in the final subsection, which steps beyond P&C's positional manipulations to illustrate other cases of acceptable who-FRs.
3.3 Further factors potentially affecting who-TFRs
Having established who-TFRs as candidates for relatively acceptable who-FRs, we considered two further manipulations beyond the configurational paradigm inspired by P&C. First, we asked whether who-TFRs triggering singular versus plural agreement might be systematically more acceptable. We constructed four minimal pairs like (12) that were identical except for the number of the predicate in the small clause and the agreeing verb. These sentences all consisted of an introductory clause followed by a there-existential clause of which the who-TFR was the associate – we suspected that the sequence ‘There be who’ at the beginning of a sentence might be jolting for the parser, so we avoided it:
(12)
(a) This show is a must-see; there's [TFR who critics have proclaimed t ACC to be [SC t a future star]] performing in it.
(b) This show is a must-see; there are [TFR who critics have proclaimed t ACC to be [SC t future stars]] performing in it.
Among these four pairs, one was rated higher in the singular version, while three were rated higher in the plural version.Footnote 14 As a group, there was no significant difference: singulars mean 3.79, plurals mean 3.99, t(148) < 1. Thus, there is no reason to think number systematically affects ratings of (at least existential) who-TFRs.
A second question concerned who-TFRs as subjects. In seeking to explore whether matrix subject position might be particularly awkward, we tested two sentences like (13) where a who-TFR (with an acc trace) is subject of an embedded clause – otherwise comparable to condition (c) of (11).
(13) It is well known that [TFR who teachers deem t ACC to be [SC t good students]] are eligible for special prizes.
These TFRs received a mean rating of 5.23, as compared to 4.55 for the (11c) condition, a significant difference: t(58) = 2.93, p < .005. Thus there are exceptions to P&C's claim – based on their best subject position who-FRs having a mean of 3.08 – that ‘who FRs in subject position … are deemed to be particularly unacceptable by native speakers’ (p. 343); see also their ‘crashingly bad’ comment in the previous subsection.
4 Conclusion
In sum, this article replicated P&C's finding that configurational factors can lead to variation in the acceptability of who-FRs: in certain circumstances, who-FRs sound better as objects than subjects (though the designs preclude rigorously confirming this) and better with acc than nom traces – significantly so even in subject position, we found.Footnote 15
As P&C note, the (positional) degradation of who-FRs is specific to English and to the word who and does not easily submit to a syntactic, semantic, or processing explanation. Cross-linguistically, who-FRs are attested in many languages, including Italian, Spanish and German (P&C: 342, ex. (5)). Further, who exhibits almost identical syntactic behavior to what, while any semantic or processing problem – perhaps based on the animacy difference between who vs what – would be expected to extend cross-linguistically.Footnote 16
With this article, we have reached a more nuanced picture of when who-FRs are degraded in English. The fact to be explained is not why all who-FRs are degraded in English, but why only a subset of who-FRs are. This may make an explanation easier or harder to find – a task we leave for future research.
Appendix A: Naturalistic who-FRs
Echoing the attested examples presented in section 2, this appendix reports ratings for sentences containing who-FRs – both standard and transparent – inspired by naturally occurring examples from the Web. These were averaged across two pilots of the experiment reported in section 3, whose stimuli included a number of free relatives, similar and in some cases identical to those in the current experiment, and many of the same fillers from an unrelated experiment. Each sentence was rated by a total of 120 participants; standard deviations are in parentheses. We did not include these stimuli in later runs because the ratings were all above 6 – higher than the vast majority of constructed examples.Footnote 17 Where P&C claimed that there are ‘few cases of who FRs that do approach acceptability’ (p. 345), these sentences approach the top of the rating scale. Interestingly, most contain a nom trace, as was also true of the literary examples in section 2. This challenges P&C's claim that object position who-FRs with acc traces are unique in being (marginally) acceptable: ‘Acceptability improves if (i) the who FR occurs as the direct object … rather than in subject position of the matrix clause …; and (ii) the gap in the relative clause is also in object position’ (p. 344). As a point of reference, the best of the examples below was rated just 0.08 below our best grammatical catch item – the simple monoclausal (14):
(14) She was the winner of the grand prize. 6.97 (0.18)
First, who-TFRs:
(15) After the collision, Rhonda was rescued by [TFR who she assumes t NOM was [SC t a highway patrol officer]].Footnote 18 6.39 (0.96)
(16) I once saw [TFR who I thought t NOM was [SC t Robert Redford]] at a Starbucks.Footnote 19 6.28 (1.17)
(17) I was chilling at the bar when I looked over and saw [TFR who I was sure t NOM was [SC t my ex]] staring at me.Footnote 20 6.08 (1.09)
Second, who-SFRs that are complements to a copula (and are incompatible with an -ever meaning):
(18) Looking through the mug shots, he suddenly proclaimed, ‘That's [SFR who t NOM broke into my house]!’Footnote 21 6.86 (0.44)
(19) He's not necessarily [SFR who you want t ACC] if you're trying to get the job done quickly.Footnote 22 6.44 (1.13)
Third, who-SFRs that are complements to non-copulas, which may be compatible with one of the two readings of -ever FRs (Dayal Reference Dayal and Lawson1997) – the ‘identity’ reading in (20), where the FR refers to a unique person whose identity is unknown; and the ‘free choice’ reading in (21) and (22), where there is indifference as to any characteristics of the applicants beyond the one defined by the FR predicate:
(20) I hope that the authorities find [SFR who t NOM killed her].Footnote 23 6.78 (0.54)
(21) I didn't bother with interviews, I just hired [SFR who you told me to hire tACC].Footnote 24 6.54 (0.97)
(22) I selected [SFR who I thought t NOM was most qualified for the job].Footnote 25 6.88 (0.35)
Appendix B: Experimental details
B.1 Participants
The data in this article are from 60 self-reported native speakers of American English recruited via Amazon Mechanical Turk. Subjects were paid $5.00 (US) for their participation. (Data from an additional twelve subjects were excluded due to high ratings (≥ 5) on two or more of the eight ungrammatical catch trials.)
B.2 Procedure
Subjects were presented with instructions, followed by five example sentences accompanied by suggested ratings, intended to anchor the response scale. Each subject then rated 54 sentences on a scale from 1 (‘very bad’) to 7 (‘very good’). Most subjects completed the experiment in 15–20 minutes.
B.3 Materials
The 54 sentences consisted of 10 catch trials (8 ungrammatical), one token each from 17 relative clause (RC) items, and one token each from 27 filler items representing other experiments.Footnote 26 Each subject saw one of four lists, whose order was individually randomized. Catch trials were the same across all lists, but RC and filler trials differed so that a subject did not see different conditions of one item. The 17 RC items included 13 critical items reported in the main text and listed in appendix C, consisting of 3 quartets containing who-SFRs from P&C; 4 quartets containing who-TFRs from a paradigm modeled on that of P&C; 4 pairs testing the effect of number; and 2 additional items containing who-TFRs in embedded subject position.
B.4 Analyses
All Student's t tests reported in the main text were conducted on raw ratings, but the same tests have also been conducted on z-scores, calculated based on each subject's responses to all 54 sentences in the experiment. This procedure eliminates some potential confounds that could arise from subjects using the response scale differently; the results (significance or non-significance) were the same as those reported in the main text in all cases.
These z-scores also constituted the data on which the linear mixed effects analyses reported in section 3.2 were conducted. Details of those analyses are presented in tables A1–4.
Lmer model summary for our TFRs, conditions a vs b

Lmer model summary for our TFRs, conditions c vs d

Lmer model summary for P&C's SFRs, conditions a vs b

Lmer model summary for P&C's SFRs, conditions c vs d

Appendix C: Critical stimuli and plots
C.1 Materials from section 3.1
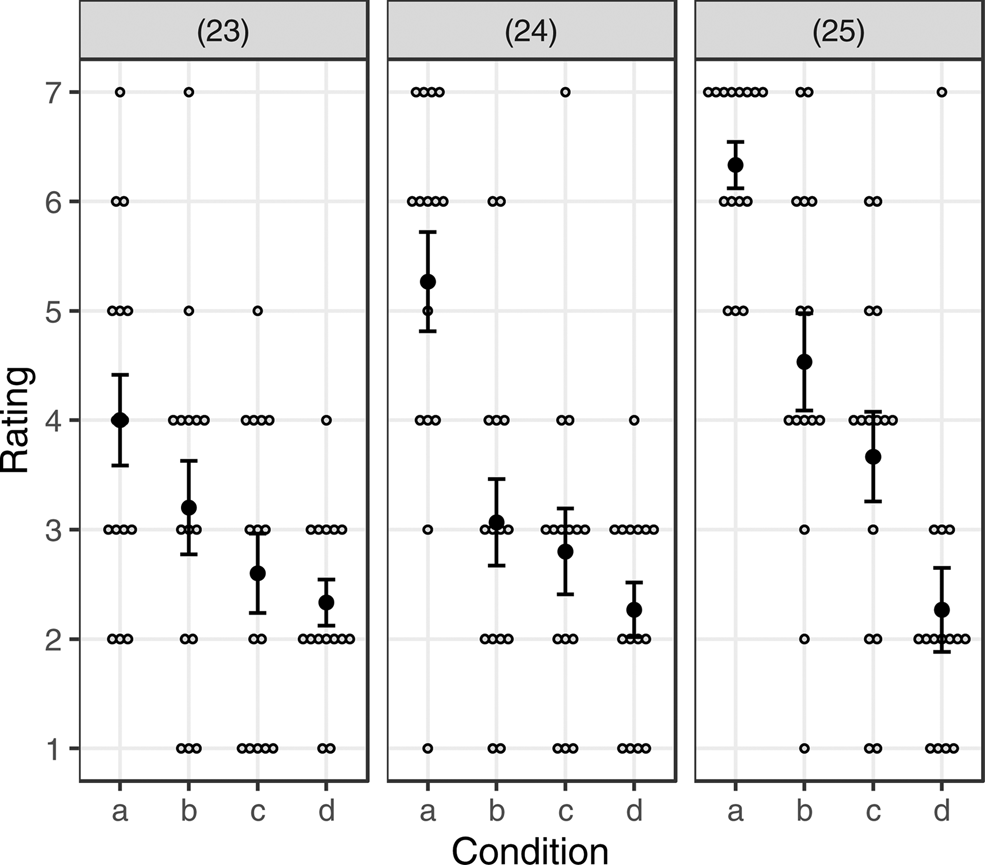
(23)
-
(a/b) The young woman kissed who {she met/met her} at the party.
-
(c/d) Who {the young woman met/met the young woman} at the party kissed her on the way home.
-
(24)
-
(a/b) The music teacher married who {he dated/dated him} at college.
-
(c/d) Who {the music teacher dated/dated the music teacher} in college married {her/him} yesterday.
-
(25)
-
(a/b) The {skilled sniper/angry teenager} hit who {he was targeting/insulted him}.
-
(c/d) Who {the angry teenager insulted/insulted the angry teenager} at the party hit him {back/afterwards}.
-
Figure A6 shows the distribution of individual responses by our subjects to each of P&C's SFR quartets. While the small sample sizes make any conclusions highly speculative, the plots do at least raise questions that could be pursued in future research. For one, they show an occasional hint of bimodality, e.g. for (23c) between total rejection and middling acceptance. They also show much greater inter-item variability in object versus subject position.
Distribution of our subjects’ responses to items (23)–(25)

C.2 Materials from section 3.2
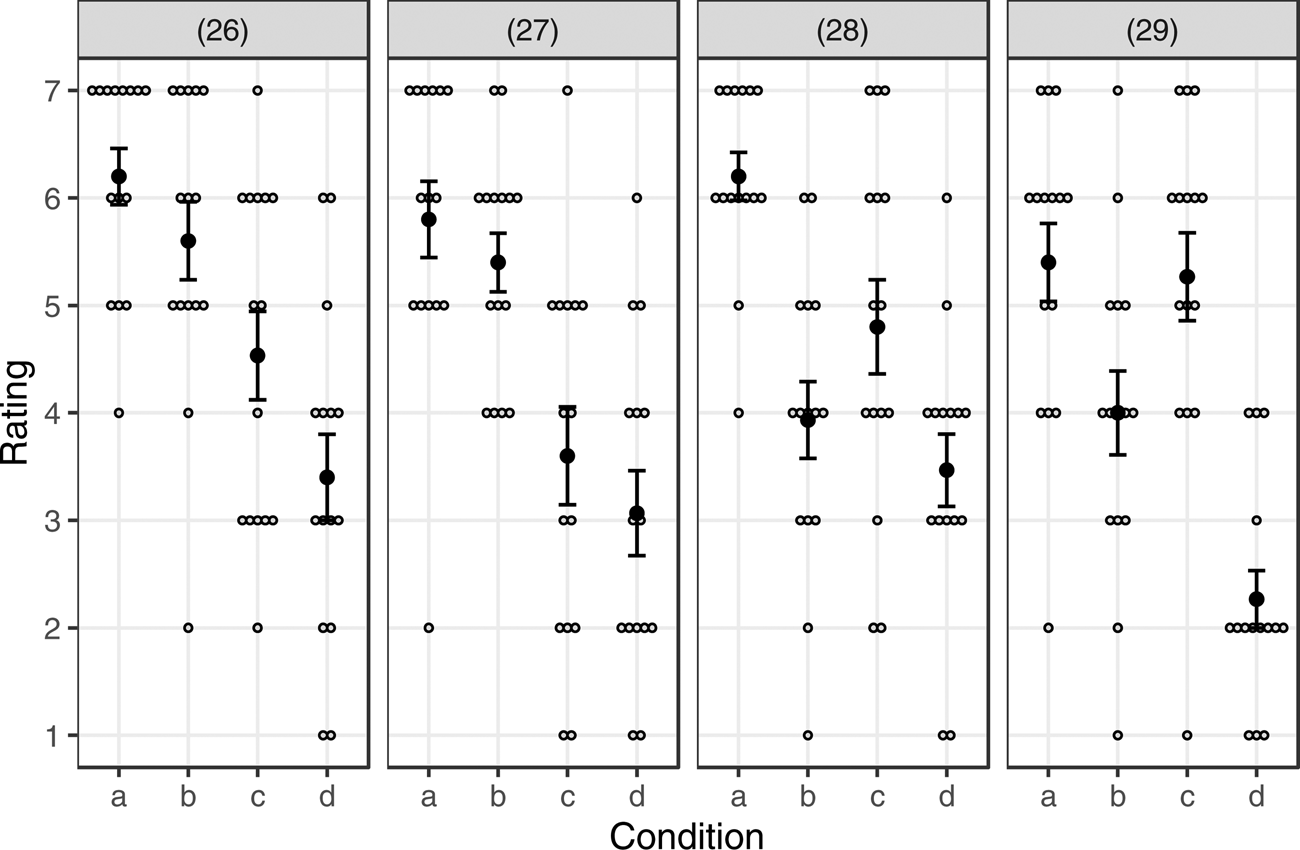
(26)
-
(a/b) In a highly classified operation, the Secret Service is tracking who {it suspects/is suspected} to be a female assassin.
-
(c/d) In a highly classified operation, who {the Secret Service suspects/is suspected} to be a female assassin is being tracked{./ by the Secret Service.}
-
(27)
-
(a/b) Despite the fog, I can just discern who {I assume/are likely} to be paratroopers in the distance.
-
(c/d) Despite the fog, who {I assume/are likely} to be paratroopers are just discernible in the distance.
-
(28)
(a/b) The authorities are interviewing who {they believe/are believed} to be international drug dealers.
(c/d) Who {the authorities believe/are believed} to be international drug dealers are being interviewed{./ by the authorities.}
(29)
(a/b) The politician is inviting who {he sees as/seems to him to be} a major potential donor to the fundraiser.
(c/d) Who {the politician sees as/seems to the politician to be} a major potential donor is being invited to the fundraiser.
Figure A7 shows the distribution of individual responses by our subjects to each of our TFR quartets. Again there is a hint of bimodality, e.g. for (26c). Strikingly, the means show two different patterns, with (b) rated worse than (c) in (28) and (29) but vice versa in (26) and (27); post hoc speculation might pin the blame on who are believed in (28b) and to him in (29b).
Distribution of our subjects’ responses to items (26)–(29)

C.3 Materials from section 3.3
Singular vs plural agreement
(30) The debate is heating up; {there's/there are} who conservatives have dubbed {a ‘feminazi’/‘feminazis’} due to speak next.
(31) This show is a must-see; {there's/there are} who critics have proclaimed to be {a future star/future stars} performing in it.
(32) There's a clear generational divide; {there's/there are} who older people will perceive as {a radical/radicals} running for office.
(33) The rally is getting a lot of press; {there's/there are} who columnists have portrayed as {a leading candidate/leading candidates} giving {a speech/ speeches}.
Fn. 14 (ratings from an earlier run of the experiment)
(34) Gentrification is getting worse;
(a) there's who locals refer to as a yuppie developer with plans for the neighborhood. 4.60
..................................................... (b) there is who locals refer to … 4.47
..................................................... (c) there's who the mayor refers to … 4.33
..................................................... (d) there is who the mayor refers to … 4.07
Embedded subjects
(35) It is well known that who teachers deem to be good students are eligible for special prizes.
(36) We hear on the news all too often that who the FBI initially labeled as suspects were eventually released for lack of evidence.