
1. Introduction
Surface gravity waves in shallow waters often travel over random bottom topography composed of disorganised bedforms or coarse sediments, e.g. gravel or sand. These small-scale features act as hydrodynamic roughness in the wave boundary layers developing over them. While in fully developed turbulent wave boundary layers the effect of roughness is usually well parameterised using classical concepts, e.g. Nikuradse roughness and logarithmic velocity profile, there are relatively few studies addressing the transitional regimes beneath mild waves. Such random topography-induced transition is complicated and its building steps are not well understood. Using direct numerical simulations (DNS), the present work investigates the mechanics of boundary layer transition over a random bed topography beneath a solitary wave, which can be viewed as a simple reproducible prototype for long regular waves in the shoaling zone (e.g. Munk Reference Munk1949). The primary objective of this study is to establish direct links between topography and precursor structures of transition and subsequent transition modes. The bed is modelled as randomly organized wave-like corrugations and its geometry is well resolved by conducting DNS on a transformed coordinate system.
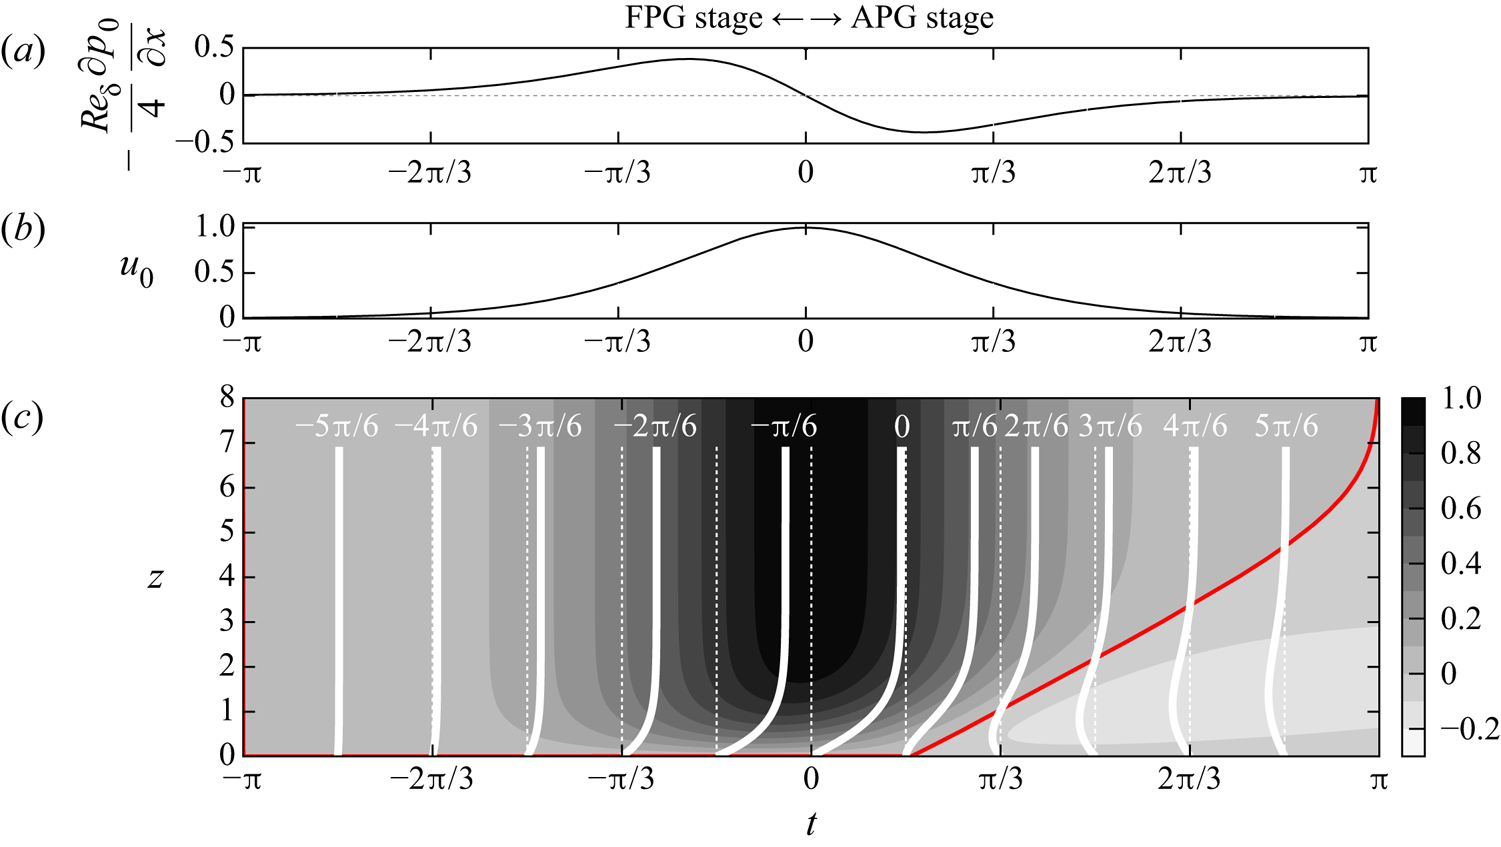
A solitary wave is a symmetric long wave with a single crest. It imposes an approximately constant horizontal velocity across the water column. A given point beneath an approaching wave experiences successive stages of accelerating and decelerating onshore velocities (figure 1 $b$) driven by favourable and adverse pressure gradients (FPG and APG), cf. figure 1(
 $a$). Unlike the irrotational flow above, the near-bed velocity in the boundary layer begins to decelerate at the end of the FPG stage and eventually reverses its direction at the beginning of the APG stage (Liu & Orfila Reference Liu and Orfila2004; Liu, Park & Cowen Reference Liu, Park and Cowen2007), cf. figure 1(
 $c$). In this process the adverse pressure gradient and frictional forces give rise to inflectional velocity profiles rendering the flow linearly unstable above critical wave amplitudes (Blondeaux, Pralits & Vittori Reference Blondeaux, Pralits and Vittori2012; Sadek et al. Reference Sadek, Parras, Diamessis and Liu2015). As a result, two-dimensional instability waves can develop and grow into coherent spanwise vortex rollers with regular spacing (Sumer et al. Reference Sumer, Jensen, Sørensen, Fredsøe, Liu and Carstensen2010). For higher wave amplitudes, these coherent vortices themselves are unstable and break into small-scale turbulence (Vittori & Blondeaux Reference Vittori and Blondeaux2008; Ozdemir, Hsu & Balachandar Reference Ozdemir, Hsu and Balachandar2013). Scandura (Reference Scandura2013) showed in a two-dimensional numerical setting that the instability waves and coherent vortices can also be generated by wall imperfections of small amplitude.
Temporal variation of the flow fields at a fixed location beneath a passing solitary wave. (a) Pressure gradient. Two stages are defined: (i) favourable pressure gradient (FPG) stage ( $t<0$); (ii) adverse pressure gradients (APG) stage (
 $t>0$). (b) Irrotational (free-stream) velocity above the solitary wave boundary layer (SWBL). (c) Velocity
 $u$ in the laminar SWBL. Vertical profiles of
 $u$ at phases
 $t=\{-5{\rm \pi} /6,-4/{\rm \pi} 6,\ldots ,5{\rm \pi} /6\}$ are overlaid on contours. The red contourline is the level
 $u=0$. The definitions for free-stream fields and normalizations for lengths, velocities, pressure and time are introduced in § 2.1.

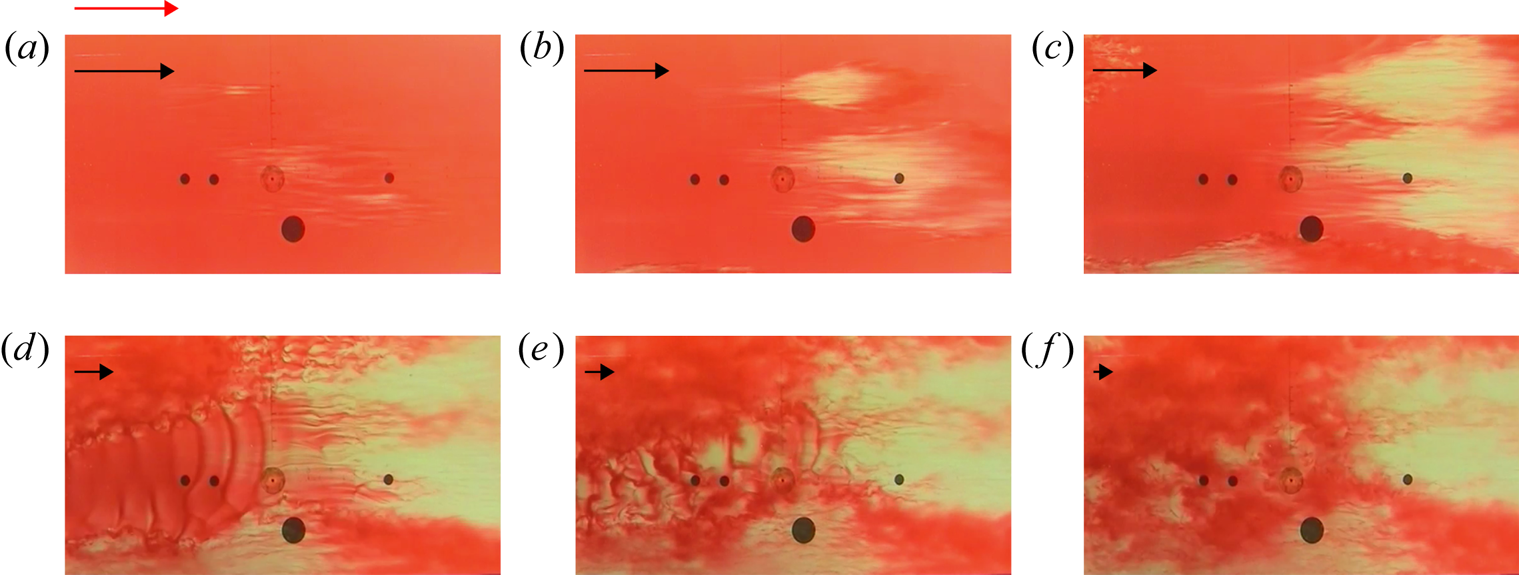
The orderly two-dimensional path to transition is often accompanied or ‘bypassed’ by transitional features of a more disorganised stochastic nature, i.e. turbulent spots. Sumer et al. (Reference Sumer, Jensen, Sørensen, Fredsøe, Liu and Carstensen2010) studied the solitary wave boundary layer (SWBL) in an oscillatory water tunnel and turbulent spots were the first turbulent features emerging in such a flow. They were initially observed after the flow reversal in the APG stage. With increasing Reynolds number (to be defined in § 2.1) the spots were nucleated in earlier phases. A mixed transition scenario is demonstrated in figure 2 using a sequence of video frames from the APG stage (cf. supplementary movie 3 in Sumer et al. Reference Sumer, Jensen, Sørensen, Fredsøe, Liu and Carstensen2010). Turbulent spots emerge at the early APG stage and start to grow, cf. figure 2(a–c). Before they spread everywhere in the boundary layer, coherent vortex rollers spontaneously emerge in the laminar regions surrounding the spots (figure 2 $d$). The rollers quickly become unstable (figure 2
 $e$) and break into smaller scales, which completes the transition to turbulence (figure 2
 $f$).
A sequence of video frames illustrating the transition modes in a SWBL at  $Re_\delta =1483$: (
 $a$) streamwise streaks; (
 $b$–
 $f$) turbulent spots; (d–f) spanwise vortex rollers. The frames are extracted from the supplementary movie 3 in Sumer et al. (Reference Sumer, Jensen, Sørensen, Fredsøe, Liu and Carstensen2010) and reproduced with permission from Cambridge University Press. Black arrows demonstrate the decelerating free-stream velocity. The red arrow in (
 $a$) indicates maximum free-stream velocity. Time is normalized using the wave frequency, i.e.
 $t=t^*\omega ^*$ (cf. § 2.1). Video frames at (a)
 $t = 0.2$. (b)
 $t = 0.46$. (c)
 $t = 0.72$. (d)
 $t = 1.07$. (e)
 $t = 1.24$. (f)
 $t = 1.47$.

Compared with the linear stability theory for instability waves, the theory behind the onset of turbulent spots is much less established and is largely phenomenological (Durbin Reference Durbin2017). This stochastic transition path is initiated by the receptivity of the flow to finite-amplitude external perturbations such as bottom roughness or free-stream turbulence. The boundary layer flow amplifies these perturbations and develops streamwise-elongated regions of streamwise velocity fluctuations, termed as streaks. The early stages of streak amplification is usually explained mathematically by linear non-modal growth theory (Butler & Farrell Reference Butler and Farrell1992; Trefethen et al. Reference Trefethen, Trefethen, Reddy and Driscoll1993). Physically, the streaks are generated by streamwise-oriented vortices stirring the streamwise momentum across the boundary layer, an effect knows as the lift-up mechanism (Landahl Reference Landahl1980). Once the streaks reach high amplitudes, the boundary layer becomes strongly corrugated along its span and each streak hosts inflectional velocity profiles across vertical and spanwise cross-sections. As a result, streaks become susceptible to inviscid instabilities (Andersson et al. Reference Andersson, Brandt, Bottaro and Henningson2001; Cossu & Brandt Reference Cossu and Brandt2002). The most energetic streaks locally broke down due to these secondary instabilities, and the formation of turbulent spots begins (Vaughan & Zaki Reference Vaughan and Zaki2011). Several streaks prior to the formation of turbulent spots can be seen in figure 2( $a$).
Unlike oscillatory boundary layers (e.g. Carstensen, Sumer & Fredsøe Reference Carstensen, Sumer and Fredsøe2012; Biau Reference Biau2016; Mazzuoli & Vittori Reference Mazzuoli and Vittori2016, Reference Mazzuoli and Vittori2019), only a few studies focused to date on the stability characteristics of SWBLs in the presence of finite-amplitude perturbations. Verschaeve, Pedersen & Tropea (Reference Verschaeve, Pedersen and Tropea2017) studied linear non-normal growth in the SWBL. They showed that initial perturbations in the form of streamwise-constant counter-rotating vortex pairs can strongly amplify streamwise-constant streaks in the FPG stage with a maximum growth proportional to the square of the Reynolds number. Later in the APG stage, the non-normal growth of streaks is dominated by the non-normal growth of two-dimensional instability waves, which grow exponentially in Reynolds number. Önder & Liu (Reference Önder and Liu2020) modelled external perturbations as distributed body forces and analysed the receptivity of the SWBL to these perturbations in a linear framework. They also identified streamwise-constant vortices as the most effective perturbations to generate streaks. They further deployed these optimal perturbations into nonlinear governing equations and analysed the stability of the SWBL for various perturbation magnitudes. The resulting streaks have been found to play a dual role in the boundary layer stability. Low-to-moderate amplitude streaks have a dampening effect and delay the transition in the APG stage. In contrast, if the streaks are strongly amplified and elevated deep into the free stream, they can develop sinuous oscillations and initiate a bypass-transition scenario in the FPG stage.
In the present work we focus on a natural bypass-transition scenario, in which a solitary wave passes over random bottom topography containing wave-like undulations of finite amplitude. Particular attention is paid to the receptivity stage, where broadband perturbations introduced by irregular bottom roughness is filtered by the SWBL and converted into energetic streamwise streaks. The linear and nonlinear stages of the phenomenon are identified with special emphasis on dynamic feedback mechanisms between streamwise streaks and vortices. In the last step, the various transition paths to turbulence are illustrated for different roughness heights.
The paper is organized as follows. First, the SWBL model along with the bottom topography function will be introduced in § 2.1. Subsequently, numerical details of DNS will be presented in § 2.2. The analysis of results consists of two parts. In § 3 we will first focus on the boundary layer response to bottom perturbations. The generation of streaks will be analysed in detail in this section. Subsequently, in § 4 various transition scenarios will be investigated. Finally, conclusions will be summed up in § 5.
2. Methodology
2.1. Flow configuration
We consider a SWBL model in which streamwise scales are much larger than vertical scales such that a parallel boundary layer model can be applied. Consequently, the irrotational velocity (free-stream velocity hereafter) in this model depends only on time, i.e.
 \begin{equation} u_0^*(t^*)=U_{0m}^*\mathrm{sech}^2({\omega^*t^*}), \end{equation}
where  $\omega ^*$ is the effective wave frequency. The wave event takes place in
 $-\infty < t^* < \infty$ with maximum free-stream velocity
 $U_{0m}^*$ occurring at time
 $t^*=0$. The reader is referred to Önder & Liu (Reference Önder and Liu2020) for the relation of these quantities to wave parameters. Using the wave frequency and kinematic viscosity, the Stokes length
 \begin{equation} \delta_s^{*}=\sqrt{{2\nu^{*}}/{\omega^{*}}} \end{equation}
is defined as the length scale of the boundary layer and employed in the definition of the Reynolds number
 \begin{equation} Re_\delta=\frac{U_{0m}^*\delta_s^{*}}{\nu^{*}}. \end{equation}
The problem is defined in a Cartesian coordinate system  $\boldsymbol {x}^*=(x^*,y^*,z^*)$, where
 $x^*$ is the direction of wave propagation (also called streamwise direction),
 $y^*$ is the spanwise direction parallel to wave crest and
 $z^*$ is the vertical direction extending from the bed upwards. The velocity components associated with these directions are
 $\boldsymbol {u}^*=(u^*, v^*,w^*)$. We introduce the following normalizations to the spatial coordinates, time, velocity and pressure fields, respectively:
 \begin{equation} \boldsymbol{x}=\boldsymbol{x}^*/\delta_s;\quad t=t^*\omega^*;\quad \boldsymbol{u} = \boldsymbol{u}^*/U_{0m}^*;\quad p=p^*/\rho^*U_{0m}^{*2}. \end{equation}
The non-dimensional pressure gradient satisfying the free-stream momentum balance is given by
 \begin{equation} {-}\frac{\partial p_0}{\partial x}=\frac{4}{Re_\delta}\mathrm{sech}^2(t)\mathrm{tanh}({-}t). \end{equation}
This pressure gradient drives the incompressible Navier–Stokes equations, which, together with the continuity equation, represent the governing equations for the three-dimensional instantaneous velocity in the boundary layer
 \begin{gather} \frac{2}{Re_\delta}\frac{\partial u_i}{\partial t}+u_j \frac{\partial u_i}{\partial x_j}=\frac{1}{Re_\delta} \frac{\partial^2 u_i}{\partial x_j\partial x_j}-\frac{\partial p}{\partial x_i}-\frac{\partial p_0}{\partial x_{1}}\delta_{i1}, \end{gather}
 \begin{gather}\frac{\partial u_i}{\partial x_i}=0, \end{gather}
where summation over repeated indices are applied, and subscripts correspond to  $(u_1,u_2,u_3)=(u,v,w)$ and
 $(x_1,x_2,x_3)=(x,y,z)$.
At the bottom boundary, we consider a random topography parameterized by the roughness height  $h$, and the grain sizes
 $l_x$ and
 $l_y$ in the streamwise and spanwise directions, respectively. For specified
 $h,$
 $l_x$ and
 $l_y$, an ensemble of bottom topographies
 $\eta ^{\{r\}}(r=1,\ldots ,R)$ can be generated using a set of statistically independent topography functions
 $\mathcal {W}^{\{r\}}(r=1,\ldots ,R)$, i.e.
 \begin{equation} \eta^{\{r\}}(x,y)=h \mathcal{W}^{\{r\}}(x,y;l_x,l_y), \end{equation}
where  $\mathcal {W}^{\{r\}}$ is defined as the sum of two-dimensional sinusoidal modes equipped with random amplitudes
 $\boldsymbol {A}^{\{r\}}$ and phases
 $\boldsymbol {\phi }^{\{r\}}$, i.e.
 \begin{equation} \mathcal{W}^{\{r\}} (x,y;l_x,l_y)= \sum_{n=0}^{L_x/l_x}\sum_{m={-}L_y/l_y}^{L_y/l_y} A_{nm}^{{\{r\}}} \cos\left (\frac{2{\rm \pi} n x}{L_x}+\frac{2{\rm \pi} m y}{L_y}+\phi_{nm}^{\{r\}}\right). \end{equation}
Here, the grain sizes  $l_x$ and
 $l_y$ are specified as the cut-off wavelengths, and
 $L_x$ and
 $L_y$ are the length of the domain in the streamwise and spanwise directions, respectively. Here
 $L_x$ and
 $L_y$ are enforced to be integer multiples of
 $l_x$ and
 $l_y$. We have normalized the amplitudes such that their Euclidean norm is unity, i.e.
 $\| {\boldsymbol {A}^{\{r\}}}\|=1$ and the mean mode is set to zero (
 $A_{00}^{\{r\}}=0$). A similar bottom model was applied in Vittori & Verzicco (Reference Vittori and Verzicco1998) to represent bottom imperfections in an oscillatory boundary layer. Vittori & Verzicco considered very small
 $h$, and modelled the wall using a Neumann boundary condition derived from the first-order Taylor expansion. In the present work,
 $h$ is not restricted to very small values and the corrugations are fully represented using coordinate transformation, cf. § 2.2 for details.
The flow data at a time instant  $t$ can be analysed by combining ensemble averaging with horizontal-plane averaging, i.e. for a generic variable
 $\varphi$,
 \begin{equation} \langle {\varphi} \rangle(z,t)=\frac{1}{RL_xL_y}\sum_{r=1}^{R}\int_0^{L_x}\int_0^{L_y} {\varphi}^{\{r\}}(x,y,z,t)\,{\textrm{d}x}\,{\textrm{d}y}, \end{equation}
where  $\varphi ^{\{r\}}(r=1,\ldots ,R)$ are the realizations obtained over the topographies
 $\mathcal {\eta }^{\{r\}}(r=1,\ldots ,R)$. Streamwise and spanwise averaging can be similarly combined with ensemble averaging using the operators
 $\langle \varphi \rangle _x$ and
 $\langle \varphi \rangle _y$. When we need to distinguish the plane averaging in a single realization from ensemble averaging (2.10), we will use
 $\langle {\varphi }^{\{r\}} \rangle$ instead of
 $\langle {\varphi } \rangle$. For simplicity, we will drop the superscript
 ${\{r\}}$, when we refer to instantaneous fields, or when a case has only single realization (
 $R=1$). We denote the instantaneous fluctuating fields as
 $\varphi ^\prime =\varphi -\langle \varphi \rangle$.
For the present flow configuration, the transition scenario depends on four parameters:  $Re_\delta$,
 $h$,
 $l_x$ and
 $l_y$. In this study we investigate the receptivity and transition by varying the roughness height between
 $h=0.01$ and
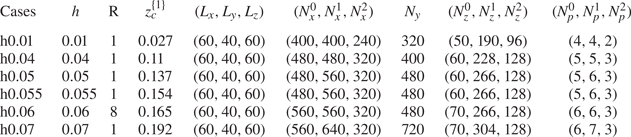
 $0.07$. The details of cases are given in table 1. The Reynolds number is set to
 $Re_\delta =2000$. This is the highest Reynolds number in Sumer et al. (Reference Sumer, Jensen, Sørensen, Fredsøe, Liu and Carstensen2010), where turbulent spots mediated the transition to turbulence in the corresponding case. We will show that a rich variety of transition scenarios are possible at this Reynolds number depending on the roughness height.
Summary of cases. In all cases  $Re_\delta =2000$. We denote by
 $h$ the roughness height and
 $L_x$,
 $L_y$ and
 $L_z$ the dimensions of the computational domain. Three subdomains defined in the vertical direction (see text for details). Here (
 $N_x^0$,
 $N_x^1$,
 $N_x^2$) and
 $(N_z^0,N_z^1,N_z^2)$ are the number of grid points in each subdomain in the horizontal and vertical directions, respectively,
 $N_p$ is the polynomial orders of high-order finite elements,
 $R$ is the number of realizations over different topography functions
 $\mathcal {W}^{\{r\}}(r=1,\ldots ,R)$, cf. (2.8) and (2.9), and
 $z_c^{\{1\}}=h\max \{\mathcal {W}^{\{1\}}\}$ is the highest elevation over the topography function
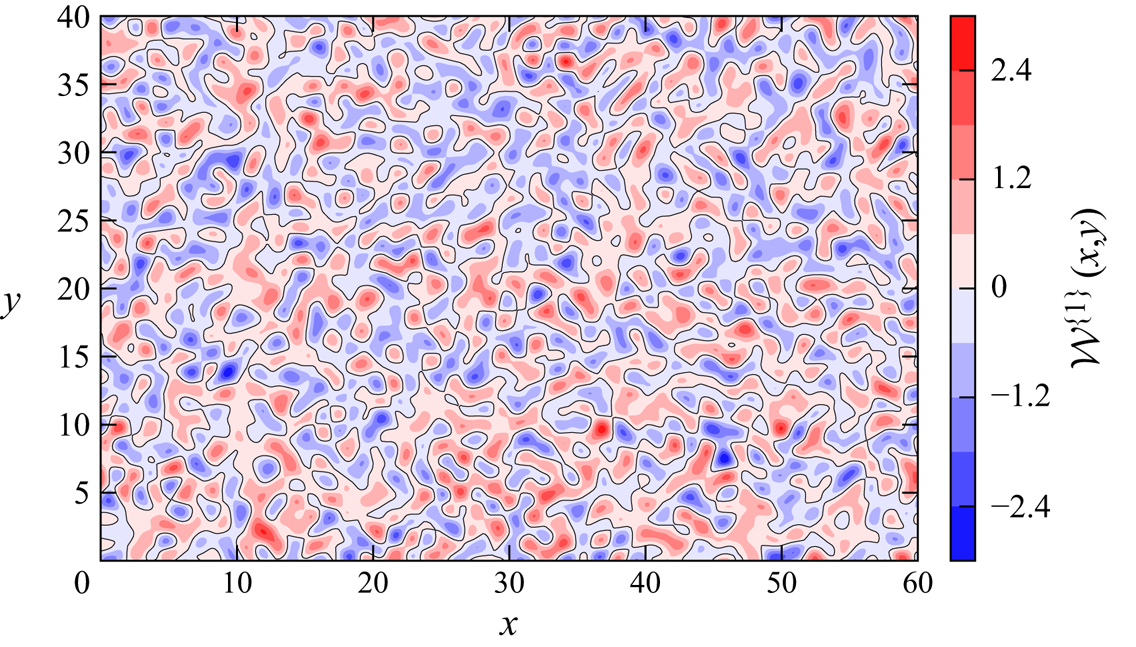
 $\mathcal {W}^{\{1\}}$ (figure 3), which is employed in all cases.

In order to fully resolve the roughness sublayer without excessive computational demand, the smallest corrugation wavelengths are set to a moderate value:  $l_x=l_y=2$. All cases are simulated over a bottom topography with identical topography function
 $\mathcal {W}^{\{1\}}$ (figure 3). In case h0.06 seven additional realizations over different topography functions (
 $\mathcal {W}^{\{2\}}-\mathcal {W}^{\{8\}}$) are run to conduct some additional spectral and correlation analysis in the receptivity stage. These additional realizations are continued only until the onset of transition (
 $t={\rm \pi} /9$). Therefore, they are not used in the breakdown stage. All instantaneous visualizations in forthcoming sections will employ the data over
 $\mathcal {W}^{\{1\}}$. The maximum bed elevation over
 $\mathcal {W}^{\{1\}}$, i.e.
 $z_c^{\{1\}}=h\max \{\mathcal {W}^{\{1\}}\}$, can be found in table 1 for all cases. In the literature, irregular roughness is often characterized by amplitude parameters such as the r.m.s. roughness height
 $S_q=h\sqrt {\langle (\mathcal {W}^{\{r\}})^2 \rangle }$, the maximum peak to valley height
 $S_z=h(\max \{\mathcal {W}^{\{r\}}\}-\min \{\mathcal {W}^{\{r\}}\})$, skewness
 $S_{sk}=\langle (\mathcal {W}^{\{r\}})^3 \rangle /S_q^3$, r.m.s.slopes
 $S_x^\prime =h\sqrt {\langle (\partial \mathcal {W}^{\{r\}}/\partial x)^2 \rangle }$ and
 $S_y^\prime =h\sqrt {\langle (\partial \mathcal {W}^{\{r\}}/\partial y)^2 \rangle }$, cf. e.g. Busse, Lützner & Sandham (Reference Busse, Lützner and Sandham2015). For
 $\mathcal {W}^{\{1\}}$, these parameters read as
 $S_q=0.7h$,
 $S_z=5.69h$,
 $S_{sk}=-0.03$,
 $S_x^\prime =1.23h$ and
 $S_y^\prime =1.26h$. Other realizations have very similar characteristics, e.g.
 $\mathcal {W}^{\{2\}}$ has
 $S_q=0.7h$,
 $S_z=5.74h$,
 $S_{sk}=0.0015$,
 $S_x^\prime =1.26h$ and
 $S_y^\prime =1.25h$.
A randomly distributed topography function with cut-off corrugation wavelengths  $l_x=2$ and
 $l_y=2$ in the streamwise and spanwise directions, respectively, (2.9). This topography function is employed in all cases, and it is referred to as
 $\mathcal {W}^{\{1\}}$ in the manuscript.

2.2. Numerical details
The incompressible Navier–Stokes and continuity equations in (2.6) and (2.7) are solved using the high-order spectral/hp element library Nektar++ (Cantwell et al. Reference Cantwell2015). Using the formulation in Serson, Meneghini & Sherwin (Reference Serson, Meneghini and Sherwin2016), the equations are first transformed to generalized coordinates  $(\bar {x},\bar {y},\bar {z})$ via
 \begin{equation} x=\bar{x},\quad y=\bar{y},\quad z=\bar{z}+\mathrm {sech}^2\left(\frac{\bar{z}}{L_m}\right)\eta(x,y), \end{equation}
with  $L_m$ varying between 0.5 and 1 depending on the case. This mapping transforms the physical domain with undulated bottom to a rectangular box, which is suitable for a mixed discretization, where a bi-dimensional spectral-element discretization (Karniadakis & Sherwin Reference Karniadakis and Sherwin2005) can be combined with Fourier expansions (Karniadakis Reference Karniadakis1990). The mixed representation allows significant cost reduction and was employed in previous DNS works on bottom boundary layers (Önder & Yuan Reference Önder and Yuan2019; Önder & Liu Reference Önder and Liu2020; Xiong et al. Reference Xiong, Qi, Gao, Xu, Ren and Cheng2020). We employ a bi-dimensional modified Legendre basis (Karniadakis & Sherwin Reference Karniadakis and Sherwin2005) in the streamwise-wall normal (
 $\bar {x}\text {--}\bar {z}$) plane, and Fourier expansions are defined in the spanwise (
 $\bar {y}$) direction. The
 $2/3$ rule is applied to avoid aliasing errors (Boyd Reference Boyd2001).
The height, width and length of the computational domain are  $L_x=60$,
 $L_y=40$ and
 $L_z=60$ (normalized with
 $\delta _s^*$), respectively. The computational domain is sufficiently large to allow the transition modes and their secondary instabilities to develop, e.g. the vortex rollers have a streamwise spacing of approximately
 $\Delta x \approx 15$ (Vittori & Blondeaux Reference Vittori and Blondeaux2008) and the linear non-normal theory predicts a spanwise streak spacing
 $\Delta y \approx 4\text {--}5$ (Verschaeve et al. Reference Verschaeve, Pedersen and Tropea2017; Önder & Liu Reference Önder and Liu2020). Periodic boundaries are employed in the streamwise and spanwise directions. The no-slip boundary condition (
 $\boldsymbol {u}=\boldsymbol {0}$) is applied on the bottom wall and the zero-Neumann condition (
 $\partial \boldsymbol {u}/\partial z=\boldsymbol {0}$) is applied at the top boundary. The simulations are started at time
 $t=-{\rm \pi}$ with zero initial fields, i.e.
 $\boldsymbol {u}(\boldsymbol {x},t=-{\rm \pi} )=\boldsymbol {0}$.
The computational domain is discretized using a structured grid. In the vertical direction the domain is partitioned into three subdomains:  $\varOmega _0:=\bar {z} \in [0,0.2]$,
 $\varOmega _1:=\bar {z} \in [0.2,8]$,
 $\varOmega _2:=\bar {z} \in [8,60]$. Here
 $\varOmega _0$ is designed to resolve the roughness sublayer with a finer resolution in the vertical with 10 elements, whose size increases gradually with an expansion ratio of 1.08 between adjacent elements;
 $\varOmega _1$ is the domain where the transition and consequent turbulence takes place. This partition is designated with 38 elements in the vertical, and an expansion ratio of 1.05 is employed. In the outer most partition,
 $\varOmega _2$, 32 elements are defined with an expansion ratio of 1.05. Eighty elements are designated to the streamwise direction. The laminar flows in all cases are simulated using the polynomial order
 $N_p=4$ in
 $\varOmega _0$ and
 $\varOmega _1$,
 $N_p=2$ in
 $\varOmega _2$, and
 $60$ Fourier modes (
 $N_y=120$ spanwise grid points). Wall units are defined using the average skin-friction drag imposed by the bed, i.e.
 $\tau _b^*:=\sum _{\{r\}}(\int _\varGamma \boldsymbol {F}^{\nu ,\{r\}}\,\mathrm {d}\varGamma )\boldsymbol {\cdot } \hat {\boldsymbol {e}}_x/L_xL_yR$, where
 $\varGamma$ is the bottom surface, and
 $\boldsymbol {F}^{\nu ,\{r\}}$ is the viscous drag force at a point on the surface in a given realization. In a laminar SWBL over a flat bottom (
 $h=0$), the maximum mean skin-friction drag over the entire phase space is
 $\tau _b^{max *}:=\max \{\tau _b^{*}\}=1.21\rho ^*U_{0m}^{*2}{Re_\delta }^{-1}$ (figure 20 in § 4). This peak value is not significantly modified in the laminar stage of rough bottom cases and can be employed to analyse the resolution until the onset of transition. At
 $Re_\delta =2000$, the maximum laminar friction velocity is
 $u_\tau ^*:=\sqrt {\tau _b^{max *}/\rho ^*}=0.025U_{0m}^*$, and the corresponding viscous length scale is
 $\delta _{\nu }^*:=\nu ^*/u_\tau ^*=0.02\delta _s^*$. Consequently, in
 $\varOmega _0$ and
 $\varOmega _1$, the grid spacings in wall units (i.e. normalized with
 $\delta _{\nu }^*$) are
 $\Delta \bar {x}^+=7.38$ and
 $\Delta \bar {y}^+=16.4$ in homogenous directions. A spectral analysis in § 3 assesses the resolution in these directions for the receptivity stage and shows no spurious accumulation of energy in high wavenumbers. In the vertical direction, the resolution at the wall is
 $\Delta \bar {z}^+=0.16$. As we aim to resolve all scales of the flow in our DNS experiments, no artificial stabilization technique such as spectral vanishing viscosity (Kirby & Sherwin Reference Kirby and Sherwin2006) is employed. This results in significant numerical instabilities when the flows start to break down into finer scales during the transition. To avoid these numerical problems due to under-resolution, we employed a
 $p$-type refinement (Karniadakis & Sherwin Reference Karniadakis and Sherwin2005) in which polynomial orders and dimension of the Fourier space are increased. Following the grid refinement, the simulations are rerun from the onset of transition onward. This process is repeated until stability is achieved. The high-order refinements yield very dense grids, whose final resolution are presented in table 1 for each case. Since
 $\tau _b^{*}$ in the turbulent stage does not exceed the peak of the laminar stage in h0.01–h0.06 (figure 20), grid refinements improve aforementioned grid spacings in wall units in these cases. This condition does not apply to h0.07 in which the mean skin-friction drag exhibits a peak at the start of the APG stage at
 $\tau _b^{*}=3.21\rho ^*U_{0m}^{*2}{Re_\delta }^{-1}$. Table 1 specifies
 $N_p^0=6$,
 $N_p^1=7$ and
 $N_z=720$ for h0.07. Consequently, the streamwise grid spacings at the peak skin-friction phase become
 $\Delta \bar {x}^+=14.01$ and
 $\Delta \bar {x}^+=12.26$ in
 $\varOmega _0$ and
 $\varOmega _1$, whereas spanwise grid spacing and the resolution at the wall become
 $\Delta \bar {y}^+=19.38$ and
 $\Delta \bar {z}^+=0.3$, respectively.
A system of differential algebraic equations is obtained using the continuous Galerkin method, and the coupled system is segregated using a velocity-correction scheme designed for transformed coordinates, cf. Serson et al. (Reference Serson, Meneghini and Sherwin2016) for details and validations. The momentum equations are integrated in time using a second-order scheme, in which both advection and diffusion terms are treated implicitly (Vos et al. Reference Vos, Eskilsson, Bolis, Chun, Kirby and Sherwin2011). The additional viscous and pressure terms due to coordinate transformation are solved explicitly whenever possible to benefit from the lower cost of the explicit scheme. In cases with high roughness (h0.06 and h0.07 in table 1), the explicit scheme was unstable and we switched to implicit mapping. A varying time-step size is utilized, which is refined adaptively with increasing velocities in the wave event. The maximum Courant–Friedrichs–Lewy numbers in all cases are kept below  $0.15$ to ensure a good temporal resolution. All the resulting computational fields are mapped back to physical coordinates (
 $\boldsymbol {x}$) when analysing the results.
3. Receptivity stage: development of streaks
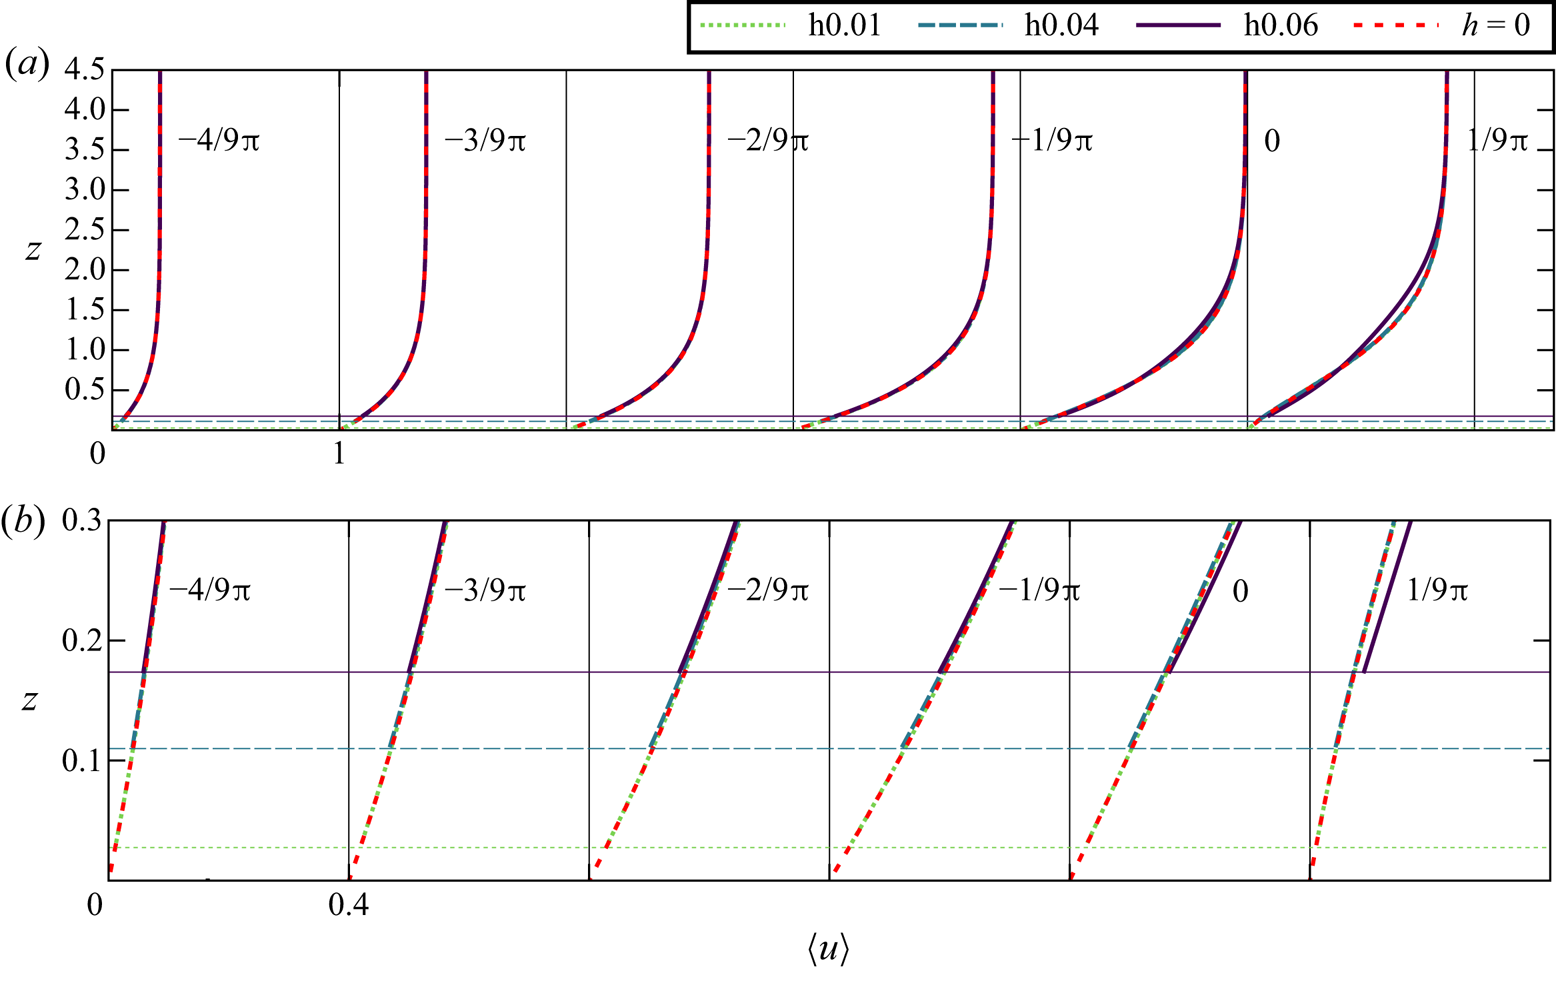
In this section we study the response of the SWBL to bottom topography until the onset of transition. The vertical profiles of ensemble-averaged velocities  $\langle u \rangle$ in cases h0.01, h0.04 and h0.06 are presented in figure 4(
 $a$). Only the realization over
 $\mathcal {W}^{\{1\}}$ is considered for case h0.06 to allow a comparison over identical topography function. Velocity profiles over a flat bottom (
 $h=0$) are also presented as reference. The profiles over random topography start at
 $z=z_c^{\{1\}}$, cf. the enlarged view in figure 4(
 $b$). Above this level, there is an excellent match among different cases until the end of FPG stage. Starting from phase
 $t=-1/9{\rm \pi}$, noticeable deviations occur for h0.06, whereas cases h0.01 and h0.04 appear to strictly follow the reference laminar profile for all presented times.
( $a$) The vertical profiles of ensemble-averaged steamwise velocities between times
 $[-4/9{\rm \pi} ,1/9{\rm \pi} ]$ for cases h0.01, h0.04 and h0.06. Reference profiles obtained over a perfectly smooth wall (
 $h=0$) are also plotted. The profiles are shifted by unity at each time instance. The highest crest level (
 $z_c^{\{1\}}$, cf. table 1) for each case is shown with a horizontal line of the same type. (
 $b$) Enlarged view of the near-bed region. The profiles are shifted by 0.4 at each time instance.

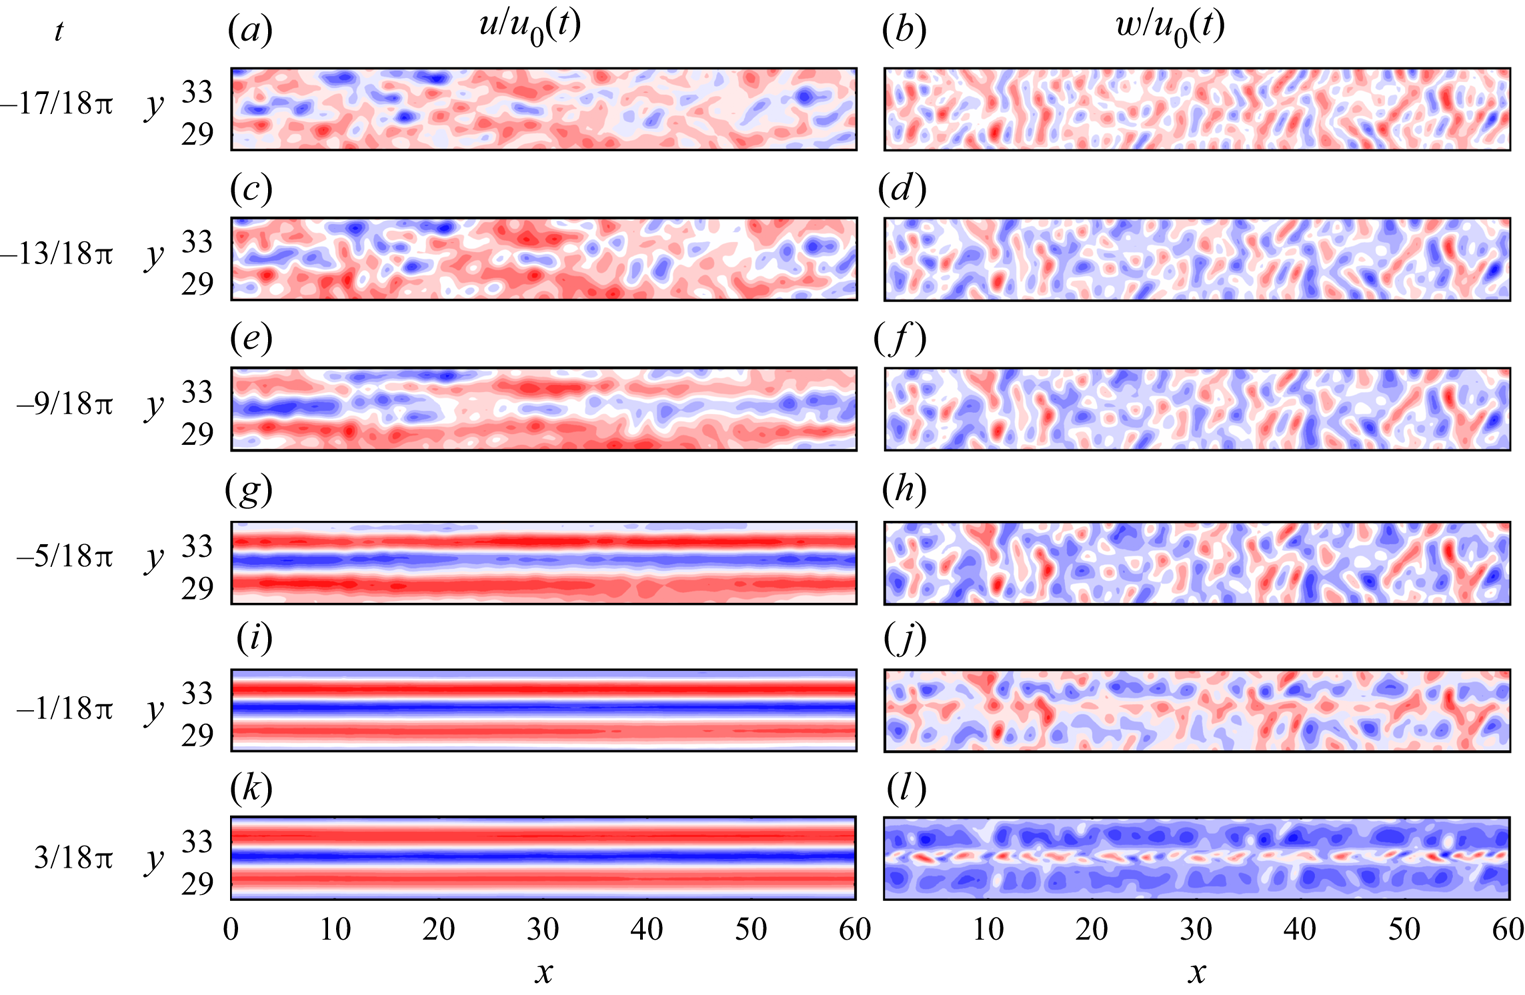
The evolution of streamwise and vertical instantaneous velocities on a subplane at  $z=0.5$ are shown in figure 5 for case h0.06. In the initial stages of the event, both velocity components directly respond to bottom roughness and have irregular fluctuations on the plane (figure 5
 $a$–
 $d$). When the presence of the wave becomes stronger, the boundary layer starts to amplify streaks of low and high streamwise momentum, cf. figure 5(
 $e{,}g$). The development of streaks in h0.06 is also demonstrated in supplementary movie 1 available at https://doi.org/10.1017/jfm.2020.1141, where the time evolution of the streamwise velocity contours
 $(u/u_0(t))$ is shown for the whole horizontal plane at
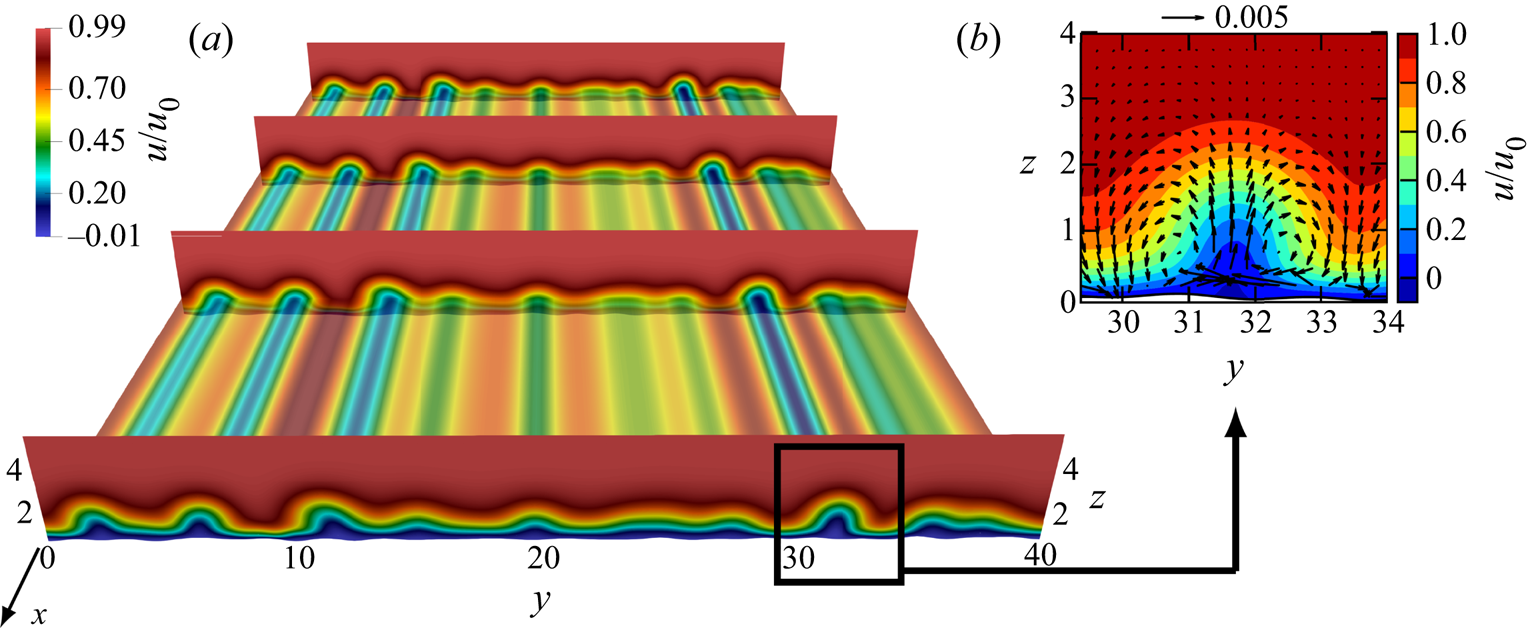
 $z=0.5$. At the end of the FPG stage, these structures already dominate the flow, and the streamwise velocity becomes approximately streamwise constant. This can be also seen in figure 6(
 $a$), where
 $u(t=1/9{\rm \pi} )$ is demonstrated in the full domain. The boundary layer is modulated along its span by streamwise-constant streaks. The prevalence of streamwise-constant streaks is consistent with the predictions of linear non-normal growth theory (Verschaeve et al. Reference Verschaeve, Pedersen and Tropea2017; Önder & Liu Reference Önder and Liu2020). These streaks are accompanied by counter-rotating vortices (figure 6
 $b$), which are arranged to transport low-momentum fluid upwards and high-momentum fluid downwards. This is the lift-up mechanism (Landahl Reference Landahl1980), which is discussed in detail in Önder & Liu (Reference Önder and Liu2020) for SWBLs. As the cross-stream velocity components building the vortices are of the same order (figure 6
 $b$), we will consider hereafter only the vertical velocity to discuss the dynamics of vortices. The streamwise alignment of vertical velocity in figure 5(
 $j{,}l$) implies that the counter-rotating vortices are, like the streaks they generate, longitudinal structures. However, unlike the streamwise streaks, streamwise vortices do not dominate the momentum in their direction, as we observe considerable smaller-scale fluctuations in figure 5(
 $j{,}l$). This is because streamwise vortices are much weaker structures than the streamwise streaks, as indicated by the values in the quiver key and colourbar in figure 6(
 $b$). In fact, the linear streamwise-constant perturbation equations for smooth wall-bounded flows suggest that the cross-stream components are one-order lower in Reynolds number than the streamwise components (Waleffe Reference Waleffe1995; Önder & Liu Reference Önder and Liu2020). The same principle carries over here to the SWBL over rough bottom topography, and the amplification concentrates almost entirely in one (streamwise) component.
Temporal evolution of streamwise ( $a{,}c{,}e{,}g{,}i{,}k$) and vertical (
 $b{,}d{,}f{,}h{,}j{,}l$) velocities on plane
 $z=0.5$ between
 $28<y<34$ is shown for case h0.06. The velocities are normalized by the free-stream velocity
 $u_0(t)$ at the respective phase. The contours levels span 12 levels between: (a)
 $[0.25,0.28]$; (b)
 $[-0.06,0.052]$; (c)
 $[0.52,0.6]$; (d)
 $[-0.034,0.037]$; (e)
 $[0.57,0.63]$; (f)
 $[-0.016, 0.02]$; (g)
 $[0.52,0.63]$; (h)
 $[-0.0083, 0.012]$; (i)
 $[0.26,0.69]$; (j)
 $[-0.0062,0.0073]$; (k)
 $[-0.04,0.53]$; (l)
 $[-0.0043, 0.008]$.

The instantaneous fields at  $t=1/9{\rm \pi}$ in case h0.06. (
 $a$) Contours of streamwise velocity on a horizontal plane
 $z=0.5$ (
 $50\,\%$ opaque), and on four vertical cutplanes evenly spaced in the streamwise direction. The contours are normalized with the instantaneous free-stream velocity
 $u_0(t=1/9{\rm \pi} )$. (
 $b$) Enlarged view of a streak at cutplane
 $x=0$. Arrows show in-plane velocity components
 $(v \hat {\boldsymbol {e}}_y+ w \hat {\boldsymbol {e}}_z)/u_0$.

The development of longitudinal streaks and vortices can be further inspected using longitudinal and transverse spectra at a selected height. The longitudinal spectral density for fluctuating velocities is approximated on the discrete grid by
 \begin{equation} E_{x,ij}(k_x,z,t)\approx\frac{2}{\Delta k_x} \langle \hat{u}_i (k_x,y,z,t) \hat{u}_j^*(k_x,y,z,t) \rangle_{y} \quad \text{for } k_x\geq0, \end{equation}
where  $\hat {\boldsymbol {u}}$ are the Fourier modes that are associated with the streamwise wavenumber
 $k_x$,
 $\Delta k_x=2{\rm \pi} /L_x$ is the wavenumber spacing. The subscript
 $x$ demonstrates the direction of Fourier decomposition, whereas
 $i$ and
 $j$ denote the fluctuating velocity components under inspection, e.g.
 $E_{x,uw}$ is the longitudinal cross-spectral density function for components
 $u^{\prime }$ and
 $w^{\prime }$. Integrating over spectral densities delivers the Reynolds stress,
 $\langle u_i^\prime u_j^\prime \rangle =\int E_{x,ij}\,\mathrm {d} k_x$. Similarly, the transverse spectral density function is obtained by
 \begin{equation} E_{y,ij}(k_y,z,t)\approx\frac{2}{\Delta k_y} \langle \hat{u}_i (k_y,x,z,t) \hat{u}_j^*(k_y,x,z,t) \rangle_{x}\quad \text{for } k_y\geq0, \end{equation}
where  $\hat {\boldsymbol {u}}(k_y,x,z,t)$ are the spanwise Fourier modes associated with
 $k_y$.
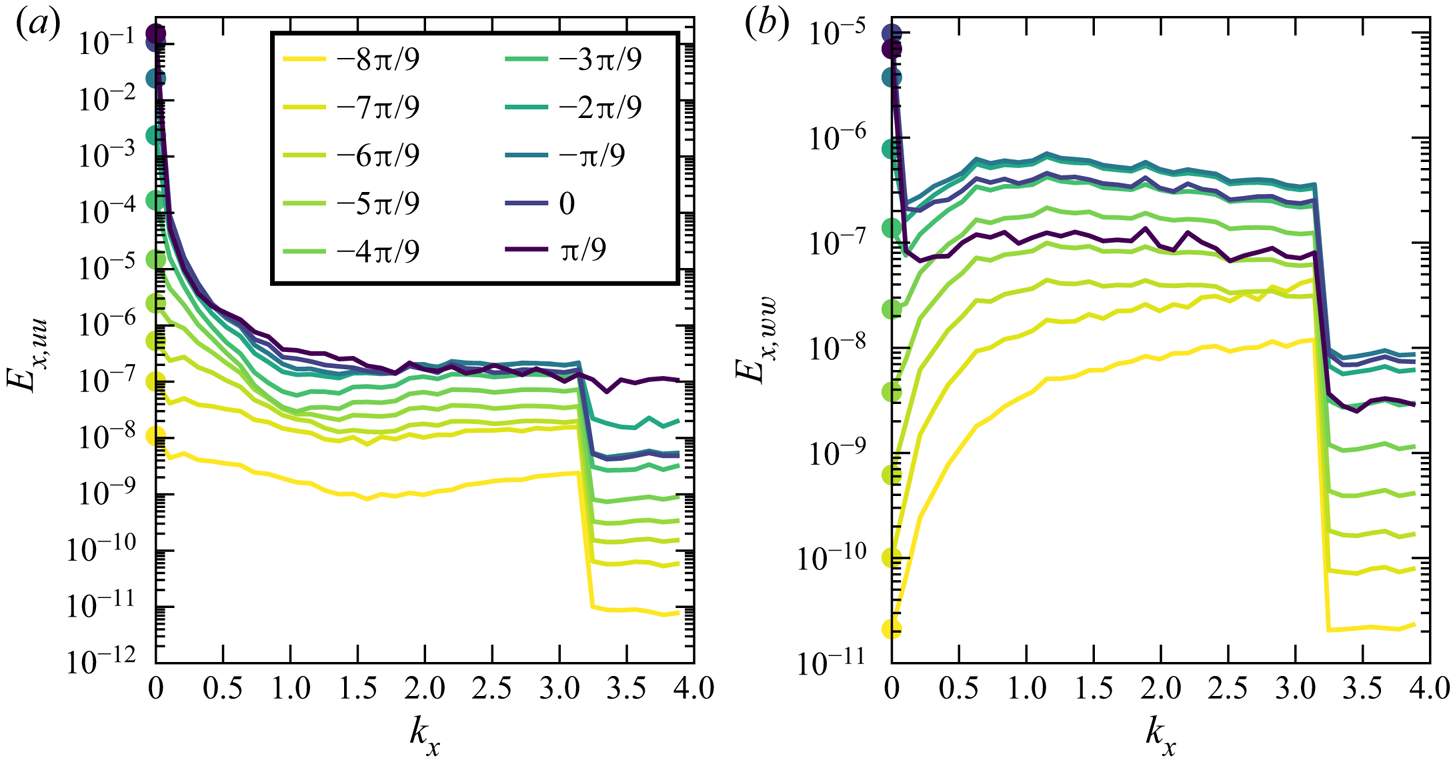
Figure 7 presents the evolution of the longitudinal spectral densities (3.1) for streamwise and vertical velocity fluctuations at  $z=0.5$ for case h0.06. Wall undulations with streamwise cut-off wavenumber
 $l_x=2$ (cf. figure 3) are defined in the spectral band
 $0\leq k_x\leq {\rm \pi}$, i.e. (2.8). Therefore, the flow is subject to a broadband forcing in this spectral band. In this regard, a step-like abrupt decay is observed at the end of both spectra at
 $k_x={\rm \pi}$ due to cut-off in forcing. The boundary layer responds evenly to broadband forcing in
 $1\lesssim k_x<{\rm \pi}$, and we observe a flat spectrum in this band. Below this band, the response is far greater due to intrinsic noise amplification in the boundary layer and the streamwise-constant mode (
 $k_x=0$) prevails with a very distinctive peak in the streamwise velocity spectra (figure 7
 $a$). Streamwise-constant modes are initially negligible in the vertical velocity spectra (figure 7
 $b$). They only become prevalent in the late FPG stage (starting from
 $t=-3{\rm \pi} /9$ in the figure). Interestingly, this late amplification is limited to streamwise-constant modes while the rest of the low-frequency band remains below the plateau level. This fine-tuned amplification hints to a mechanism in which energetic streamwise-constant streaks induce streamwise-constant vortices. Details of this process will be investigated later in this section. Consistent with the visualizations in figure 5, streamwise-constant vertical motions are not as dominant as their streamwise counterparts, e.g. the peaks at
 $k_x=0$ at late phases are located 5–6 decades higher than the plateau
 $1\lesssim k_x<{\rm \pi}$ in figure 7(
 $a$), whereas the difference is only 1–2 decades in figure 7(
 $b$).
Longitudinal spectral densities (3.1) for streamwise ( $a$) and vertical (
 $b$) velocity fluctuations at
 $z=0.5$ at phases
 $t=\{-8{\rm \pi} /9,-7{\rm \pi} /9,\ldots ,{\rm \pi} /9\}$ for case h0.06. The colour coding is the same for both figures. The energy in streamwise-constant modes (
 $k_x=0$) are shown with circles.

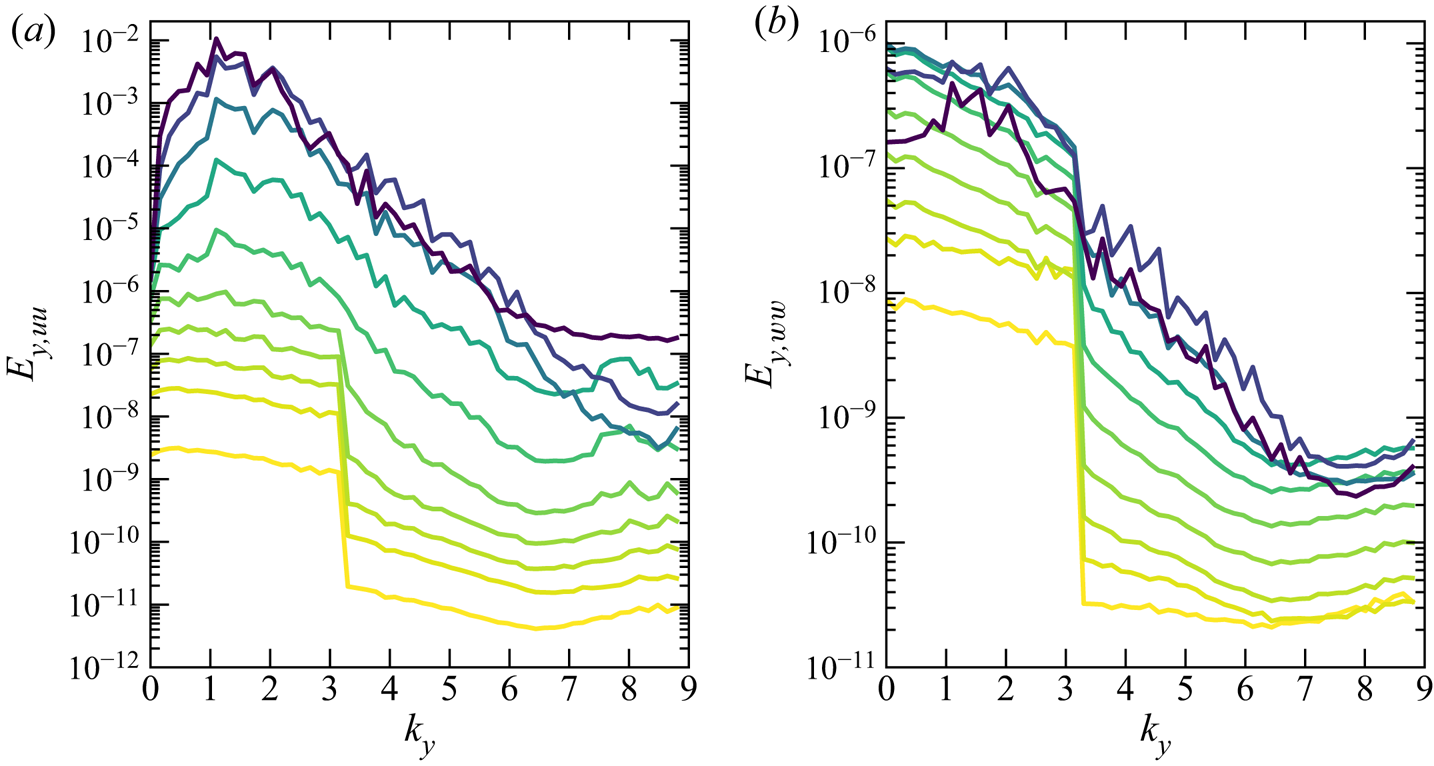
Transverse velocity spectra at  $z=0.5$ are presented in figure 8 for case h0.06. The forcing by bottom topography focuses in the band
 $0\leq k_y\leq {\rm \pi}$ as the spanwise cut-off wavenumber of the bed undulations is
 $l_y=2$. At earlier times we see again a step-like decay for
 $k_y>{\rm \pi}$. However, in the transverse spectra, the energy spreads soon to higher wavenumbers and the step profile disappears. This is due to the development of internal shear layers around streaks, which promotes fine-scale energy. A peak at
 $k_y\approx 1.5$ starts to appear in the streamwise energy spectra at
 $t\approx -{\rm \pi} /3$ and becomes more prevalent at later times, cf. figure 8(
 $a$). These peaks indicate that the average spanwise spacing between adjacent streak pairs is
 $l_s^*\approx 2{\rm \pi} /1.5 \delta _s^* \approx 4.2 \delta _s^*$. Using a linear non-normal analysis based on a body forcing model, Önder & Liu (Reference Önder and Liu2020) also observed a high amplification in the range
 $k_y\approx 1.5$. This suggests that a similar non-normal amplification mechanism (lift-up mechanism) becomes prominent for
 $t\geq -{\rm \pi} /3$ in the present problem. The spacing
 $l_s^*\approx 4.2\delta _s^*$ is also remarkably close to the spacing of transitional streaks in Mazzuoli & Vittori (Reference Mazzuoli and Vittori2019), where an oscillatory boundary layer over spherical roughness elements is studied in an intermittently turbulent regime. They reported a spacing of
 $l_s^*\approx 4.5\delta _s^*$ slightly above the crest of roughness elements (
 $z^*-z_c^*\approx 0.2\delta _s^*$).


A peak is observed only at  $t={\rm \pi} /9$ in the vertical spectra, cf. figure 8(
 $b$). Besides the relative weakness of streamwise-constant vertical fluctuations compared with background fluctuations, this delayed appearance of the peak in the vertical spectra again suggests a mechanism, in which streamwise-constant streaks, when they become sufficiently strong, feed streamwise-constant vortices.
The receptivity process can be further elaborated by studying the dynamics of streamwise streaks and vortices in isolation. Önder & Meyers (Reference Önder and Meyers2018) employed a simple sharp spectral filter to distinguish between long streaks in the atmospheric boundary layer and wakes of wind turbines. It is based on removing streamwise wavenumbers above a cut-off wavenumber  $k_x^c$ using the filter
 $G(k_x;k_x^c)$. We adapt the same filter here to extract long streaky components. We have seen above that streamwise-constant motions clearly dominate. Therefore,
 $k_x^c=0$ is selected as the cut-off wavenumber. As a result, the filter becomes equivalent to the streamwise-averaging operator
 \begin{equation} \boldsymbol{\widetilde{u^\prime}}(y,z,t):=G(k_x;k_x^c=0) \circ {\boldsymbol{u}}^{\prime}(\boldsymbol{x},t)=\langle {\boldsymbol{u}}^{\prime} \rangle_x. \end{equation}
The residual finer scale velocity components are then expressed by  $\boldsymbol {u}^{\prime \prime }:= \boldsymbol {u}^{\prime }-\widetilde {\boldsymbol {u}^\prime }$. This results in the following triple decomposition of the instantaneous velocity field:
 \begin{equation} \boldsymbol{u}= \langle \boldsymbol{u} \rangle +\underbrace{\boldsymbol{\widetilde{u^\prime}} + \boldsymbol{u}^{\prime\prime}}_{\boldsymbol{u}^{\prime}}. \end{equation}
The streaks are characterised by the streamwise-constant component of fluctuating streamwise velocity fields, i.e.  $\widetilde {u^\prime }$, and streamwise vortices are characterised by the streamwise-constant components of the cross-stream velocities, i.e.
 $\widetilde {v^\prime }$ and
 $\widetilde {w^\prime }$. The triple decomposition is defined only in the fluid domain above the highest topography (
 $z>z_c^{\{r\}}$). Reynolds stresses can now be decomposed into two components,
 \begin{equation} \langle u_i^{\prime} u_j^{\prime}\rangle=\langle \widetilde{u^\prime_i} \widetilde{u^\prime_j}\rangle+\langle u_i^{\prime\prime} u_j^{\prime\prime}\rangle. \end{equation}
The filtered, or streamwise-averaged, fields have the following properties:
 \begin{equation} \frac{\partial \widetilde{\boldsymbol{u}^\prime}}{\partial x}=\boldsymbol{0};\quad \widetilde{\widetilde{\boldsymbol{u}^\prime} \boldsymbol{u}^{\prime\prime}}=\boldsymbol{0}; \quad \widetilde{\widetilde{\boldsymbol{u}^\prime} \widetilde{\boldsymbol{u}^\prime}}=\widetilde{\boldsymbol{u}^\prime} \widetilde{\boldsymbol{u}^\prime}. \end{equation}
These properties also apply to triply decomposed pressure fields, i.e.  $p=\langle p \rangle + \widetilde {p^\prime } +p^{\prime \prime }$.
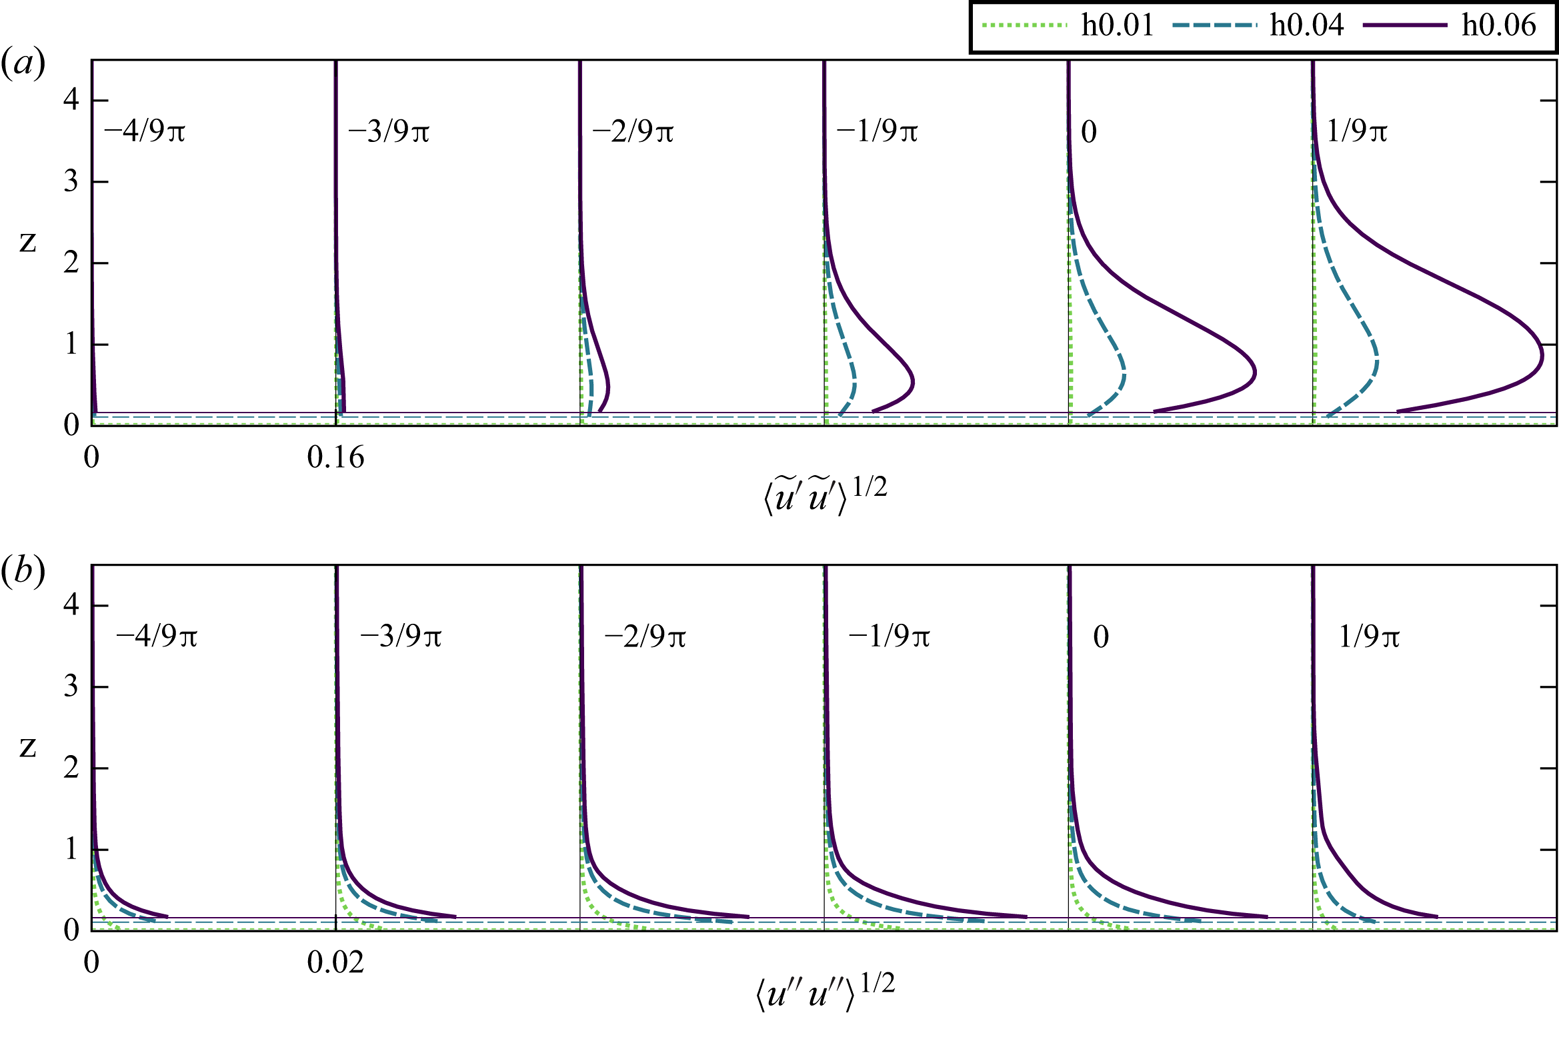
The vertical profiles of streamwise fluctuation intensities for streamwise-constant ( $\langle \widetilde {u^\prime }\widetilde {u^\prime }\rangle ^{1/2}$) and residual (
 $\langle u^{\prime \prime } u^{\prime \prime } \rangle ^{1/2}$) motions in cases h0.01, h0.04 and h0.06 are plotted in figures 9(
 $a$) and 9(
 $b$), respectively. In all three cases, residual fluctuations peak at
 $z=z_c$ and decay rapidly upwards from there. Their intensities peak at
 $t=-1/9{\rm \pi}$ when the bottom shear is maximum (cf. figure 20 in § 4). Streamwise-constant fluctuations have very different characteristics compared with residual fluctuations. The peaks are located significantly above the crest level and move progressively to higher levels with lifting up of streaks, cf. figure 9(
 $a$). Their intensities are an order of magnitude or more higher than residual intensities. The peak values in
 $\langle \widetilde {u^\prime }\widetilde {u^\prime }\rangle ^{1/2}$ profiles represent an average value for streak amplitudes. These amplitudes increase with roughness height
 $h$ with an increasingly nonlinear rate, i.e. their scaling with roughness height is
 $h^p$ with
 $p>1$. There is a significant jump between cases, e.g. at
 $t=1/9{\rm \pi}$, the peak intensities are
 $0.0018$,
 $0.042$ and
 $0.15$ for h0.01, h0.04 and h0.06, respectively. Case h0.01 develops very weak streaks whose intensity is almost indistinguishable in figure 9(
 $a$). This suggests a nonlinear threshold mechanism for onset of streak amplification.
Vertical profiles of streamwise velocity fluctuations for cases h0.01, h0.04 and h0.06. ( $a$) Intensity of streamwise-constant fluctuations
 $\langle \widetilde {u^\prime } \widetilde {u^\prime }\rangle ^{1/2}$. The profiles are shifted by 0.16 at each time instance. (
 $b$) Intensity of three-dimensional fluctuations
 $\langle u^{\prime \prime } u^{\prime \prime } \rangle ^{1/2}$. The profiles are shifted by 0.02 at each time instance. The highest crest level (
 $z_c^{\{1\}}$) for each case is shown with a horizontal line of the same type.

Figure 10( $a$) shows the profiles of the streamwise-constant component of vertical fluctuation intensities (
 $\langle \widetilde {w^\prime } \widetilde {w^\prime }\rangle ^{1/2}$). The peak values of
 $\langle \widetilde {w^\prime } \widetilde {w^\prime }\rangle ^{1/2}$ represent an average measure for the amplitude of streamwise-constant vortices. Similar to
 $\langle \widetilde {u^\prime } \widetilde {u^\prime }\rangle ^{1/2}$,
 $\langle \widetilde {w^\prime } \widetilde {w^\prime }\rangle ^{1/2}$ peaks significantly above the crest levels (
 $z_c$) and the relationship to the roughness height is nonlinear. As discussed above, these intensities are an order of magnitude lower in Reynolds number. At
 $t=1/9{\rm \pi}$, the peak values are
 $5.95\times 10^{-6}$,
 $1.86\times 10^{-4}$ and
 $1.06\times 10^{-3}$ for h0.01, h0.04 and h0.06, respectively. These values are lower than the peak residual fluctuation intensities
 $\langle w^{\prime \prime } w^{\prime \prime } \rangle ^{1/2}$ in figure 10(
 $b$).
Vertical profiles of vertical velocity fluctuations for cases h0.01, h0.04 and h0.06. ( $a$) Intensity of streamwise-constant fluctuations
 $\langle \widetilde {w^\prime } \widetilde {w^\prime }\rangle ^{1/2}$. The profiles are shifted by 0.0005 at each time instance. (
 $b$) Intensity of three-dimensional fluctuations
 $\langle w^{\prime \prime } w^{\prime \prime } \rangle ^{1/2}$. The profiles are shifted by 0.004 at each time instance. The highest crest level (
 $z_c$) for each case is shown with a horizontal line of the same type.

The relationship between bottom topography and the spatial organization of streaks, and the origins of the nonlinear receptivity process remain to be elaborated. Some insights can be obtained by analysing the perturbation and energy equations. The governing equations for the ensemble-averaged velocity field  $\langle \boldsymbol {u} \rangle =(\langle u \rangle ,0,0)$ in the region above the topography (
 $z>{z_c^{\{r\}}}$) are expressed by
 \begin{gather} \frac{2}{Re_\delta}\frac{\partial \langle u \rangle}{\partial t}=\frac{1}{Re_\delta} \frac{\partial^2 \langle u \rangle }{\partial z^2}-\frac{\partial \langle u^{\prime}w^{\prime}\rangle}{\partial z}- \frac{\partial p_0+\langle p \rangle}{\partial x}, \end{gather}
 \begin{gather}0={-} \frac{\partial \langle w^{\prime}w^{\prime}\rangle}{\partial z}- \frac{\partial \langle p \rangle}{\partial z}. \end{gather}
We obtain the governing equations for the fluctuating velocity fields  $\boldsymbol {u}^{\prime }$ by subtracting (3.7)–(3.8) from (2.6),
 \begin{gather} \frac{2}{Re_\delta}\frac{\partial u^{\prime}}{\partial t}+ \langle u\rangle\frac{\partial u^{\prime}}{\partial x}+w^{\prime}\frac{\partial \langle u \rangle}{\partial z} +\boldsymbol{\nabla} \boldsymbol{\cdot} (u^{\prime} \boldsymbol{u}^{\prime}) = \frac{1}{Re_\delta}\nabla^2 u^{\prime} +\frac{\partial \langle u^{\prime}w^{\prime}\rangle}{\partial z}-\frac{\partial p^{\prime}}{\partial x}, \end{gather}
 \begin{gather}\frac{2}{Re_\delta}\frac{\partial v^{\prime}}{\partial t} +\boldsymbol{\nabla} \boldsymbol{\cdot} (v^{\prime} \boldsymbol{u}^{\prime}) =\frac{1}{Re_\delta}\nabla^2 v^{\prime}-\frac{\partial p^{\prime}}{\partial y}, \end{gather}
 \begin{gather}\frac{2}{Re_\delta}\frac{\partial w^{\prime}}{\partial t} +\boldsymbol{\nabla} \boldsymbol{\cdot} (w^{\prime} \boldsymbol{u}^{\prime}) =\frac{1}{Re_\delta}\nabla^2 w^{\prime} +\frac{\partial \langle w^{\prime}w^{\prime}\rangle}{\partial z}-\frac{\partial p^{\prime}}{\partial z}, \end{gather}
where  $\boldsymbol {\nabla }= \partial /\partial x \hat {\boldsymbol {e}}_x+\partial /\partial y \hat {\boldsymbol {e}}_y+\partial /\partial z \hat {\boldsymbol {e}}_z$ and
 $\nabla ^2=\boldsymbol {\nabla }\boldsymbol {\cdot }\boldsymbol {\nabla }$. The governing equations for streamwise-constant fluctuating fields
 $\widetilde {\boldsymbol {u}^\prime }$ are obtained by applying the filtering operation (3.3) to the individual terms in the fluctuation equations (3.9)–(3.11) and imposing further simplications using (3.6a–c),
 \begin{gather} \frac{2}{Re_\delta}\frac{\partial \widetilde{u^\prime}}{\partial t} +\widetilde{w^\prime}\frac{\partial \langle u \rangle}{\partial z} +\frac{\partial \widetilde{u^{\prime}v^{\prime}}}{\partial y}+\frac{\partial \widetilde{u^{\prime}w^{\prime}}}{\partial z} =\frac{1}{Re_\delta}\tilde{\nabla}^2 \widetilde{u^\prime} +\frac{\partial \langle u^{\prime}w^{\prime} \rangle}{\partial z}, \end{gather}
 \begin{gather}\frac{2}{Re_\delta}\frac{\partial \widetilde{v^\prime}}{\partial t} +\frac{\partial \widetilde{v^{\prime}v^{\prime}}}{\partial y}+\frac{\partial \widetilde{v^{\prime}w^{\prime}}}{\partial z} =\frac{1}{Re_\delta}\tilde{\nabla}^2 \widetilde{v^\prime} -\frac{\partial \widetilde{p^\prime}}{\partial y}, \end{gather}
 \begin{gather}\frac{2}{Re_\delta}\frac{\partial \widetilde{w^\prime}}{\partial t} +\frac{\partial \widetilde{v^{\prime}w^{\prime}}}{\partial y}+\frac{\partial \widetilde{w^{\prime}w^{\prime}}}{\partial z} =\frac{1}{Re_\delta}\tilde{\nabla}^2 \widetilde{w^\prime} +\frac{\partial \langle w^{\prime}w^{\prime} \rangle}{\partial z} -\frac{\partial \widetilde{p^\prime}}{\partial z}, \end{gather}
where  $\tilde {\boldsymbol {\nabla }}= \partial /\partial y \hat {\boldsymbol {e}}_y+\partial /\partial z \hat {\boldsymbol {e}}_z$. These equations are supplemented with the pressure-Poisson equation for the filtered pressure, which is obtained by taking the
 $y$-derivative of (3.13) and the
 $z$-derivative of (3.14) and then summing up the resulting equations,
 \begin{equation} {-}\left (\frac{\partial^2 \widetilde{p^\prime}}{\partial y^2}+\frac{\partial^2 \widetilde{p^\prime}}{\partial z^2}\right ) =\frac{\partial^2 \widetilde{v^{\prime}v^{\prime}}}{\partial y^2}+2\frac{\partial^2 \widetilde{v^{\prime}w^{\prime}}}{\partial y\partial z} +\frac{\partial^2 \widetilde{w^{\prime}w^{\prime}}}{\partial z^2} -\frac{\partial^2 \langle w^{\prime}w^{\prime} \rangle}{\partial z^2}. \end{equation}
Equation (3.12) is the momentum equation for streaks. Equations (3.13)–(3.15) are the governing equations for streamwise-constant vortical motions. We note that streamwise-constant pressure is decoupled completely from streamwise fluctuations. It is observed that streak and vortex equations are only connected by nonlinear terms containing the residual fluctuations. We will see later in this section that this link plays a key role for the feedback from streaks to vortices. Multiplying (3.12) by  $\widetilde {u^\prime }$ and ensemble-averaging the resulting equation, we obtain the energy budget for streaks
 \begin{gather} \underbrace{\frac{1}{Re_\delta}\frac{\partial \langle \widetilde{u^\prime}^2 \rangle}{\partial t}}_{E_{11}} =\underbrace{- \left \langle \widetilde{u^\prime} \left (\frac{\partial \widetilde{ u^{\prime} v^{\prime}}}{\partial y}+\frac{\partial \widetilde{ u^{\prime} w^{\prime}}}{\partial z}\right)\right \rangle}_{\mathcal{T}_{11}} \underbrace{-\langle \widetilde{u^\prime} \widetilde{w^\prime}\rangle \frac{\partial \langle u \rangle}{\partial z}}_{\mathcal{P}_{11}}\nonumber\\ +\underbrace{\frac{1}{2Re_\delta}\frac{\partial^2 \langle \widetilde{u^\prime} \widetilde{u^\prime} \rangle}{\partial z^2}}_{\mathcal{D}_{11}} \underbrace{-\frac{1}{Re_\delta} \left \langle \left(\frac{ \partial \widetilde{u^\prime}}{\partial y}\right)^2+\left(\frac{ \partial \widetilde{u^\prime}}{\partial z}\right)^2\right \rangle}_{\varepsilon_{11}}, \end{gather}
where  $\mathcal {T}_{11}$ contains the terms for mean and turbulent transport and redistribution,
 $\mathcal {P}_{11}$ is the production term,
 $\mathcal {D}_{11}$ is the diffusive transport term and
 $\varepsilon _{11}$ is the dissipation term. Figure 11 demonstrates the vertical profile of each budget term at three representative phases
 $t=-2{\rm \pi} /3,-{\rm \pi} /3$ and
 $0$ for case h0.06. Two different streak generation mechanisms are observed. Initially, when the free-stream velocity and boundary layer shear are still weak, the streaks are generated by diffusive transport from the bed upwards, cf. figure 11(
 $a$). At this initial stage, the production term is negligible, and vertical fluctuations and the lift-up mechanism play no role. At later phases of the FPG stage, vertical fluctuations and shear strengthen, and the lift-up mechanism is activated. Consequently, the production term becomes the dominant gain term, cf. figures 11(
 $b$) and 11(
 $c$).
Energy budget for streamwise-constant streamwise fluctuations ( $\widetilde {u^\prime }$), (3.16), in case h0.06. Results for (
 $a$)
 $t=-2{\rm \pi} /3$; (
 $b$)
 $t=-{\rm \pi} /3$; (
 $c$)
 $t=0$.

Although the energy of the early streaks is very low, these streaks determine the initial positioning over the randomly distributed bed undulations. As they are produced by diffusive transport upwards from the bed, direct connections between streak locations and bed topography are to be expected. Assuming a linear process, streamwise-constant streaks are excited by streamwise-constant modes of the topography. In a single realization, this relationship can be quantified using the correlation coefficient
 \begin{equation} C^{\{r\}}(\widetilde{u^\prime},\tilde{\eta},z,t)=\frac{\langle \widetilde{u^\prime}^{\{r\}}\tilde{\eta}^{\{r\}}\rangle}{\sqrt{\langle (\widetilde{u^\prime}^{\{r\}})^2\rangle}\sqrt{\langle (\tilde{\eta}^{\{r\}})^2\rangle}}, \end{equation}
where  $\tilde {\eta }=G(k_x;k_x^c=0)\circ \eta =\langle \eta \rangle _x$ is the filtered bed elevation function. The time evolution of
 $C^{\{r\}}(\widetilde {u^\prime },\tilde {\eta })$ at
 $z=0.5$ is plotted in figure 12(
 $a$) for case h0.06 for five different realizations. Until
 $t\approx -{\rm \pi} /2$, there is an almost perfect negative correlation between the filtered topography and streaks, i.e.
 $C^{\{r\}}(\widetilde {u^\prime },\tilde {\eta })\approx -1$. Therefore, at this initial stage, low-speed streaks develop on high filtered topography and vice versa. The anticorrelations reduce in the second half of the FPG stage when the lift-up mechanism takes over the diffusive generation of streaks. There is a large scatter among different realizations at this stage. As the streaks are the largest features of the flow, their statistical convergence is slow. Despite low anticorrelations, the energetic streaks at these later stages build on the orientation history before them. This is shown in figure 13 for three representative time instances
 $t=-2{\rm \pi} /3,-{\rm \pi} /3$ and
 $0$ in case h0.06 (
 $r=1$). Initially, the relationship between high topography and low-speed streaks and low topography and high-speed streaks is very strong as expected from cross-correlations, figure 13(
 $a$). This association reduces with streaks getting stronger but it never completely disappears (figure 13
 $b{,}c$). In fact, the most unstable streak for this realization is the low-speed streak at
 $y=32$, which breaks down into turbulent spots at early APG stage (cf. § 4). We see that this streak is initially seeded by a wide bump in
 $30<y<33$ in the diffusive growth stage (figure 13
 $a$), and it grows further from there in the lift-up stage. Figure 12(
 $b$) further compares
 $C^{\{1\}}(\widetilde {u^\prime }, \tilde {\eta })$ for different roughness heights. The initial stage with strong anticorrelations lasts longer with decreasing roughness height due to slow development of streaks. In general,
 $C^{\{1\}}(\widetilde {u^\prime },\tilde {\eta })$ decays with increasing roughness height but differences between h0.04, h0.06 and h0.07 are marginal.
Time evolution of the correlation coefficient  $C^{\{r\}}(\widetilde {u^\prime }, \tilde {\eta })$, (3.21), between streamwise-constant bed elevation and streamwise-constant velocity
 $\widetilde {u^\prime }$ at
 $z=0.5$. (
 $a$) Five different realizations of case h0.06; (
 $b$)
 $C^{\{1\}}(\widetilde {u^\prime }, \tilde {\eta })$ for different roughness heights. Red markers show the phases at which
 $\widetilde {u^\prime }$ and
 $\tilde {\eta }$ are shown in figure 13.

Contours of streamwise-constant fluctuation velocity  $\widetilde {u^\prime}/u_0(t)$ are shown along with the streamwise-constant bed elevation
 $\tilde {\eta }$ in case h0.06 at times: (
 $a$)
 $t=-2{\rm \pi} /3$; (
 $b$)
 $t=-{\rm \pi} /3$; (
 $c$)
 $t=0$. Contours are normalized with the local free-stream velocity at the respective phases (
 $u_0$). The thick contour lines show the level
 $\widetilde {u^\prime }=0$. Bed elevation is magnified 12 times for visibility.

Strong anticorrelations between streaks and bottom elevations at early phases suggest that the boundary layer closely follows the features of the topography. It is shifted up(down)wards over peaks (troughs) inducing negative (positive) streamwise velocity fluctuations over plane-averaged velocity. The extent of these vertical shifts can be quantified by measuring the local distance of a selected layer with constant velocity from the rough surface. Busse, Thakkar & Sandham (Reference Busse, Thakkar and Sandham2017) defined such a thickness function utilizing the time-averaged turbulent velocity. We discard the time averaging and adapt a similar metric,
 \begin{gather} \Delta D_{|\boldsymbol{u}|}(x,y,t;z_d):=z-\eta^{\{r\}}(x,y),\\ \text{such that}\nonumber \end{gather}
 \begin{gather}|\boldsymbol{u}^{\{r\}}(x,y,z,t) |=|U|(z_d,t), \end{gather}
which measures the vertical distance of the velocity isolevel (3.19) from the bottom. Here,  $U$ is the one-dimensional laminar velocity over the flat bottom (
 $h=0$). Therefore, when
 $h=0$,
 $\Delta D_{|\boldsymbol {u}|}=z_d$. We chose
 $z_d=0.2$, which is close to the height of the roughness features in case h0.06. The probability density functions (p.d.f.s) of
 $\Delta D_{|\boldsymbol {u}|}$ for this case (
 $r=1$) are demonstrated in figure 14 for times
 $t=-2{\rm \pi} /3,-{\rm \pi} /3$ and
 $0$. We note that the p.d.f. over the flat bottom would be a delta function. Over the rough bottom the local thickness varies but the probability densities still peak at
 $\Delta D_{|\boldsymbol {u}|}=0.2$ with the steepest peak occurring at
 $t=-2{\rm \pi} /3$. At this early stage, the flow streamlines mostly follow the curvature of bottom protrusions yielding high-speed (low-speed) streaks over troughs (peaks). The p.d.f.s flatten over time and the boundary layer becomes increasingly decorrelated from the details of the topography, which is consistent with the decays after
 $t>-{\rm \pi} /2$ shown in figure 12. At
 $t=0$, the p.d.f. has a long positive tail due to low-speed streaks pushing the boundary layer upwards.
Probability densities of the thickness function  $\Delta D_{|\boldsymbol {u}|}(x,y,t;z_d=0.2)$ (3.18) in case h0.06.

Thus far, we have studied streamwise-constant streamwise fluctuations, i.e. streaks. Production term  $\mathcal {P}_{11}$ is the manifestation of the lift-up effect driven by streamwise-constant vertical fluctuations
 $\widetilde {w^\prime }$. Therefore, an essential part of the receptivity process depends on
 $\widetilde {w^\prime }$. The balance for the kinetic energy of streamwise-constant vertical fluctuations is obtained by multiplying (3.14) by
 $\widetilde {w^\prime }$ and then ensemble averaging, i.e.
 \begin{gather} \underbrace{\frac{1}{Re_\delta}\frac{\partial \langle \widetilde{w^\prime}^2 \rangle}{\partial t}}_{E_{33}} = \underbrace{- \left \langle \widetilde{w^\prime} \left (\frac{\partial \widetilde{ w^{\prime} v^{\prime}}}{\partial y}+\frac{\partial \widetilde{ w^{\prime} w^{\prime}}}{\partial z}\right)\right \rangle}_{\mathcal{T}_{33}} \underbrace{-\left \langle \widetilde{w^\prime} \frac{\partial \widetilde{p^\prime}}{\partial z}\right \rangle}_{\mathcal{\varPi}_{33}}\nonumber\\ +\underbrace{\frac{1}{2Re_\delta}\frac{\partial^2 \langle \widetilde{w^\prime} \widetilde{w^\prime} \rangle}{\partial z^2}}_{\mathcal{D}_{33}} \underbrace{-\frac{1}{Re_\delta} \left \langle \left(\frac{ \partial \widetilde{w^\prime}}{\partial y}\right)^2+\left(\frac{ \partial \widetilde{w^\prime}}{\partial z}\right)^2\right \rangle}_{\varepsilon_{33}}, \end{gather}
where  $\varPi _{33}$ is the rate of work done by the pressure gradient, and the remaining budget terms with the subscript
 $33$ are analogous to the terms with subscript
 $11$ above. There is no production term for the vertical fluctuations. Figure 15 demonstrates the vertical profile of each budget term in case h0.06 at three representative phases
 $t=-2{\rm \pi} /3,-{\rm \pi} /3$ and
 $0$. At
 $t=-2{\rm \pi} /3$, the diffusive transport
 $\mathcal {D}_{33}$ and the pressure-gradient work
 $\varPi _{33}$ are the main contributors to the energy of vertical fluctuations (figure 15
 $a$). At later times,
 $\varPi _{33}$ is the prevalent gain term. In fully turbulent shear flows, this term is usually decomposed into redistribution and transport components, among which the redistribution term drives the transfer of energy from streamwise components to cross-stream components (Pope Reference Pope2000). This redistribution mechanism is turned off in streamwise-constant fluctuations, as the streamwise derivative of the streamwise-constant pressure, hence
 $\varPi _{11}$, vanishes. Therefore, the redistribution and transport can only occur between cross-stream components, and the decomposition does not provide much insight. We need to inspect the instantaneous fields to unravel the origins of
 $\varPi _{33}$.
Energy budget for streamwise-constant vertical fluctuations ( $\widetilde {w^\prime }$), (3.20), in case h0.06 for (
 $a$)
 $t=-2{\rm \pi} /3$; (
 $b$)
 $t=-{\rm \pi} /3$; (
 $c$)
 $t=0$.

Filled-contour distributions of  $\widetilde {u^\prime }$ and
 $\widetilde {p^\prime }$ in case h0.06 are shown in figure 16 with overlaid contours of
 $\widetilde {w^\prime }$ at a representative time instant for the lift-up stage (
 $t=0$). We observe alternating zones of velocities and pressure separated by zero contours of
 $\tilde {w\prime }$ (thick contours). In these zones, low-speed streaks are associated with positive
 $\widetilde {w^\prime }$ and
 $\widetilde {p^\prime }$, and high-speed streaks are associated with negative
 $\widetilde {w^\prime }$ and
 $\widetilde {p^\prime }$.
Filled contours of  $\widetilde {p^\prime }$ (
 $a$) and
 $\widetilde {u^\prime }$ (
 $b$) in case h0.06 at
 $t=0$ are plotted with overlaid contour lines of
 $\widetilde {w^\prime }$. Ten levels of
 $\widetilde {w^\prime }$ between
 $[-3.3\times 10^{-3},3.3\times 10^{-3}]$ are presented, where negative contours are shown with dashed lines. The thick contour lines show
 $\widetilde {w^\prime }=0$.

The filled contours in figure 16( $a$) further show that the magnitude of pressure in every zone decays upwards from the bed. Moreover, the direction of vertical velocity is aligned with the negative pressure gradient, i.e. vertical fluctuations are driven down the pressure gradient, hence, the positive pressure-gradient work
 $-\widetilde {w^\prime } \partial \widetilde {p^\prime }/\partial \widetilde z>0$. This explains the positive correlation between
 $\widetilde {w^\prime }$ and
 $\widetilde {p^\prime }$, i.e. in positive pressure zones, upwards decaying pressure drives the vertical velocity upwards, whereas in negative pressure zones, downwards decaying pressure sets a vertical velocity downwards.
We have seen the alternating  $\widetilde {p^\prime }$ zones play a key role in organizing the
 $\widetilde {w^\prime }$ zones. Here
 $\widetilde {p^\prime }$ is forced by second-order variations of second-order terms based on total fluctuation velocities
 $v^{\prime }$ and
 $w^{\prime }$, cf. (3.15). Among these forcing terms,
 $\partial ^2 \langle w^{\prime } w^{\prime }\rangle /\partial z^2$ has no effect on spanwise variations in
 $\widetilde {p^\prime }$, and the cross-term between
 $v^{\prime }$ and
 $w^{\prime }$ is vanishingly small. The remaining second-order terms can be decomposed into filtered and residual small-scale components, e.g.
 $\widetilde {w^{\prime }w^{\prime }}=\widetilde {w^\prime } \widetilde {w^\prime }+\widetilde {w^{{\prime \prime }}w^{{\prime \prime }}}$. Figure 17(
 $b$–
 $e$) depict the line contours of the four decomposed forcing terms along with the filled contours of
 $\widetilde {u^\prime }$ in case h0.06 at the instance
 $t=0$. The term with small-scale vertical fluctuations clearly dominates over other terms (figure 17
 $b$). The intensive regions of
 $\partial ^2 \widetilde {w^{\prime \prime } w^{\prime \prime }}/\partial z^2$ are associated with energetic small-scale vertical fluctuations, which are shown in figure 17(
 $a$). Therefore, the residual fluctuations
 $w^{\prime \prime }$ are the essential drivers of
 $\widetilde {p^\prime }$. These fluctuations are produced when the boundary layer passes over bed topography and, therefore, they scale with the shear imposed at the bed level. In this regard, the energy of small-scale vertical fluctuations are clearly higher in zones of high-speed streaks (positive
 $\widetilde {u^\prime }$ zones) due to higher shear imposed at the footprints of high-speed streaks. This large-scale amplitude modulation is similar to the one driving inner–outer interactions in turbulent boundary layers (Mathis, Hutchins & Marusic Reference Mathis, Hutchins and Marusic2009). Enhanced small-scale energy along high-speed streaks leads to stronger second-order derivatives (
 $\partial ^2 \widetilde {w^{\prime \prime } w^{\prime \prime }}/\partial z^{2})$ (figure 17
 $b$), thus, stronger forcing of pressure along high-speed streaks. As this forcing is in the negative direction (note the negative sign in (3.15)), this creates a negative pressure zone along high-speed streaks. Therefore, the modulation of small-scale fluctuations by large-scale streaks plays a key role in coupling high
 $\widetilde {u^\prime }$ with low
 $\widetilde {p^\prime }$, and vice versa.
Filled contours of  $\widetilde {u^\prime }$ in case h0.06 at
 $t=0$ are plotted with overlaid line contours of (
 $a$)
 $\widetilde {w^{\prime \prime } w^{\prime \prime }}$, (
 $b$)
 $\partial ^2 \widetilde {w^{\prime \prime } w^{\prime \prime }}/\partial z^2$, (
 $c$)
 $\partial ^2 \widetilde {w^\prime } \widetilde {w^\prime }/\partial z^2$, (
 $d$)
 $\partial ^2 \widetilde {v^{\prime \prime } v^{\prime \prime }}/\partial y^2$ and (
 $e$)
 $\partial ^2 \widetilde {v^\prime } \widetilde {v^\prime }/\partial y^2$. Line contours in (
 $a$) span 12 levels between
 $[2.5\times 10^{-6},3\times 10^{-5}]$, and line contours in (
 $b$–
 $e$) span 12 levels between
 $[-2.64\times 10^{-4},2.64\times 10^{-4}]$, where negative contours are shown with dashed lines.

The effect of large-scale amplitude modulation can be quantified by correlations between large-scale velocity  $\widetilde {u^\prime }$ and the energy of small-scale vertical fluctuations
 $\widetilde {E_w^{\prime \prime }} := \widetilde {w^{\prime \prime } w^{\prime \prime }}/2$, i.e.
 \begin{equation} C(\widetilde{u^\prime},\widetilde{E_w^{\prime\prime}},z,t)=\frac{\langle \widetilde{u^\prime}(y,z,t) \widetilde{E_w^{\prime\prime}}(y,z,t) \rangle}{ \sqrt{\langle \widetilde{u^\prime}^2\rangle}\sqrt{ \langle \widetilde{E_w^{\prime\prime}}^2\rangle}}. \end{equation}
The vertical profiles of these cross-correlation coefficients are plotted in figure 18 for cases h0.01, h0.04 and h0.06. Here  $C(\widetilde {u^\prime }, \widetilde {E_w^{\prime \prime }})$ increases dramatically with the roughness height. While the amplitude modulation is ineffective in h0.01 (
 $C(\widetilde {u^\prime }, \widetilde {E_w^{\prime \prime }})<0.1$ at all times), it is prevalent in h0.06 with
 $C(\widetilde {u^\prime }, \widetilde {E_w^{\prime \prime }})$ reaching approximately 70
 $\%$ correlation at later times.
Profiles of cross-correlation coefficient  $C(\widetilde {u^\prime }$,
 $\widetilde {E_w^{\prime \prime }})$, where
 $\widetilde {E_w^{\prime \prime }} := \widetilde {w^{\prime \prime } w^{\prime \prime }}$/2. Results for case (
 $a$) h0.01; (
 $b$) h0.04; (
 $c$) h0.06. Colour coding is the same for all figures.

Figure 19 summarizes the second stage of the receptivity process, in which streaks are generated by the lift-up mechanism. This stage is characterized by a positive feedback loop between streamwise-constant streaks and vortices, i.e. cross-stream components ( $\widetilde {v^{\prime \prime }}, \widetilde {w^{\prime \prime }}$), among which we only consider
 $\widetilde {w^{\prime \prime }}$ for brevity. Streaks (
 $I$) modulate the small-scale vertical motions,
 $\widetilde {w^{\prime \prime } w^{\prime \prime }}$ (
 $IIA$), whose vertical derivatives (
 $IIB$) in turn impose alternating zones of high and low streamwise-constant pressure (
 $III$) aligned with low- and high-speed streaks, respectively. The pressure gradients in these zones induce stronger streamwise-constant vertical velocities, hence vortices (
 $IV$). Finally, the vortices stir the boundary layer and generate more intense streaks (
 $IV\rightarrow I$).
Positive feedback loop between streamwise-constant streaks and vortices. The cross-stream components have similar amplitudes, and only the vertical velocity component is considered to represent the vortices.

4. Breakdown stage: transition modes
The receptivity stage was characterised by the dynamics of streamwise-constant perturbations  $\widetilde {\boldsymbol {u}^\prime }$. The breakdown stage will now be characterized by the growth of residual perturbations
 $\boldsymbol {u}^{\prime \prime }$ due to primary (orderly transition) or secondary (bypass transition) instabilities. The paths leading to these instabilities are strongly mediated by streaks. Depending on their amplitude, streaks can damp the growth in regions they occupy, trigger local breakdown by rapidly growing secondary instabilities, or be completely dormant in an orderly transition scenario (Önder & Liu Reference Önder and Liu2020). We will study these scenarios in this section.
The time evolution of mean skin-friction drag  $\tau _b^*$ is plotted in figure 20 for cases h0.01, h0.04, h0.06 and h0.07. In all cases, there is a rapid rise in the skin-friction drag, once the transition sets in. It is clear that the breakdown to turbulence has a much faster time scale compared with the wave time scale. Therefore, during breakdown the streamwise-constant fields have much slower dynamics than the rapidly growing residual perturbations. In this regard, the instantaneous streaky fields represent a new laminar base state on which the instabilities grow. These base fields are obtained by applying the filter on instantaneous velocity
 $\boldsymbol {u}$,
 \begin{equation} \tilde{\boldsymbol{u}}=(\langle u \rangle,0,0)+(\widetilde{u^\prime},0,0). \end{equation}
We have neglected  $\widetilde {v^\prime }$ and
 $\widetilde {w^\prime }$, as
 $\|\widetilde {v^\prime }\|\approx \|\widetilde {w^\prime }\| \ll \|\widetilde {u^\prime }\|$ for
 $Re_\delta \gg 1$.
Temporal evolution of mean skin-friction drag for cases h0.01, h0.04, h0.06 and h0.07. Laminar skin-friction drag over a flat bed ( $h=0$) is also plotted. Skin frictions are normalized by
 $\rho ^* U_{0m}^{*2}{Re_\delta }^{-1}$.

The growth of secondary perturbations on a streak can be investigated by averaging the small-scale energy over the streamwise direction, i.e. by filtering the small-scale energy  $\widetilde {k^{\prime \prime }}(y,z,t)=\widetilde {u_i^{\prime \prime }u_i^{\prime \prime }}/2$. The instantaneous balance of
 $\widetilde {k^{\prime \prime }}$ is derived in four steps: (i) filter (2.6); (ii) subtract the resulting filtered set of equations from (2.6) to obtain momentum equations for
 $\boldsymbol {u}^{{\prime \prime }}$, (iii) apply a scalar product between vectorial terms in the resulting momentum equation and
 $\boldsymbol {u}^{{\prime \prime }}$; (iv) filter the resulting energy equations. As a result, we obtain
 \begin{equation} \frac{2}{Re_\delta} \frac{\partial \widetilde{k^{\prime\prime}}}{\partial t}+\tilde{\boldsymbol{\nabla}} \boldsymbol{\cdot} \widetilde{\boldsymbol{T}^{\prime\prime}}= \widetilde{\mathcal{P}^{\prime\prime}} -\tilde{\varepsilon^{\prime\prime}}, \end{equation}
where  $\widetilde {\mathcal {P}^{\prime \prime }}$ represents the small-scale production rate expressed by
 \begin{equation} \widetilde{\mathcal{P}^{\prime\prime}}={-}\widetilde{u^{\prime\prime} v^{\prime\prime}}\frac{\partial \widetilde u}{\partial y}-\widetilde{u^{\prime\prime} w^{\prime\prime}}\frac{\partial \widetilde u}{\partial z}, \end{equation}
 $\tilde {\varepsilon ^{\prime \prime }}$ is the dissipative term for streamwise-varying fluctuations
 \begin{equation} \tilde{\varepsilon^{\prime\prime}}=\frac{2}{Re_\delta} \widetilde{s_{ij}^{\prime\prime} s_{ij}^{\prime\prime}}, \end{equation}
with  $s_{ij}^{\prime \prime }=1/2 (\partial u_i^{\prime \prime }/\partial x_j+\partial u_j^{\prime \prime }/\partial x_i)$ being the rate of strain tensor involving small-scale motions, and
 $\widetilde {\boldsymbol {T}^{\prime \prime }}$ contains the turbulent transport terms
 \begin{equation} \widetilde{T_i^{\prime\prime}}=\frac{1}{2}\widetilde{u_i^{\prime\prime} u_j^{\prime\prime} u_j^{\prime\prime}}+\widetilde{u_i^{\prime\prime} p^{\prime\prime}}-\frac{2}{Re_\delta}\widetilde{u_j^{\prime\prime} s_{ij}^{\prime\prime}}. \end{equation}
Among these budget terms we will focus only on the production term in (4.3), as the instabilities are driven by this term.
The transition to turbulence in case h0.01 is shown in figure 21 using instantaneous fields, small-scale kinetic energy ( $\widetilde {k^{\prime \prime }}$) and production rate (
 $\widetilde {\mathcal {P}^{\prime \prime }}$) at two time instances
 $t=12{\rm \pi} /36$ and
 $15{\rm \pi} /36$, cf. also supplementary movie 2 where the time evolution of the magnitude of instantaneous vertical velocity
 $|w|$ on the horizontal plane at
 $z=1.3$ is shown for h0.01. An orderly transition scenario is observed, in which spanwise vortices emerge (figure 21
 $e$). These vortices are visualized using a positive isosurface of the
 $Q$ field, which is the second invariant of the velocity gradient tensor (Hunt, Wray & Moin Reference Hunt, Wray and Moin1988),
 \begin{equation} Q=\tfrac{1}{2}(\varOmega_{ij}\varOmega_{ij}-s_{ij}s_{ij}), \end{equation}
where  $\varOmega _{ij}=1/2 (\partial u_i /\partial x_j- \partial u_j/\partial x_i )$ is the rate of spin tensor, and
 $s_{ij}=1/2 (\partial u_i /\partial x_j+\partial u_j/\partial x_i)$ is the rate of strain tensor. The vortices have a constant streamwise spacing of
 $l_v=L_x/4=15\delta _s$. This spacing perfectly matches the wavelength of the most linearly unstable modes in a SWBL at
 $Re_\delta =2000$ (cf. figure 12a in Önder & Liu Reference Önder and Liu2020). The production is localized at
 $z\approx 1.2$ where the instability is generated (figure 21
 $c$). At
 $15{\rm \pi} /36$, the spanwise vortices have become two orders of magnitude more energetic (figure 21
 $b$), and are elevated further into free stream. At this phase, the coherent vortices are turbulent structures that are in the process of breakdown to chaotic small-scale motions, cf. figure 21(
 $f$). In this global transition scenario, streaks play no role, as they are very weak.
Orderly transition in case h0.01. The data at times ( $a{,}c{,}e$)
 $t=12{\rm \pi} /36$; (
 $b{,}d{,}f$)
 $t=15{\rm \pi} /36$. Line contours in (
 $a$–
 $d$) show the distribution of
 $\tilde {u}=\langle u \rangle + \widetilde {u^\prime }$ (4.1) using ten levels. Filled contours show the distribution of the filtered small-scale kinetic energy
 $\widetilde {k^{\prime \prime }}$ (
 $a{,}b$) and the production rate
 $\widetilde {\mathcal {P}^{\prime \prime }}$ (
 $c{,}d$). (
 $e{,}f$) Filled contours show the distribution of instantaneous streamwise velocity
 $u$. Vortical structures are visualized using a positive isosurface of
 $Q$: (
 $e$)
 $Q=2.5\times 10^{-4}$; (
 $f$)
 $Q=8\times 10^{-3}$.

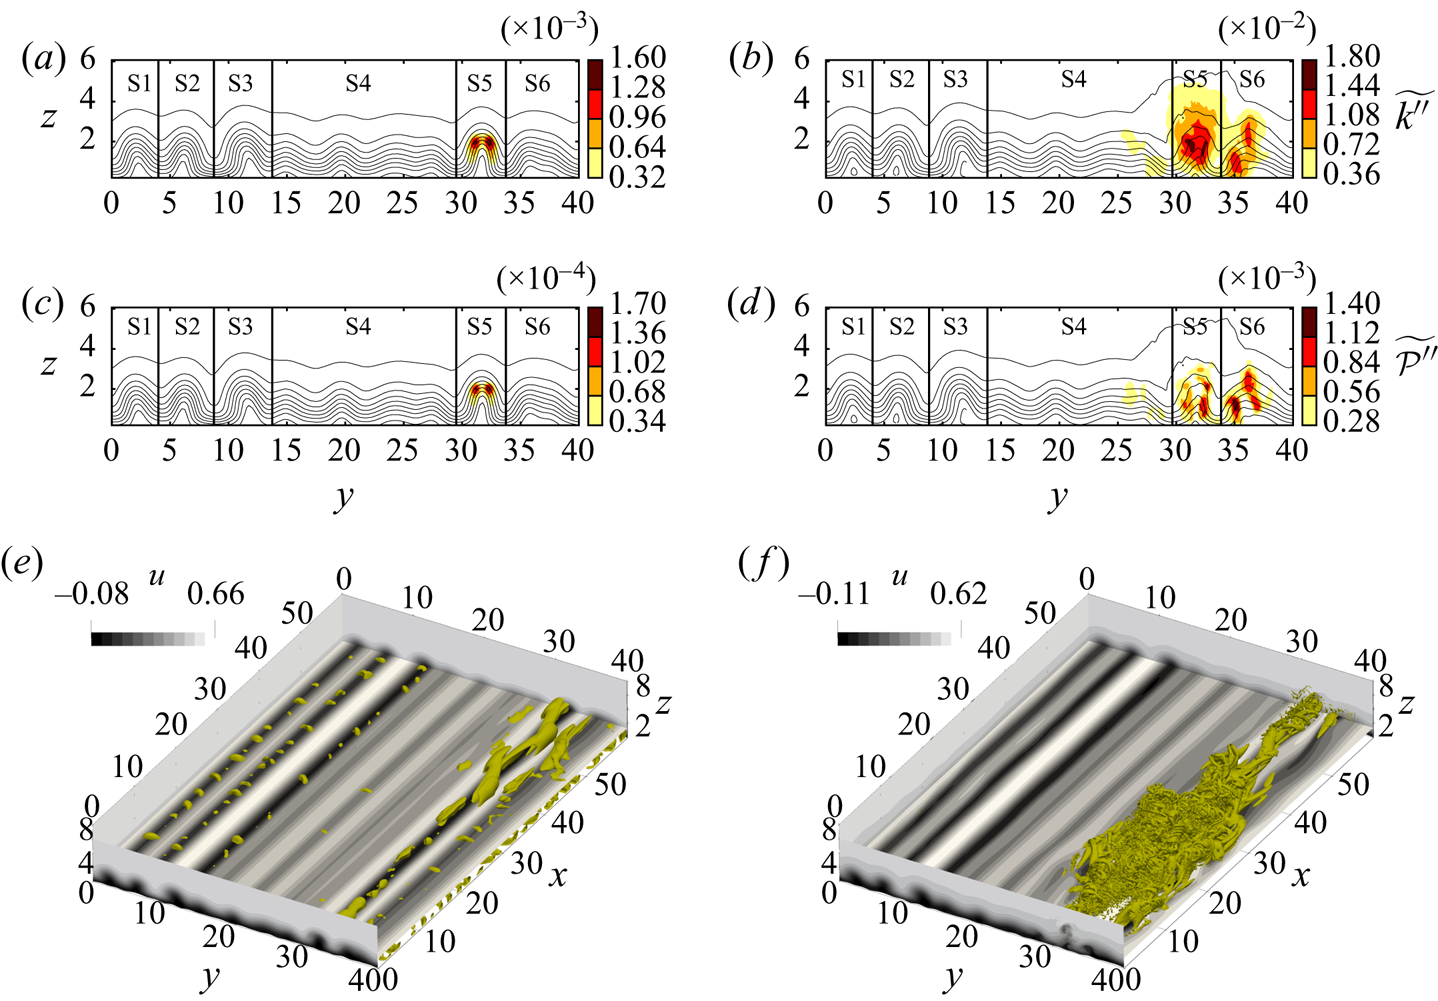
The transition to turbulence in case h0.06 is demonstrated in figure 22 using instantaneous data at times  $t=19{\rm \pi} /90$ and
 $22{\rm \pi} /90$. The boundary layer is corrugated along its span by highly elevated streaks (figure 22
 $a$). We observe five such streaks (S1–S3, S5 and S6 in figure 22
 $a$–
 $d$) and a relatively flat region at the centre with weak streaks (S4). Unlike the transition in h0.01, the transition in h0.06 is of a local nature and is initiated by a sinuous instability taking place on streak S5, cf. figure 22(
 $e$). Both production and kinetic energy concentrate at an outer layer at
 $z\approx 2$ marking the location of the critical layer of the instability (figure 22
 $a{,}c$). The sinuous nature and strongly elevated critical layer suggest that this instability is an instance of outer-streak instabilities cited by Önder & Liu (Reference Önder and Liu2020). The outer instabilities have very high growth rates and rapidly lead to bypass transition. This is observed in figure 22(f), where streak S5 broke down into a turbulent spot. Turbulence is contained in this region and the rest of the boundary layer is still laminar. In later times, the turbulent spot spreads to the whole computational domain and the breakdown to turbulence is completed. This can be seen in supplementary movie 3 where the time evolution of
 $|w|$ on the horizontal plane at
 $z=1.3$ is shown for h0.06. The instability waves did not emerge in this case.
Bypass transition in case h0.06 via a local streak instability. The data at times ( $a{,}c{,}e$)
 $t=19{\rm \pi} /90$; (
 $b{,}d{,}f$)
 $t=22{\rm \pi} /90$. Line contours in (
 $a$–
 $d$) show the distribution of
 $\tilde {u}=\langle u \rangle + \widetilde {u^\prime }$ using ten levels. Filled contours show the distribution of the filtered small-scale kinetic energy
 $\widetilde {k^{\prime \prime }}$ (
 $a{,}b$) and the production rate
 $\widetilde {\mathcal {P}^{\prime \prime }}$ (
 $c{,}d$). (
 $e{,}f$) Filled contours show the distribution of instantaneous streamwise velocity
 $u$. Vortical structures are visualized using a positive isosurface of
 $Q$: (
 $e$)
 $Q=2.5\times 10^{-4}$; (
 $f$)
 $Q=8\times 10^{-3}$.

A mixed transition is demonstrated in figure 23, which occurs in case h0.055. Figure 24(a) further shows the length-normalized kinetic energy in each subregion (S1–S6),
 \begin{equation} k_{\mathcal{V},i}(t)=\frac{1}{2L_{y,i}}\iint_{A_i} \widetilde{u_i^{\prime\prime} u_i^{\prime\prime}} (y,z,t)\, {\textrm{d}y}\,\mathrm{d}z, \end{equation}
where  $A_i$ and
 $L_{y,i}$ are the area and the spanwise length of the subregion, respectively. Figure 24(b) additionally plots the growth rates of energy in each subregion,
 \begin{equation} \omega_{\mathrm{i},i}(t)=\frac{1}{2}\frac{\mathrm{d}\log{k_{\mathcal{V},i}}}{\mathrm{d}t}. \end{equation}
Small-scale kinetic energy, the vertical kinetic energy and the production rate at  $t=27{\rm \pi} /90$ are plotted in figures 23(
 $a$), 23(
 $c$) and 23(
 $e$), respectively. In h0.055 streaks are slightly weaker compared with those in h0.06, and none of them develops rapidly growing outer instabilities. Streaks S1–S3, S5 and S6 all developed instabilities on inner shear layers close to the bed. These inner instabilities have a slow growth rate of
 $\omega _\mathrm {i}/Re_\delta \approx 3\times 10^{-3}$, cf. figure 24(
 $b$). These slow growth rates are consistent with the inner-streak instabilities analysed by Önder & Liu (cf. the case
 $A=15$ in figure 12
 $c$ in Önder & Liu Reference Önder and Liu2020). Due to their slow growth, the observed inner instabilities did not yet lead to any intense turbulent structure (figure 23
 $g$). In contrast to streaky regions, region S4 is relatively quiet at
 $t=27{\rm \pi} /90$, and fluctuations are very weak (cf. S4 in figures 23
 $a$ and 24
 $a$). This condition changes abruptly due to spontaneously emerging instability waves, and we later observe, at
 $t=30{\rm \pi} /90$, coherent spanwise vortices with streamwise spacing of
 $\lambda _x=15$ in S4, cf. red Q-isosurfaces in figure 23(
 $h$). The quasi-two-dimensional instability taking place in S4 has a higher growth rate than inner-streak instabilities with values in the range
 $\omega _{\mathrm {i},4}/Re_\delta \approx 0.01$ (figure 24
 $b$). Compared with the local transitional features in inner-streak instabilities, spanwise coherent vortices are more global structures, which occupy the whole boundary layer thickness. This can be seen in the distribution of vertical kinetic energy in figure 23(
 $d$). Filled contours have spread everywhere in the boundary layer in S4, where the vertical perturbations in other streak regions are still localized around the critical layer of the instability. At later times, the quasi-two-dimensional instability in S4 spreads to neighbouring regions S3 and S5, and due to rapid growth of this instability the energies in these regions are significantly higher, e.g.
 $k_{\mathcal {V},i}$ of S3–S5 in the last data point in figure 24(
 $a$) is approximately four times of that of S1, S2 and S6. The effect of spontaneously emerging spanwise vortices can also be seen in supplementary movie 4 where the time evolution of
 $|w|$ is shown on the horizontal plane at
 $z=1.3$.
Mixed transition in case h0.055. The data at times ( $a{,}c{,}e{,}g$)
 $t=27{\rm \pi} /90$; (
 $b{,}d{,}f{,}h$)
 $t=30{\rm \pi} /90$. Line contours in (
 $a$–
 $f$) show the distribution of
 $\tilde {u}=\langle u \rangle + \widetilde {u^\prime }$ using ten levels. Filled contours show the distribution of the filtered small-scale kinetic energy
 $\widetilde {k^{\prime \prime }}$ (
 $a{,}b$), the vertical energy
 $\widetilde {w^{\prime \prime } w^{\prime \prime }}/2$ (
 $c{,}d$) and the production rate
 $\widetilde {\mathcal {P}^{\prime \prime }}$ (
 $e{,}f$). (
 $g{,}h$) Filled contours show the distribution of instantaneous streamwise velocity
 $u$. Vortical structures are visualized using a positive isosurface of
 $Q$: (g)
 $Q=2.5\times 10^{-4}$ and (h)
 $Q=5\times 10^{-4}$. Streaky regions S1–S3, S5, S6 are coloured in yellow, and S4 is coloured in red.


Figure 25 compares the energy ( $k_{\mathcal {V},5}$) and growth rate (
 $\omega _{\mathrm {i},5}$) of streak instabilities in region S5 for h0.055, h0.06 and h0.07. We note that case h0.07 follows a similar transition path to h0.06, and breaks down to turbulence following an outer-streak instability in S5. Case h0.07 has the earliest breakdown among the cases with transition completing at the start of the APG stage. The maximum growth rate in this case is approximately
 $\omega _{\mathrm {i},5}/Re_\delta \approx 0.028$. This value perfectly matches the theoretical predictions for outer instabilities in high-amplitude streaks in SWBLs (cf. the case
 $A=100$ in figure 12
 $c$ in Önder & Liu Reference Önder and Liu2020). The outer instability in h0.06 occurs approximately
 $2{\rm \pi} /9$ later, and it has a maximum growth rate of
 $\omega _{\mathrm {i},5}/Re_\delta \approx 0.019$. The growth rates of outer-streak instabilities are significantly higher than that of the inner-streak instability. When compared with
 $\omega _{\mathrm {i},4}$, they dominate over orderly instabilities as well. Therefore, the outer-streak instabilities are the fastest developing instabilities in SWBLs.


5. Conclusions
The present work studies the transition to turbulence in a bottom boundary layer developing over random bottom topography beneath a solitary wave. The bed is composed of the superposition of wave-like undulations with random amplitude. A set of direct numerical simulations with various roughness levels is conducted, in which the flow around bed corrugations is well resolved by using a coordinate transformation. A relatively high Reynolds number ( $Re_\delta =2000$) is selected to allow a wide range of transition scenarios.
In the first part, we analysed the receptivity of the boundary layer flow to perturbations introduced by bottom topography. The boundary layer responds to these broadband perturbations selectively and develops streamwise-elongated streaks, which occupy the whole streamwise extent of the periodic computational domain. These streamwise-constant streaks are generated by two successive physical mechanisms. Initially, when the free-stream velocity is weak, the interaction of the boundary layer with the topography of the bed is linear. To this end, streamwise-constant modes of the topography induce streamwise-constant streaks by diffusive transport, where high- and low-speed streaks are positioned on the depressed and elevated regions, respectively. At later phases, the boundary layer shear becomes stronger and its interaction with streamwise-constant vertical velocity further amplifies the streaks. Physically, the amplification is driven by the convective transport known as the lift-up mechanism, in which streamwise-constant vortices stir the mean flow. This second stage of streak amplification is characterised by nonlinear feedback loops between streamwise-constant streaks and vortices. When the streaks reach high amplitudes, they begin to modulate the small-scale perturbations at their footprints. The vertical component of small-scale fluctuations in turn force the streamwise-constant pressure field and create low- and high-pressure zones along high- and low-speed streaks, respectively. The gradients in these pressure zones drive the streamwise-constant vertical velocity, and generate stronger vortices. Stronger vortices in turn generate even stronger streaks via the lift-up mechanism, which completes the positive feedback loop. The consequence of this nonlinear feedback loop is evident in the scaling of streak amplitudes with the roughness height. For instance, at the start of the APG stage, the case with  $h=0.06$ has streaks approximately 85 times stronger than the case with
 $h=0.01$.
The transition path in the breakdown stage heavily depends on the amplitude of streaks in the respective subregions of the boundary layer. In this regard, three different scenarios are observed: (i) when the streaks are weak the flow goes through orderly transition initiated by two-dimensional instability waves; (ii) inner-streak instabilities are observed in the regions with moderate-amplitude streaks; (iii) outer-streak instabilities are observed in the regions with high-amplitude streaks. Consistent with the previous analysis by Önder & Liu (Reference Önder and Liu2020), inner-streak instabilities have slower growth rates than primary modal instabilities, and the transition to turbulence is delayed in the regions occupied by moderate-amplitude streaks. Therefore, the current work confirms the stabilizing role of moderate-amplitude streaks. In contrast to inner instabilities, outer instabilities grow very fast on highly elevated streaks. Turbulent spots are nucleated in these regions, and a bypass-transition scenario is initiated.
An essential element of the transition over randomly rough topography is the interaction between different transition modes growing in exclusive parts of the domain. We have presented an instance of this phenomenon, in which two-dimensional instabilities and inner-streak instabilities grow separately and eventually interact. However, many additional scenarios are possible that would require larger domains to study. Larger domains will allow much longer wavelengths in the topography, hence, larger scale modulations in the bed elevation. Such modulations can lead to boundary layers hosting a wide spectrum of streak amplitudes. Consequently, bypass, orderly or damped transition scenarios can be initiated separately, and spanwise vortices and turbulent spots can coexist and interact as in the experiments of Sumer et al. (Reference Sumer, Jensen, Sørensen, Fredsøe, Liu and Carstensen2010). Such mixed scenarios can occur frequently in nature over inhomogeneous seabeds. Further study on their dynamics is required to gain a more global perspective on roughness-induced transition in wave boundary layers.
Supplementary movies
Supplementary movies are available at https://doi.org/10.1017/jfm.2020.1141.
Acknowledgements
The computational work for this article was fully performed on resources of the National Supercomputing Centre, Singapore (https://www.nscc.sg).
Funding
The research reported here has been supported by a Tier 2 grant from Ministry of Education of Singapore to National University of Singapore.
Declaration of interests
The authors report no conflict of interest.