





Psychotic experiences, defined as attenuated and typically transient self-reported psychotic-like phenomena, occur in 5–15% of the general population Reference van Os and Linscott1 and can vary widely in their severity and distress caused. Reference Wüsten, Schlier, Jaya, Bartels-Velthuis, van Beveren and Bruggeman2 By contrast, psychotic disorders, such as schizophrenia (SCZ), schizoaffective disorder and bipolar disorder, have a lifetime prevalence of 3% and are characterised by severe symptoms and significant distress and impairment. Reference Perälä, Suvisaari, Saarni, Kuoppasalmi, Isometsä and Pirkola3 The psychosis continuum model conceptualises psychotic phenomena as existing along a spectrum ranging from common, low-level experiences to severe psychotic disorders. Reference Johns and van Os4–Reference Jonas, Cannon, Docherty, Dwyer, Gur and Gur6 In support of this model, psychotic experiences and psychotic disorders have been found to show overlapping sociodemographic and environmental risk factors, such as childhood adversity, cannabis use and migration, Reference Linscott and van Os7,Reference van Os, Linscott, Myin-Germeys, Delespaul and Krabbendam8 as well as neurocognitive deficits in working memory and processing speed. Reference van Os, Linscott, Myin-Germeys, Delespaul and Krabbendam8,Reference Sitskoorn, Aleman, Ebisch, Appels and Kahn9 This dimensional framework, which challenges current clinical practice where psychotic disorders are treated as distinct, dichotomous diagnoses, suggests that subclinical psychotic experiences may share aetiological mechanisms with SCZ. Reference Guloksuz10 Understanding these mechanisms holds promise in the advancement of theoretical models of psychosis and improves prediction.
PGS across the psychosis continuum
Advances in molecular genetics have established that psychotic disorders are highly polygenic, where the latest SCZ Genome-Wide Association Study (GWAS) identified 287 distinct genomic loci associated with SCZ. Reference Trubetskoy, Pardiñas, Qi, Panagiotaropoulou, Awasthi and Bigdeli11 Polygenic scores (PGS) offer a continuous, weighted sum of the total genetic liability from common genetic variants identified through GWAS, Reference Lewis and Vassos12 and thus are a scalable approach with which to investigate the association between genetic liability and phenotypic severity across the psychosis continuum. Because GWAS calculates the genetic differences between established psychosis cases and controls, it tends to differentiate these well at the group level. Reference Perkins, Olde Loohuis, Barbee, Ford, Jeffries and Addington13,Reference Smigielski, Papiol, Theodoridou, Heekeren, Gerstenberg and Wotruba14 However, studies that have applied PGS to investigate psychotic experiences have found conflicting results. Although earlier and larger studies have found significant differences in SCZ-PGS among individuals with and without psychotic experiences, Reference Ronald and Pain15,Reference Legge, Jones, Kendall, Pardiñas, Menzies and Bracher-Smith16 more recent studies found no such differences. Reference Mas-Bermejo, Papiol, Via, Rovira, Torrecilla and Kwapil17,Reference Meller, Schmitt, Stein, Brosch and Mosebach18 Notably, some have found psychotic experiences to be more strongly associated with polygenic liability for major depressive disorder (MDD) than SCZ. Reference Legge, Jones, Kendall, Pardiñas, Menzies and Bracher-Smith16,Reference Pain, Dudbridge, Cardno, Freeman, Lu and Lundstrom19 Psychotic experiences have also been associated with genetic risk for other psychiatric disorders, including bipolar disorder Reference Smigielski, Papiol, Theodoridou, Heekeren, Gerstenberg and Wotruba14,Reference Legge, Jones, Kendall, Pardiñas, Menzies and Bracher-Smith16 and autism spectrum disorder, Reference Legge, Jones, Kendall, Pardiñas, Menzies and Bracher-Smith16 indicating shared genetic liability across disorders.
Very few studies have examined PGS at multiple levels on the psychosis continuum, because most have relied on binary group comparisons. In the small number of studies that have adopted a multilevel approach including controls, subclinical and clinical psychosis groups findings suggest a general trend of increasing polygenic risk with greater phenotypic severity. Reference Perkins, Olde Loohuis, Barbee, Ford, Jeffries and Addington13,Reference Smigielski, Papiol, Theodoridou, Heekeren, Gerstenberg and Wotruba14,Reference Bigdeli, Bacanu, Webb, Walsh, O’Neill and Fanous20 However, findings within the clinical high risk (CHR) for psychosis group remain inconsistent: some find SCZ-PGS in this group to be significantly lower from diagnosed first-episode psychosis (FEP) groups but not different to controls. Reference Perkins, Olde Loohuis, Barbee, Ford, Jeffries and Addington13 One study found no differences in SCZ-PGS, but those with CHR for psychosis had significantly higher PGS for bipolar disorder than controls. Reference Smigielski, Papiol, Theodoridou, Heekeren, Gerstenberg and Wotruba14 These mixed findings underscore the need for harmonised, transdiagnostic and dimensional designs to better understand genetic architecture across the psychosis spectrum.
Study objectives
The present study aims to map polygenic liability across the early psychosis continuum focusing on four levels along this phenotypic spectrum, i.e. no symptoms (controls), subclinical psychotic experiences, clinical high risk and psychotic disorder. We harmonise phenotypic psychosis groups and genetic data across five cohorts recruited from south-east London, encompassing diverse ancestry groups. We calculated the PGS for SCZ, bipolar disorder and MDD – psychiatric disorders that may clinically present with psychotic symptoms – to examine their individual and combined associations with a hierarchical classification along the psychosis continuum. Bipolar disorder-PGS (BD-PGS) and MDD-PGS were included alongside SCZ-PGS to test whether affective genetic liability contributed independently to phenotypic severity, reflecting the inclusion of affective psychoses within FEP cohorts. We hypothesised that (a) the psychotic experience and CHR groups reflect intermediate levels of genetic liability, with higher PGS than controls and lower PGS than individuals with psychotic disorders; (b) SCZ-PGS, compared with BD- and MDD-PGS, most closely tracks the stepwise increase in phenotypic severity across the continuum; and (c) combining multiple PGS enhances the model’s predictive power across the psychosis continuum phenotype compared with models using single PGS.
Method
Cohorts and phenotypic definitions
The study utilises data from five cohorts recruited in south-east London by research teams at King’s College London. All studies received ethical approval from the relevant research ethics committees, and all participants provided written informed consent. The authors assert that all procedures contributing to this work comply with the ethical standards of the relevant national and institutional committees on human experimentation, and with the Helsinki Declaration of 1975 as revised in 2013. All procedures involving human subjects were approved by South London and Maudsley and Institute of Psychiatry Research Ethics Committee (approval references: SELCoH CREC/07/08-152, EU-GEI WP5 10/H0721/51, OASIS 2002/069, GAP/EU-GEI WP2 (London) baseline 05/Q0706/158, GAP/ EU-GEI WP2 (London) follow-up 17/NI/0011). Full inclusion and exclusion criteria for each cohort are provided in Supplementary Table 1 available at https://doi.org/10.1192/bjp.2026.10795.
Each cohort contributed at least one psychosis and one control group recruited from the same population. The continuum comprised four groups: (a) controls, (b) individuals reporting psychotic experiences in the general population, (c) CHR individuals who did not transition to psychosis and (d) individuals diagnosed with a FEP at baseline or those at clinical high risk who transitioned to FEP during follow-up.
Individuals with psychotic experiences were identified in the South East London Community Health (SELCoH) Reference Hatch, Frissa, Verdecchia, Stewart, Fear and Reichenberg21 study, a population-based study in which participants completed the psychosis screening questionnaire (PSQ), Reference Bebbington and Nayani22 which assessed psychotic experiences within the past year. Those who endorsed one or more items in the PSQ were classified as the psychotic experiences group, with the remainder assigned to the control group.
Clinical high-risk participants were recruited from two studies: Outreach and Support in South London (OASIS) Reference Fusar-Poli, Spencer, De Micheli, Curzi, Nandha and McGuire23 and the London site recruitment for the European Network of National Schizophrenia Networks Studying Gene–Environment Interactions (EU-GEI): GxE Prodrome Working Package 5. 24 CHR status was assessed using the Comprehensive Assessment of At-Risk Mental States (CAARMS), Reference Yung, Yung, Pan Yuen, Mcgorry, Phillips and Kelly25 with participants followed up for 2 years to determine conversion to FEP Reference Fusar-Poli, Bonoldi, Yung, Borgwardt, Kempton and Valmaggia26 using either ICD-10 27 or CAARMS/2006 criteria.
FEP cases were drawn from two FEP case–control cohorts: the London site from EU-GEI Incidence and First-Episode Case–Control Working Package 2 Reference Gayer-Anderson, Jongsma, Di Forti, Quattrone, Velthorst and de Haan28 and the Genetics and Psychosis (GAP) study. Reference Di Forti, Iyegbe, Sallis, Kolliakou, Falcone and Paparelli29 Furthermore, participants from the clinical high-risk samples were included if they had transitioned to FEP at the 2-year follow-up. FEP was diagnosed using the ICD-10 criteria for a diagnosis of psychosis: F20–9 (SCZ, schizotypal and delusional disorders), F31.2, F31.5, F32.3 (affective psychosis) 27 validated by the Schedule for Clinical Assessment in Neuropsychiatry. 30
Genotyping, quality control and PGS computation
Genomic DNA was isolated from whole blood and genotyped using Illumina HumanCoreExome-24 BeadChips (Illumina Inc., San Diego, California, USA) in the GAP and OASIS studies, Illumina Infinium Psych-Array BeadChips (Illumina Inc., San Diego, California, USA) in both EU-GEI cohorts and the UK Biobank Axiom Array in SELCoH. Single-nucleotide proteins (SNPs) with minor allele frequency <1%, SNPs and individuals with >1% missingness (iteratively from 10%) and SNPs with a Hardy–Weinberg equilibrium of p < 10−6 were removed from the sample. Imputation was conducted via the Sanger Imputation Service (https://www.sanger.ac.uk/tool/sanger-imputation-service/) using the Haplotype Reference Consortium (release 1.1) panel in the PBWT + Eagle pipeline. Following imputation, SNPs with an imputation INFO score ≤0.8 were excluded from further analyses. All post-imputation quality control was performed in individual ancestry groups to maximise prediction accuracy.
PGS were calculated using the most recent GWAS of the Psychiatric Genomics Consortium (PGC3) on SCZ, Reference Trubetskoy, Pardiñas, Qi, Panagiotaropoulou, Awasthi and Bigdeli11 bipolar disorder Reference O’Connell, Koromina, van der Veen, Boltz, David and Yang31 and MDD, Reference Adams, Streit, Meng, Awasthi, Adey and Choi32 and were computed using PRS-CS Reference Ge, Chen, Ni, Feng and Smoller33 for individuals of European ancestry and PRS-CSx-meta Reference Ruan, Lin, Feng, Chen, Lam and Guo34 for individuals of African ancestry. We ran a sensitivity analysis in African ancestry samples using whichever of the three PRS-CSx-derived PGS explained most variance in phenotypic severity in each cohort (Supplementary Table 2). All PGS were standardised using z-score transformations to facilitate interpretation across different cohorts. Ten principal components were calculated in each cohort using PLINK for macOS (v1.9 (beta) Command-line PLINK 1.9: Christopher Chang and Shaun Purcell, originally developed at the Purcell Lab, MGH/Harvard, Boston, Massachusetts, USA; https://www.cog-genomics.org/plink/1.9/), and all PGS were adjusted on ten principal components and gender. For further detail on polygenic scoring methods, please see Supplementary Methods.
Statistical analysis
The residualised PGS (i.e. corrected for ten PCs and gender) for cohorts that recruited samples within the same psychosis group ((a) psychotic experiences; (b) CHR; (c) FEP) were normalised to their respective controls, setting the mean PGS for controls to zero and the standard deviation to 1. This was done to ensure that controls were comparable across cohorts and were normalised for any sampling differences. As a sensitivity analysis we repeated the primary analysis using a global normalisation approach, pooling all controls across cohorts into a single reference group, to assess robustness to the choice of normalisation strategy.
To examine the association between individual PGS and phenotypic severity across the psychosis continuum, ordinal logistic regressions were fit. Non-proportional odds logistic regression was used to allow for flexible thresholds, because proportional allocation of the included levels is not assumed across the psychosis continuum phenotype and the proportional odds assumption was violated (Brant test; Supplementary Table 3). Pairwise differences in PGS among the four psychosis continuum groups were conducted using analysis of variance and post hoc Tukey’s honest significant difference (HSD) testing. A multivariable logistic regression model was fit to investigate the combined effect on the psychosis continuum phenotype of PGS for SCZ, bipolar disorder and MDD. To determine whether the observed effect was primarily driven by the two extreme categories (FEP and controls), we fit two additional models consecutively excluding one of the extremes (controls or FEP cases) from the model.
Reported p-values in all logistic regression analyses are unadjusted; however, statistical significance was evaluated against a Bonferroni-corrected threshold of p < 0.008 within each ancestry group, accounting for four primary tests: three univariable models (one per PGS), one combined multivariable model and two additional sensitivity analyses: multivariable models excluding extreme categories. All statistical analyses were conducted using R version 4.4.0 for macOS (R Foundation for Statistical Computing, Vienna, Austria; https://www.R-project.org/).
Results
Sample characteristics
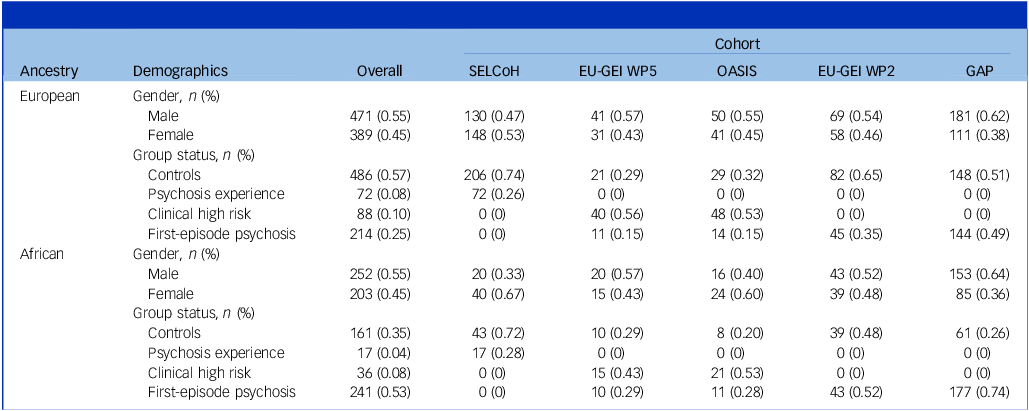
The sample consisted of 1315 participants, of whom 860 were of European ancestry and 455 of African ancestry; across the entire sample, 55% of participants were male (n = 723) and in individual ancestry groups (European, 471; African, 252). The sample included 647 controls, 89 participants who had endorsed having a psychotic experience, 124 CHR individuals who did not convert to FEP in the 2-year follow-up and 455 participants who had experienced a first episode of psychosis. The sample characteristics split into ancestry groups are outlined in Table 1. Following quality control and harmonisation, 729 974 SNPs were available from all cohorts in analyses of European ancestry samples, and 688 394 in samples of African ancestry (Supplementary Table 4).
Sample characteristics

Table 1 Long description
A table comparing demographic and group status data across different cohorts and ancestries. The table has 12 rows and 7 columns. Column headers are Ancestry, Demographics, Overall, SELCoH, EU-GEI WP5, OASIS, EU-GEI WP2, GAP. Row labels include European, African, Gender, Male, Female, Group status, Controls, Psychosis experience, Clinical high risk, First-episode psychosis. Row 1: Ancestry, Demographics. Row 2: European, Gender, n (%). Row 3: Male, 471 (0.55), 130 (0.47), 41 (0.57), 50 (0.55), 69 (0.54), 181 (0.62). Row 4: Female, 389 (0.45), 148 (0.53), 31 (0.43), 41 (0.45), 58 (0.46), 111 (0.38). Row 5: Group status, n (%). Row 6: Controls, 486 (0.57), 206 (0.74), 21 (0.29), 29 (0.32), 82 (0.65), 148 (0.51). Row 7: Psychosis experience, 72 (0.08), 72 (0.26), 0 (0), 0 (0), 0 (0), 0 (0). Row 8: Clinical high risk, 88 (0.10), 0 (0), 40 (0.56), 48 (0.53), 0 (0), 0 (0). Row 9: First-episode psychosis, 214 (0.25), 0 (0), 11 (0.15), 14 (0.15), 45 (0.35), 144 (0.49). Row 10: African, Gender, n (%). Row 11: Male, 252 (0.55), 20 (0.33), 20 (0.57), 16 (0.40), 43 (0.52), 153 (0.64). Row 12: Female, 203 (0.45), 40 (0.67), 15 (0.43), 24 (0.60), 39 (0.48), 85 (0.36). Row 13: Group status, n (%). Row 14: Controls, 161 (0.35), 43 (0.72), 10 (0.29), 8 (0.20), 39 (0.48), 61 (0.26). Row 15: Psychosis experience, 17 (0.04), 17 (0.28), 0 (0), 0 (0), 0 (0), 0 (0). Row 16: Clinical high risk, 36 (0.08), 0 (0), 15 (0.43), 21 (0.53), 0 (0), 0 (0). Row 17: First-episode psychosis, 241 (0.53), 0 (0), 10 (0.29), 11 (0.28), 43 (0.52), 177 (0.74).
SELCoH, South East London Community Health; EU-GEI WP5, European Network of National Schizophrenia Networks Studying Gene–Environment Interactions WP5; OASIS, Outreach and Support in South London; EU-GEI WP2, European Network of National Schizophrenia Networks Studying Gene–Environment Interactions WP2; GAP, Genetics and Psychosis study.
Univariable models
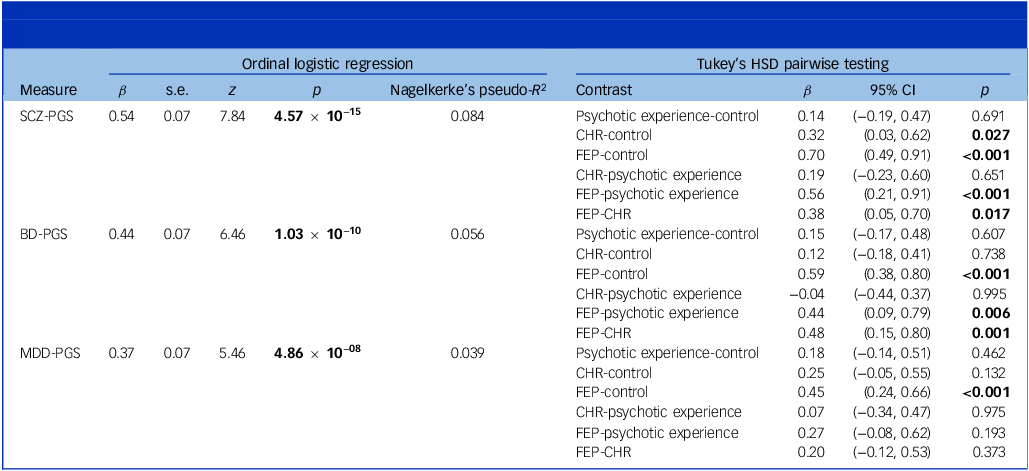
Ordinal logistic regression analyses examined associations between individual psychiatric PGS and groups across the psychosis continuum. Among individuals of European ancestry (Table 2), higher SCZ-PGS was most strongly associated with an increased odds of being in a ‘higher’ group across the psychosis continuum (odds ratio 1.72, 95% CI: 1.50–1.97, p = 4.57 × 10⁻¹⁵), followed by BD-PGS (odds ratio 1.56, 95% CI: 1.36–1.78, p = 1.03 × 10⁻¹⁰) and MDD-PGS (odds ratio 1.44, 95% CI: 1.27–1.65, p = 4.86 × 10⁻⁸). These associations are illustrated in Fig. 1. SCZ-PGS accounted for the largest variance explained in phenotypic severity across the psychosis continuum (Nagelkerke’s R 2 = 0.084, Akaike information criteria (AIC) = 1849.89), followed by BD-PGS (Nagelkerke’s R 2 = 0.056, AIC = 1872.28) and MDD-PGS (Nagelkerke’s R 2 = 0.039, AIC = 1885.66).
Distribution of polygenic scores (PGS) for schizophrenia (SCZ), bipolar disorder (BD) and major depressive disorder (MDD) across clinical stages of psychosis. Panels (a)–(c) show analyses in European ancestry individuals, panels (d)–(f) show analyses in African ancestry individuals; (a), (d), SCZ-PGS; (b), (e), BD-PGS; (c), (f), MDD-PGS. SCZ-PRS, polygenic score for schizophrenia; BD-PGS, polygenic score for bipolar disorder; MDD-PGS, polygenic score for major depressive disorder; CHR, clinical high risk; FEP, first-episode psychosis. *p < 0.05, **p < 0.01, ***p < 0.001.

Univariable ordinal logistic regression and ANOVA analyses of polygenic scores across the psychosis continuum in individuals of European ancestry

Table 2 Long description
A table with three rows and multiple columns comparing the associations between individual psychiatric polygenic scores (PGS) and groups across the psychosis continuum. The table includes columns for the measure, beta coefficient, standard error, z-score, p-value, and Nagelkerke’s pseudo-R-squared. It also includes results from Tukey’s HSD pairwise testing with contrasts, beta coefficients, 95% confidence intervals, and p-values. The measures include SCZ-PGS, BD-PGS, and MDD-PGS. Each row provides detailed statistical data for these measures.
ANOVA, analysis of variance; HSD, honestly significant difference; SCZ-PRS, polygenic score for schizophrenia; CHR, clinical high risk; FEP, first-episode psychosis; BD-PGS, polygenic score for bipolar disorder; MDD-PGS, polygenic score for major depressive disorder.
Bold p-values remain significant following correction for multiple testing (p < 0.008 in ordinal logistic regressions).
Furthermore, in Tukey’s HSD analysis among European samples (Table 2), the largest pairwise differences were in SCZ-PGS between FEP and controls (β = 0.70, p < 0.001), followed by those with FEP and individuals with psychotic experiences (β = 0.56, p < 0.001), individuals with FEP and those with CHR (β = 0.38, p = 0.017) and individuals at CHR and controls (β = 0.32, p = 0.027). Similarly, the largest pairwise difference in BD-PGS was between FEP and controls (β = 0.59, p < 0.001), followed by participants with FEP and CHR (β = 0.48, p = 0.001) and FEP participants and those with psychotic experiences (β = 0.44, p = 0.006). MDD-PGS differed only between FEP and control participants (β = 0.45, p < 0.001). We found no significant differences in any PGS between individuals with psychotic experiences and controls or individuals at CHR.
In participants of African ancestry (Supplementary Table 5), associations between PGS and groups across the psychosis continuum were substantially weaker than among European ancestry participants. Increases in SCZ-PGS (odds ratio 1.28, 95% CI: 1.07–1.55, p = 0.0085, Nagelkerke’s R 2 = 0.018, AIC = 936.20) and in BD-PGS (odds ratio 1.20, 95% CI: 1.00–1.44, p = 0.0499, Nagelkerke’s R 2 = 0.010, AIC = 939.36) were associated with an increase in level along the psychosis continuum, although narrowly missing statistical significance following correction for multiple testing. MDD-PGS was not significantly associated with the psychosis continuum phenotype (odds ratio 1.01, 95% CI: 0.86–1.19, p = 0.886, Nagelkerke’s R 2 < 0.001, AIC = 943.22). Tukey’s HSD pairwise comparisons revealed that only SCZ-PGS significantly differed between individuals with FEP and controls (β = 0.27, p = 0.037). Post hoc power analysis indicated 82.2% power to detect this univariable SCZ-PGS effect.
Multivariable models
A multivariable ordinal logistic regression was used to examine the effect of all three PGS simultaneously (Table 3). In European ancestry participants, increases in SCZ-PGS (odds ratio 1.48, 95% CI: 1.27–1.73, p = 4.03 × 10⁻⁷), BD-PGS (odds ratio 1.24, 95% CI: 1.06–1.44, p = 0.006) and MDD-PGS (odds ratio 1.21, 95% CI: 1.05–1.40, p = 0.0077) were each independently, but to varying extents, associated with the increased psychosis continuum group after adjusting for the effect of PGS for the other two disorders. Additionally, this combined model explained a greater proportion of variance (Nagelkerke’s R 2 = 0.105) and improved model fit (AIC = 1835.83) compared with any of the univariable models.
Multivariable ordinal logistic regression of combined polygenic scores (PGS) across the psychosis continuum

Table 3 Long description
A table with 2 rows and 7 columns comparing polygenic scores (PGS) for different disorders across European and African ancestries. The columns are Ancestry, PGS, Beta, Standard Error, Z-score, P-value, and Nagelkerke’s pseudo-R-squared. For European ancestry, SCZ-PGS has a Beta of 0.39, standard error of 0.08, Z-score of 5.07, P-value of 4.03 x 10^-7, and Nagelkerke’s pseudo-R-squared of 0.105. BD-PGS has a Beta of 0.21, standard error of 0.08, Z-score of 2.73, P-value of 0.006. MDD-PGS has a Beta of 0.19, standard error of 0.07, Z-score of 2.66, P-value of 0.008. For African ancestry, SCZ-PGS has a Beta of 0.23, standard error of 0.10, Z-score of 2.30, P-value of 0.022, and Nagelkerke’s pseudo-R-squared of 0.023. BD-PGS has a Beta of 0.14, standard error of 0.09, Z-score of 1.45, P-value of 0.148. MDD-PGS has a Beta of -0.03, standard error of 0.08, Z-score of -0.32, P-value of 0.747.
SCZ-PGS, polygenic score for schizophrenia; BD-PGS, polygenic score for bipolar disorder; MDD-PGS, polygenic score for major depressive disorder.
Bold p-values remain significant following correction for multiple testing (p < 0.008).
Among participants of African ancestry, the associations between PGS and groups across the psychosis continuum were again substantially weaker than among European ancestry participants. SCZ-PGS was moderately associated with groups across the psychosis continuum (odds ratio 1.25, 95% CI: 1.03–1.52, p = 0.022), although this association did not survive correction for multiple testing. The combined multivariable model showed greater explained variance (R 2 = 0.023), although this probably reflects the inclusion of multiple predictors because the overall model fit (AIC = 938.02) did not improve relative to the univariable SCZ-PGS model. Post hoc power analysis indicated 78.8% power to detect this multivariable SCZ-PGS effect.
Multivariable analysis excluding extreme groups: FEP or controls
Among individuals of European ancestry, SCZ-PGS remained associated with subclinical groups across the psychosis continuum following exclusion of FEP samples (odds ratio 1.24, 95% CI: 1.01–1.51, p = 0.039, Nagelkerke’s R 2 = 0.021), but did not survive Bonferroni correction (Supplementary Table 6). In a separate model excluding control participants (Nagelkerke’s R 2 = 0.080), only SCZ-PGS remained statistically significant following correction for multiple testing (odds ratio 1.37, 95% CI: 1.08–1.73, p = 0.0077). Among individuals of African ancestry, neither of the models – excluding FEP or controls – showed significant associations, although post hoc power analysis indicated substantially reduced power to detect effects among African ancestry participants (27.6 and 37.1% when excluding FEP or controls, respectively; Supplementary Note 1).
Sensitivity analyses
We conducted an exploratory sensitivity analysis among participants of African ancestry using the best-performing PGS for each cohort, defined as the PGS (derived from either the European or African ancestry GWAS, or from a meta-analysed approach) that explained the greatest variance in phenotypic severity across the psychosis continuum (Supplementary Tables 7 and 8). This revealed an increased effect of SCZ-PGS (odds ratio 1.34, 95% CI = 1.12–1.62 p = 0.002, Nagelkerke’s R 2 = 0.026, AIC = 933.00) and BD-PGS (odds ratio 1.28, 95% CI = 1.07–1.53, p = 0.0076, Nagelkerke’s R 2 = 0.018, AIC = 935.98) individually on the psychosis continuum, which remained robust at the Bonferroni threshold for multiple testing correction. In multivariable analysis, SCZ-PGS had an increased effect size and variance explained on the psychosis continuum phenotype (odds ratio 1.29, 95% CI = 1.07–1.57, p = 0.009, Nagelkerke’s R 2 = 0.040) compared with the primary approach using PRScs-x meta. Additionally, model fit (AIC = 930.93) improved over univariable and multivariable models using PRScs-x meta in the main analysis. BD-PGS and MDD-PGS were not significantly associated with the psychosis continuum phenotype in multivariable analyses. Sensitivity analysis using a global normalisation approach showed a similar stepwise increase in PGS with increasing phenotypic severity in European ancestry individuals (Supplementary Tables 9 and 10).
Discussion
In this study we mapped polygenic liability for SCZ, bipolar disorder and MDD across four groups along the psychosis continuum, including psychotic experiences among the general population, individuals at clinical high risk who did not develop psychosis and FEP samples. Our findings show that, among individuals of European ancestry, increasing PGS for all three psychiatric disorders were associated with an increase in phenotypic severity across the continuum, in line with previous findings. Reference Smigielski, Papiol, Theodoridou, Heekeren, Gerstenberg and Wotruba14,Reference Legge, Jones, Kendall, Pardiñas, Menzies and Bracher-Smith16 This provides evidence for a degree of shared genetic architecture between subclinical psychotic symptoms and psychotic disorder, supporting the psychosis continuum framework. Reference Perkins, Olde Loohuis, Barbee, Ford, Jeffries and Addington13,Reference Smigielski, Papiol, Theodoridou, Heekeren, Gerstenberg and Wotruba14,Reference Legge, Jones, Kendall, Pardiñas, Menzies and Bracher-Smith16,Reference Bigdeli, Bacanu, Webb, Walsh, O’Neill and Fanous20 Notably, this is the first study to show that SCZ-PGS in CHR individuals who did not develop psychosis was intermediate between controls and FEP, suggests that CHR represent a distinguishable group along the continuum with intermediate genetic vulnerability. This pattern was not replicated in African ancestry participants, probably due to limited power. SCZ-PGS explained the largest variance in phenotypic severity of the three PGS analysed, across both ancestries.
Our findings reveal a stepwise relationship between the genetic liability for SCZ and increasing phenotypic severity along the psychosis continuum, aligning with prior research Reference Perkins, Olde Loohuis, Barbee, Ford, Jeffries and Addington13,Reference Smigielski, Papiol, Theodoridou, Heekeren, Gerstenberg and Wotruba14,Reference Legge, Jones, Kendall, Pardiñas, Menzies and Bracher-Smith16,Reference Bigdeli, Bacanu, Webb, Walsh, O’Neill and Fanous20 and providing support for the psychosis continuum framework. Whereas all PGS analysed significantly predicted the psychosis continuum phenotype in European ancestry populations, only SCZ-PGS remained significant in analyses where the extreme groups – FEP or controls – were iteratively excluded. Although this association did not withstand correction for multiple testing when the FEP group was excluded, the results indicate that genetic liability for schizophrenia is associated with the full psychosis continuum investigated in this study and is not driven solely by differences between controls and FEP cases. Notably, SCZ-PGS exhibited the largest effect sizes and variance explained across the psychosis continuum in both ancestry populations, suggesting that the psychosis continuum analysed in this study is mostly associated with genetic liability to SCZ, compared with bipolar disorder or MDD.
Previous research has identified differences in genetic risk between individuals at CHR for psychosis and those with FEP, Reference Perkins, Olde Loohuis, Barbee, Ford, Jeffries and Addington13 or controls. Reference Smigielski, Papiol, Theodoridou, Heekeren, Gerstenberg and Wotruba14 This study is the first to show that SCZ-PGS in CHR individuals who did not develop a psychotic disorder differ significantly from both groups, highlighting a previously unidentified pattern of genetic risk in non-transitioning CHR individuals. This suggests that individuals at CHR represent a distinguishable, intermediate phenotype along the psychosis continuum, underscoring a genetic vulnerability inherent in this group – even in the absence of transition to FEP. Given that only 20–35% of individuals identified as CHR progress to FEP, Reference Salazar de Pablo, Radua, Pereira, Bonoldi, Arienti and Besana35 improved clinical prediction models are needed. Although effect sizes in this study were modest, they indicate potential for PGS to inform such models, provided that predictive performance improves and PGS are integrated within multifactorial models alongside clinical, environmental and neurocognitive predictors. Recent evidence suggests that the predictive value of PGS may vary depending on environmental context: for instance, polygenic risk for schizophrenia shows larger effects in individuals unexposed to strong environmental risk factors than in those exposed to them. Reference Rodriguez, Alameda, Aas, Gayer-Anderson, Trotta and Spinazzola36
By contrast, we found no significant differences in the genetic liability for bipolar disorder or MDD in psychosis groups below the diagnostic FEP threshold. Although MDD-PGS differences did not reach statistical significance, the linear pattern closely mirrored that observed for SCZ-PGS, suggesting a potentially similar but weaker effect, probably due to the lower predictive power of MDD compared with SCZ-PGS. Our results did not confirm previous findings that showed significant difference in BD-PGS between individuals at CHR compared with controls but no difference between CHR and established psychotic disorder. Reference Smigielski, Papiol, Theodoridou, Heekeren, Gerstenberg and Wotruba14 However, Smigielski et al did not adjust the CHR group according to transition to FEP, resulting in a more heterogenous CHR group – as seen clinically – including participants that would later convert to FEP, potentially inflating effect sizes. Further research is needed to understand the effect of PGS for bipolar disorder across the early psychosis continuum.
Multivariable models, combining PGS for all three disorders, consistently outperformed univariable models, indicating that the former more effectively capture the genetic architecture underlying the psychosis continuum. Similarly, prior research has shown improved predictive ability in multi-PGS models, Reference Neumann, Jolicoeur‐Martineau, Szekely, Sallis, O’Donnel and Greenwood37,Reference Albiñana, Zhu, Schork, Ingason, Aschard and Brikell38 suggesting pleiotropy, where genetic variants influence multiple disorders simultaneously. Additionally, improved performance may reflect the models’ enhanced capability in capturing heterogeneity within the psychosis phenotype, because individuals may carry different genetic risk combinations manifesting as varying symptom presentations. This is further supported by shared subthreshold affective, psychotic and functional features across psychotic and bipolar high-risk states, enabling joint prediction. Reference Arribas, de Micheli, Krakowski, Stahl, Correll and Young39 Our findings support transdiagnostic, dimensional rather than categorical models of psychiatric disorders, consistent with clinical observations that all three disorders can present with psychotic symptoms.
We were not able to replicate previous findings of elevated SCZ-PGS, Reference Ronald and Pain15,Reference Legge, Jones, Kendall, Pardiñas, Menzies and Bracher-Smith16,Reference Pain, Dudbridge, Cardno, Freeman, Lu and Lundstrom19,Reference Jones, Stergiakouli, Tansey, Hubbard, Heron and Cannon40,Reference Taylor, Martin, Lu, Brikell, Lundström and Larsson41 BD-PGS Reference Smigielski, Papiol, Theodoridou, Heekeren, Gerstenberg and Wotruba14,Reference Legge, Jones, Kendall, Pardiñas, Menzies and Bracher-Smith16 or MDD-PGS Reference Legge, Jones, Kendall, Pardiñas, Menzies and Bracher-Smith16,Reference Pain, Dudbridge, Cardno, Freeman, Lu and Lundstrom19 in general population samples reporting psychotic experiences. Rather, the current findings support further recent research in the field reporting non-significant findings. Reference Mas-Bermejo, Papiol, Via, Rovira, Torrecilla and Kwapil17,Reference Meller, Schmitt, Stein, Brosch and Mosebach18 However, two methodological factors must be taken into consideration: first, psychotic experiences in the general population were assessed in only one cohort (SELCoH). Given that psychotic experiences are common, ranging between 5 and 15% in the general population, Reference van Os and Linscott1 control groups in other cohorts may have been heterogeneous, potentially including misclassified individuals with unreported psychotic experiences that could attenuate group differences. Second, the specificity of our assessment measure may have been insufficient, because psychotic experiences were defined as endorsement of one or more PSQ items, potentially creating a heterogeneous group where different psychotic experiences may be associated with genetic liability for different disorders. This interpretation is supported by prior research showing that MDD-PGS is associated with only specific psychotic experience subscales (cognitive disorganisation and paranoia) rather than with psychotic experiences broadly. Reference Maxwell, Ronald, Cardno, Breen, Rimfeld and Vassos42 Combined with limited statistical power, these factors may have contributed to the masking of true effects.
Limitations
Although we were able to harmonise five cohorts ascertained through clinical examination within south-east London with a total sample size of 1320, some groups across the psychosis continuum were small and thus lacking statistical power to detect small effects. This is particularly true for the psychotic experiences group, which was assessed in only one cohort (SELCoH). The use of a low threshold for group membership (endorsing one or more items) may have introduced phenotypic heterogeneity, although the lack of psychotic experience assessment in the other control groups may have attenuated the observed differences in PGS. Moreover, PSQ captures psychotic experiences occurring only in the past year across five symptom domains, meaning that it cannot capture lifetime history or experiences falling outside these domains. In addition, some individuals in the psychotic experiences and CHR groups may have developed psychosis beyond the available follow-up period. Differences in recruitment and phenotypic assessment across cohorts may also confound between-group comparisons. Furthermore, gender was treated as a covariate rather than examined as a potential effect-modifier. Future research would benefit from using a dimensional phenotype within a single cohort spanning the full continuum.
In samples of African ancestry, the association between SCZ-PGS and the psychosis continuum did not survive correction for multiple testing, probably reflecting the limited power, especially in within-continuum comparisons (27.6 and 37.1% when excluding FEP or controls, respectively), due to lower predictive accuracy of GWAS discovery data-sets for non-European populations. In an exploratory sensitivity analysis in which we used the best-performing PGS (Supplementary Tables 7 and 8) for each cohort, rather than using PRS-CSx-meta for all cohorts, SCZ-PGS was found to be statistically significant following Bonferroni correction in participants of African ancestry in both univariable and multivariable models. Although this should be interpreted with caution given limited between-cohort comparability, it suggests that power limitations in the discovery data-set and cross-ancestry PGS methods may underlie the reduced predictive ability of PGS in African ancestry samples. This underscores the need for more inclusive GWAS to ensure equitable representation and improved cross-ancestry applicability of PGS, especially in the context of clinical utility. Reference Fatumo, Chikowore, Choudhury, Ayub, Martin and Kuchenbaecker43–Reference Peterson, Kuchenbaecker, Walters, Chen, Popejoy and Periyasamy45 Lastly, we were able to compute PGS for only two ancestry groups because the sample sizes of other ancestry groups were too small to provide meaningful results, further highlighting the importance of validating the current findings in larger, more diverse data-sets.
The findings of the current study provide partial biological support for the psychosis continuum model, demonstrating an incremental increase in the genetic liability for SCZ with an increase in phenotypic severity across the psychosis continuum. Importantly, this study shows that individuals at CHR, who do not transition to psychotic disorder, represent an intermediate phenotype along the psychosis continuum, with significantly higher SCZ-PGS than controls but significantly lower SCZ-PGS than those with FEP. It is possible that these individuals with higher genetic liability are more vulnerable to the effect of environmental risk factors such as stressful life events or cannabis use, which is relevant to clinical decision-making and psychoeducation. Although these results advance understanding of the genetic architecture underlying psychosis, both current PGS effect sizes and GWAS sample diversity are not yet sufficient for equitable individual-level clinical prediction. However, as PGS methodology and GWAS discovery samples continue to improve, these findings highlight the potential for polygenic liability to contribute to composite risk models integrating clinical, environmental and polygenic markers.
Supplementary material
The supplementary material is available online at https://doi.org/10.1192/bjp.2026.10795
Data availability
The data that support the findings of this study are available on request from the corresponding author, E.V. Individual-level participant data are not publicly available due to restrictions imposed by the participants’ informed consent, which aimed to protect participant privacy. Analysis codes for this study are available on request from the first author, S.M.H.
Acknowledgements
We thank all participants in the study and all researchers in the GAP, OASIS, SELCoH and EU-GEI teams that contributed to the collection, curation and analysis of these data-sets. We also thank Professor Michael O’Donovan for his thoughtful comments on the manuscript. Generative artificial intelligence (Claude, Anthropic) was used only to improve the readability and language of the text; after using this tool, the authors reviewed and edited the content as needed and take full responsibility for the content of the publication. All conceptual work, analysis and interpretation were conducted solely by the authors.
Author contributions
Conception and design of the study: S.M.H., E.V. Data acquisition: D.P., M.J.K., V.B., L.R.V., S.T., G.M., P.F.-P., D.Q., J.v.O., B.R., G.B., M.D.F., C.M., M.H., P.M., R.M.M., E.V. Analysis: S.M.H., R.A., J.R.I.C., C.M.L., E.V. Interpretation of findings: led by S.M.H., R.M.M., E.V. Drafting of manuscript: led by S.M.H. Review of drafts and final approval: all authors.
Funding
This paper represents independent research part-funded by the National Institute for Health and Care Research (NIHR) Biomedical Research Centre at South London and Maudsley National Health Service (NHS) Foundation Trust and King’s College London. The views expressed are those of the authors and not necessarily those of the NHS, NIHR or the Department of Health and Social Care. D.P. was sponsored by an NIHR Postdoctoral Fellowship (no. PDF-2010-03-047) for this work. The EU-GEI Project is funded by grant agreement no. HEALTH-F2-2010-241909 (Project EU-GEI) from the European Community’s Seventh Framework Programme. Additional support was provided by a Medical Research Council Fellowship to M.J.K. (grant no. MR/J008915/1) and the European Union’s Horizon Europe programme (YOUTH-GEMs, grant agreement no. 101057182).
Declaration of interest
P.M. is a member of the BJPsych editorial board, but did not take part in the review or decision-making process of this paper. The remaining authors have nothing to disclose.




 Open access


eLetters
No eLetters have been published for this article.