Introduction
Major depressive disorder (MDD) is a highly prevalent multifactorial psychiatric disorder characterized by a heterogeneous symptom profile including persistent negative feelings of sadness or irritability or the absence of feelings of pleasure and psychophysiological changes (e.g. sleep, appetite, concentration). Recently, MDD has been characterized as a disorder of an abnormal tendency to engage in negative mood states, together with a difficulty in disengaging from negative mood states (Holtzheimer & Mayberg, Reference Holtzheimer and Mayberg2011). This defines depression as a self-regulatory disorder, and brain regions important for emotion and attentional regulation may play a role in its pathophysiology. Regional abnormalities have consistently been implicated in the neuropathology of MDD, including decreased glutamatergic metabolism (Yuksel & Ongur, Reference Yuksel and Ongur2010) and local morphometric abnormalities, including lower volume of the anterior cingulate cortex (ACC) and orbitofrontal cortex (OFC) (Koolschijn et al. Reference Koolschijn, van Haren, Lensvelt-Mulders, Hulshoff Pol and Kahn2009; van Tol et al. Reference van Tol, van der Wee, van den Heuvel, Nielen, Demenescu, Aleman, Renken, van Buchem, Zitman and Veltman2010; Bora et al. Reference Bora, Harrison, Davey, Yucel and Pantelis2012) and lower cortical thickness in the superior temporal cortex, OFC and insula (Jarnum et al. Reference Jarnum, Eskildsen, Steffensen, Lundbye-Christensen, Simonsen, Thomsen, Frund, Theberge and Larsson2011). The ACC, OFC and insula are key regions in primary emotion perception and regulation (Mayberg, Reference Mayberg1997; Phillips et al. Reference Phillips, Drevets, Rauch and Lane2003; Ochsner et al. Reference Ochsner, Silvers and Buhle2012) and structural abnormalities may influence the integrity of networks strongly connected to these regions. Transient local tissue abnormalities have already been shown to influence the network properties of the brain (Pfleiderer et al. Reference Pfleiderer, Michael, Erfurth, Ohrmann, Hohmann, Wolgast, Fiebich, Arolt and Heindel2003; Horn et al. Reference Horn, Yu, Steiner, Buchmann, Kaufmann, Osoba, Eckert, Zierhut, Schiltz, He, Biswal, Bogerts and Walter2010; Grimm et al. Reference Grimm, Luborzewski, Schubert, Merkl, Kronenberg, Colla, Heuser and Bajbouj2012) and recent work indicates that that abnormal resting-state functional connectivity (RSFC) originates from regions with lower absolute grey matter density in MDD patients (Ma et al. Reference Ma, Ding, Li, Guo, Long, Liu, Gao, Zeng, Zhao and Chen2012). Persistent tissue abnormalities may represent an important distinct pathophysiological entity that relates to individual vulnerability for depressive episodes. However, to what extent local morphometric abnormalities directly relate to the degree of intrinsic functional organization of the brain in MDD and therefore may serve as a marker of functional disintegration is, to our knowledge, unknown.
Structural abnormalities in the ACC and insula may contribute to functional abnormalities in a fronto-opercular network frequently associated with salience processing (Seeley et al. Reference Seeley, Menon, Schatzberg, Keller, Glover, Kenna, Reiss and Greicius2007). Indeed, this network has repeatedly been found to be abnormal in depression in both seed-based and independent component analysis (ICA) studies (Cullen et al. Reference Cullen, Gee, Klimes-Dougan, Gabbay, Hulvershorn, Mueller, Camchong, Bell, Houri, Kumra, Lim, Castellanos and Milham2009; Sheline et al. Reference Sheline, Price, Yan and Mintun2010; Veer et al. Reference Veer, Beckmann, van Tol, Ferrarini, Milles, Veltman, Aleman, van Buchem, van der Wee and Rombouts2010). Furthermore, researchers have frequently studied a so-called default mode network (DMN) consisting of the pregenual ACC/medial prefrontal cortex (PFC) and lateral and medial precuneus/posterior cingulate cortex, which has been related to rumination, autobiographical memory, self-referential processing, emotion processing and future-oriented thought (Raichle et al. Reference Raichle, MacLeod, Snyder, Powers, Gusnard and Shulman2001; Buckner et al. Reference Buckner, Andrews-Hanna and Schacter2008; Andrews-Hanna et al. Reference Andrews-Hanna, Reidler, Sepulcre, Poulin and Buckner2010; Whitfield-Gabrieli & Ford, Reference Whitfield-Gabrieli and Ford2012; Zhu et al. Reference Zhu, Wang, Xiao, Liao, Zhong, Wang and Yao2012). In MDD, increased (Greicius et al. Reference Greicius, Flores, Menon, Glover, Solvason, Kenna, Reiss and Schatzberg2007; Sheline et al. Reference Sheline, Price, Yan and Mintun2010) and normal connectivity within the DMN (Veer et al. Reference Veer, Beckmann, van Tol, Ferrarini, Milles, Veltman, Aleman, van Buchem, van der Wee and Rombouts2010), as well as abnormal connectivity of DMN regions with regions outside the DMN (Bluhm et al. Reference Bluhm, Williamson, Lanius, Theberge, Densmore, Bartha, Neufeld and Osuch2009; Horn et al. Reference Horn, Yu, Steiner, Buchmann, Kaufmann, Osoba, Eckert, Zierhut, Schiltz, He, Biswal, Bogerts and Walter2010), have been reported. A recent ICA study showed increased connectivity in anterior components and decreased connectivity in the posterior component (Zhu et al. Reference Zhu, Wang, Xiao, Liao, Zhong, Wang and Yao2012), emphasizing the importance of subnetworks that may make up the DMN (Andrews-Hanna et al. Reference Andrews-Hanna, Reidler, Sepulcre, Poulin and Buckner2010). Finally, the connectivity of limbic–striatal regions important for primary emotion processing and labelling of significance of incoming information has been studied and found to be abnormal in MDD (Anand et al. Reference Anand, Li, Wang, Wu, Gao, Bukhari, Mathews, Kalnin and Lowe2005, Reference Anand, Li, Wang, Lowe and Dzemidzic2009; Lui et al. Reference Lui, Wu, Qiu, Yang, Kuang, Chan, Huang, Kemp, Mechelli and Gong2011). However, the extent to which structural abnormalities of regions that constitute these networks contribute to functional integration abnormalities has gone largely unstudied.
So far, network abnormalities have been linked to illness length (Greicius et al. Reference Greicius, Flores, Menon, Glover, Solvason, Kenna, Reiss and Schatzberg2007) and illness severity (Horn et al. Reference Horn, Yu, Steiner, Buchmann, Kaufmann, Osoba, Eckert, Zierhut, Schiltz, He, Biswal, Bogerts and Walter2010; Sheline et al. Reference Sheline, Price, Yan and Mintun2010), although not consistently (Greicius et al. Reference Greicius, Flores, Menon, Glover, Solvason, Kenna, Reiss and Schatzberg2007; Bluhm et al. Reference Bluhm, Williamson, Lanius, Theberge, Densmore, Bartha, Neufeld and Osuch2009; Cullen et al. Reference Cullen, Gee, Klimes-Dougan, Gabbay, Hulvershorn, Mueller, Camchong, Bell, Houri, Kumra, Lim, Castellanos and Milham2009; Veer et al. Reference Veer, Beckmann, van Tol, Ferrarini, Milles, Veltman, Aleman, van Buchem, van der Wee and Rombouts2010). Structural abnormalities have frequently been associated with the course of the disorder (Frodl et al. Reference Frodl, Meisenzahl, Zetzsche, Hohne, Banac, Schorr, Jager, Leinsinger, Bottlender, Reiser and Moller2004, Reference Frodl, Jäger, Born, Ritter, Kraft, Zetzsche, Bottlender, Leinsinger, Reiser, Müller and Meisenzahl2008; McKinnon et al. Reference McKinnon, Yucel, Nazarov and MacQueen2009; Jarnum et al. Reference Jarnum, Eskildsen, Steffensen, Lundbye-Christensen, Simonsen, Thomsen, Frund, Theberge and Larsson2011) but not consistently with illness severity (Koolschijn et al. Reference Koolschijn, van Haren, Lensvelt-Mulders, Hulshoff Pol and Kahn2009). Therefore structural abnormalities may be a better predictor for network dysregulation than illness severity (Jarnum et al. Reference Jarnum, Eskildsen, Steffensen, Lundbye-Christensen, Simonsen, Thomsen, Frund, Theberge and Larsson2011). Studying the relationship between local tissue abnormalities and interregional network properties may be of vital importance to understand the relationship between local abnormalities and the course of MDD on the one hand, and network abnormalities and the course of MDD on the other hand. Considering the advances made regarding the nature of structure–function relationships in the ‘resting’ brain over the last few years (Greicius et al. Reference Greicius, Supekar, Menon and Dougherty2009; Honey et al. Reference Honey, Sporns, Cammoun, Gigandet, Thiran, Meuli and Hagmann2009), the combination of modalities can enrich our understanding of functional organization in psychiatric disorders. Of note, anatomical and functional resting-state data may provide a technically and clinically feasible combination with a considerably high added value, because of their passive, standardized nature in part independent of concurrent cognitive state.
In the present study, we investigated cortical thickness in MDD in-patients and compared thickness maps with those of healthy controls (HC). We investigated whether variations in cortical thickness could predict the RSFC from these seeds. We additionally investigated if the relationship between morphometry and connectivity was affected by local functional abnormalities as measured by the amplitude of the low-frequency fluctuations. We hypothesized lower cortical thickness in patients in medial frontal and medial parietal cortical regions, including the ACC (Koolschijn et al. Reference Koolschijn, van Haren, Lensvelt-Mulders, Hulshoff Pol and Kahn2009; van Tol et al. Reference van Tol, van der Wee, van den Heuvel, Nielen, Demenescu, Aleman, Renken, van Buchem, Zitman and Veltman2010; Arnone et al. Reference Arnone, McIntosh, Ebmeier, Munafo and Anderson2012), PCC (van Tol et al. Reference van Tol, van der Wee, van den Heuvel, Nielen, Demenescu, Aleman, Renken, van Buchem, Zitman and Veltman2010) and OFC (Koolschijn et al. Reference Koolschijn, van Haren, Lensvelt-Mulders, Hulshoff Pol and Kahn2009). We further hypothesized that lower thickness in these regions relates to lower connectivity within networks implicating these regions (i.e. the salience network and DMN) and predicts connectivity strength in a dose-dependent manner (i.e. RSFC depends on the degree of cortical thinning).
Method
Ethics statement
The study was carried out in accordance with the Declaration of Helsinki. The study was approved by the institutional review board of the University of Magdeburg. All participants provided written informed consent after a complete description of the study.
Participants
Data of 20 Caucasian, German, MDD in-patients with an acute major depressive episode, diagnosed according to the International Classification of Diseases (ICD)-10 criteria (World Health Organization, 1992) by an experienced psychiatrist (M.W.), were recruited to this study. Exclusion criteria were major medical illness, history of seizures as well as general magnetic resonance imaging (MRI) contraindications. Specific psychiatric exclusion criteria included atypical forms of depression, a diagnosis of bipolar disorder, or current alcohol use disorder. Severity of depression was rated using the Hamilton Depression Rating Scale (HAMD; Hamilton, Reference Hamilton1960). Except for one, all patients were medicated using a selective serotonin reuptake inhibitor [citalopram (n = 4), paroxetine (n = 1), fluoxetine (n = 1), sertraline (n = 1), venlafaxine (n = 6)], tricyclic antidepressant [mirtazapine (n = 11)], selective noradrenaline/serotonin reuptake inhibitor [duloxetine (n = 1)], melatonergic antidepressant [agomelatine (n = 1)] or mood stabilizers [including quetiapine (n = 2), chlorprothixen (n = 1), lorazepam (n = 1), valproic acid (n = 1)]. An overview of medication use and combinations can be found in online Supplementary Table S1.
A total of 20 age-matched Caucasian, German HC without any psychiatric, neurological or medical illness were recruited to this study. All volunteers completed the Mini-International Neuropsychiatric Interview (Sheehan et al. Reference Sheehan, Lecrubier, Sheehan, Amorim, Janavs, Weiller, Hergueta, Baker and Dunbar1998) to specifically ensure the absence of any ICD-10 psychiatric disorders.
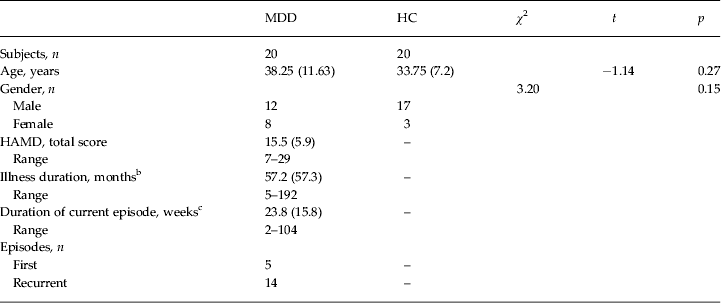
For the planned subsequent RSFC analyses, data of only 19 patients and 19 HC were available (see Table 1 for clinical characteristics).
Clinical characteristics a

MDD, Major depressive disorder; HC, healthy controls; HAMD, Hamilton Depression Rating Scale score; s.d., standard deviation.
Data are given as mean (s.d.).
a For the resting-state functional connectivity analyses, only 19 patients (mean age: 37.9, s.d.=11.8 years; 11 males; mean HAMD: 15.5, s.d. = 5.9) and 19 HC (mean age: 34.3, s.d. = 6.9 years; 16 males) were included.
b Reliable information on illness duration was available for 16 patients.
c Reliable information on duration of the current episode was available for 15 patients.
Image acquisition
High-resolution T1-weighted MRI scans of the brain were acquired on a 3-T Siemens MAGNETOM Trio (Siemens, USA) scanner using a three-dimensional magnetization-prepared rapid gradient echo (MPRAGE) sequence (echo time = 4.77 ms, repetition time = 2500 ms, T1 = 1100 ms, flip angle = 7°, bandwidth = 140 Hz/pixel, acquisition matrix = 256 × 256 × 192, isometric voxel size = 1.0 mm3).
For resting-state functional MRI data, functional time series of 488 time points were acquired with an echo-planar imaging sequence. The following acquisition parameters were used: repetition time = 1250 ms, echo time = 25 ms, flip angle = 70°, field of view = 22 cm, acquisition matrix = 44 × 44, isometric voxel size = 5 × 5 × 5 mm3. A total of 26 axial slices without slice gap were acquired interleaved-ascending covering the entire brain.
Data analysis
Cortical thickness
To build a cortical surface model and measure cortical thickness of the whole brain, all MR images were processed with the CIVET pipeline (Zijdenbos et al. Reference Zijdenbos, Forghani and Evans2002; Ad-Dab'bagh et al. Reference Ad-Dab'bagh, Einarson, Lyttelton, Muehlboeck, Mok, Ivanov, Vincent, Lepage, Lerch, Fombonne and Evans2006) developed at the Montreal Neurological Institute (MNI). A description of standard CIVET processing, including surface-based smoothing with a 20-mm full-width at half-maximum (FWHM) kernel (Chung et al. Reference Chung, Worsley, Robbins, Paus, Taylor, Giedd, Rapoport and Evans2003), can be found in the online Supplementary material.
Functional connectivity
Functional MRI data were analysed using SPM8 (www.fil.ion.ucl.ac.uk/spm) and the DPARSF (Chao-Gan & Yu-Feng, Reference Chao-Gan and Yu-Feng2010) toolbox (http://www.restfmri.net/forum/DPARSF). A detailed description of preprocessing steps can be found in the online Supplementary material, but included slice-time correction, realignment, scrubbing of volume and time-adjacent volume with frame-wise displacement > 0.5 mm (Power et al. Reference Power, Barnes, Snyder, Schlaggar and Petersen2012), normalization to MNI space, and smoothing with a Gaussian kernel of 10 mm FWHM. Detailed movement information is given in online Supplementary Table S2. Next, the blood oxygenation level-dependent (BOLD) signal was band-pass filtered (0.01–0.08 Hz). Extracted time series of each seed region of interest (ROI) (see below) were entered in separate whole-brain general linear models and included nuisance variables to account for non-neural fluctuations, i.e. motion parameters, average white matter and ventricular signal. As no respiratory and heart-rate variability data were available and because such non-neuronal noise components may introduce false coherences and cause over-estimation of RSFC strength (Weissenbacher et al. Reference Weissenbacher, Kasess, Gerstl, Lanzenberger, Moser and Windischberger2009), we chose to remove non-neural physiological noise by including the global mean as an additional nuisance regressor.
Fractional amplitude of low-frequency fluctuations (fALFF)
A specific measurement of low-frequency oscillatory phenomena, fALFF, was obtained to investigate local functional abnormalities. fALFF is defined as the total power within the low-frequency range (0.01–0.1 Hz) divided by the total power in the entire detectable frequency range, and is thought to reflect the intensity of regional spontaneous brain activity (Song et al. Reference Song, Dong, Long, Li, Zuo, Zhu, He, Yan and Zang2011). The fALFF were calculated based on the spatially smoothed functional data. As scrubbing disrupts the temporal structure of the data and precludes frequency-based analyses, fALFF was calculated on the unscrubbed data.
Statistical analysis
Group characteristics were analysed using SPSS version 19.0 (IBM, USA). Statistical analyses of cortical thickness maps and functional connectivity maps were conducted using the SurfStat toolbox (http://www.math.mcgill.ca/keith/surfstat/) and SPM8, respectively.
Group analysis of cortical thickness
We assessed the group differences of cortical thickness between MDD patients and HC using two-sample t tests. We controlled the type I error related to vertex-wise comparisons using the false discovery rate correction method. Statistical maps were thresholded at p < 0.05 (corrected) with a spatial-extent threshold of five contiguous vertices.
ROI definition for RSFC analysis
Regions showing significant differences in cortical thickness between groups were identified and labelled on the cortical surface, subsequently transformed to binary ROIs and served as ROIs for our primary seed-based RSFC analysis. This approach is consistent with Ma et al. (Reference Ma, Ding, Li, Guo, Long, Liu, Gao, Zeng, Zhao and Chen2012) and was chosen because of our explicit interest in the local contribution of thickness abnormalities on functional connectivity originating from these morphometric abnormal regions.
Statistical models
An ANCOVA was set up with RSFC maps seeded from our cortical thickness-defined ROIs between HC and patients as the dependent variables, and mean cortical thickness of each ROI per subject added to the model, demeaned within group.
A two-sample t test was conducted to compare the difference of fALFF maps between patients and HC.
Thresholding
For all functional analyses (both RSFC and fALFF), the resulting statistical maps were corrected for family-wise error (FWE) rate on the cluster level using Monte Carlo simulation implemented in the AFNI AlphaSim program (Cox & Hyde, Reference Cox and Hyde1997) (settings: correction level p < 0.05 FWE-corrected, initial voxel-wise threshold p = 0.001, cluster connection radius = 5 mm, whole brain mask). As this correction depends on the smoothness of the residuals in the model, the appropriate cluster size was calculated in each model separately. The critical k-value (minimal cluster size needed to control for FWE) is reported for each model in the Results section (Table 3).
Results
Group difference in cortical thickness
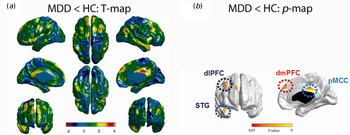
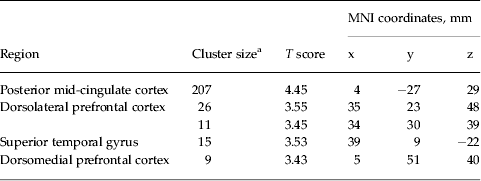
Compared with HC, patients showed significantly lower cortical thickness in the dorsolateral PFC (dlPFC), the dorsomedial PFC (dmPFC), rostral superior temporal gyrus (STG) and the posterior mid-cingulate cortex (pMCC) (see Table 2 and Fig. 1). No regions showing higher cortical thickness were observed in the patient group compared with HC. We exported mean thickness of the significant regions to SPSS to test for effects of clinical characteristics. However, no relationships of regional thickness and HAMD scores or illness duration were observed in patients (r < 0.28, p > 0.12).
Cortical thickness affects major depressive disorder (MDD) patients less than healthy controls (HC). Group comparison of cortical thickness in healthy subjects and patients with MDD: (a) cortical thickness maps displaying T-values of the comparison MDD patients < healthy controls; (b) cortical thickness maps displaying group differences in regions that show lower thickness in patients than in controls at p < 0.05, false-discovery rate-corrected. For display purposes, effects are depicted at an uncorrected level of T > 3.32. dlPFC, Dorsolateral prefrontal cortex; STG, superior temporal gyrus; dmPFC, dorsomedial prefrontal cortex; pMCC, posterior mid-cingulate cortex.

Regions with lower cortical thickness in MDD patients versus healthy controls

MDD, Major depressive disorder; MNI, Montreal Neurological Institute.
a Significant level, p < 0.05, false discovery rate-corrected.
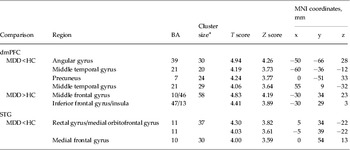
Abnormal dmPFC and STG seeded connectivity in MDD patients versus HC

dmPFC, Dorsomedial prefrontal cortex; STG, superior temporal gyrus; MDD, major depressive disorder; HC, healthy controls; BA, Brodmann area; MNI, Montreal Neurological Institute; FWE, family-wise error.
a For dmPFC, critical number of clusters to hold p < 0.05 FWE-corrected: k = 19. For STG, critical number of clusters to hold p < 0.05 FWE-corrected: k = 16.
Functional connectivity of regions with abnormal cortical thickness
Main connectivity maps of the cortical thickness-defined seeds over all participants are displayed in online Supplementary Fig. S1 and showed a DMN-like structure for the dmPFC seed, while the rostral STG was embedded in a functional network encompassing orbitofrontal regions, the bilateral amygdala, temporal lobes and ventromedial PFC regions. The dlPFC seed occurred within an attentional network, and the pMCC in a network including the dorsal ACC and lateral precuneus, showing large overlap with the dlPFC-seeded network. Both dlPFC and pMCC networks showed overlap with a DMN-like network.
Functional connectivity differences between MDD patients and HC
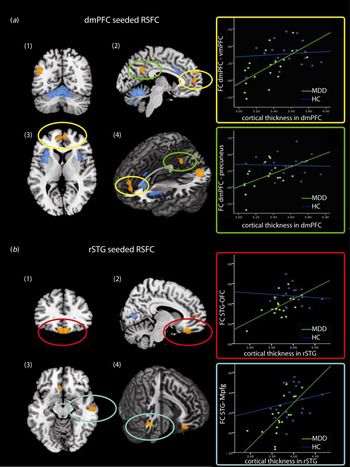
We found significant decreases in RSFC between the dmPFC and the left middle temporal gyrus [Brodmann area (BA) 39/21], right temporal pole (BA 21) and the PCC/precuneus in patients compared with HC. Functional connectivity of patients' rostral STG was reduced towards the pregenual ACC/medial frontal gyrus (BA 32/10) and bilateral orbitofrontal gyrus (OFC/rectal gyrus; BA 11). Increased RSFC in patients compared with HC was found between the dmPFC and left anterior insula and the left middle frontal gyrus (BA 9/10) regions that show negative correlation with the dmPFC when investigated across groups. No increased RSFC from the rostral STG seed was observed in patients as compared with HC. Illness severity did not affect our results. No connectivity differences were observed from the dlPFC and pMCC cortical thickness-defined seeds. Results are summarized in Table 3 and Fig. 2.
Group differences in functional connectivity and correlations with cortical thickness. Coronal (1), sagittal (2), axial (3) and three-dimensional projections (4) of the dorsomedial prefrontal cortex (dmPFC) (a) and rostral superior temporal gyrus (rSTG) (b) seeded connectivity differences between patients and controls. (a) Decreased dmPFC-seeded connectivity of the dmPFC with the precuneus, angular gyrus and middle temporal gyrus is depicted in blue. The green-boxed scatterplot on the right shows the correlation between dmPFC cortical thickness and dmPFC-seeded connectivity with the precuneus (marked by green circles). The green line indicates the relationship in patients (r kendall's tau = 0.32), the purple line the relationship in controls (r kendall's tau = 0.28). (b) Lower connectivity of the rSTG with the bilateral orbitofrontal gyrus (OFC) and medial prefrontal gyrus (mPFG) is depicted in yellow–orange. Red circles indicate lower connectivity of the rectal gyrus with the rSTG in patients, which is predicted by rSTG cortical thickness in both patients (r kendall's tau = 0.35) and controls (r kendall's tau = 0.38). These correlations are plotted in the right red-boxed scatterplot. RSFC, Resting-state functional connectivity; FC, functional connectivity; vmPFC, ventromedial prefrontal cortex; MDD, major depressive disorder; HC, healthy controls.

In patients, significant positive linear relationships between dmPFC cortical thickness and its average connectivity with the precuneus (r Kendall's tau = 0.32Footnote 1 Footnote †, p = 0.027, one-tailed), angular gyrus (r Kendall's tau = 0.29, p = 0.04, one-tailed) and left middle temporal gyrus (r Kendall's tau = 0.35, p = 0.02, one-tailed) were observed, whereas a negative relationship of dmPFC cortical thickness and the average connectivity with the left middle PFC (r kendall's tau = −0.33, p = 0.023, one-tailed) was observed in patients. Partialling out depression severity did not affect the results. In HC, no relationships between dmPFC cortical thickness and RSFC with the regions showing between-group differences were observed. Interactions of dmPFC cortical thickness and dmPFC-seeded connectivity, however, only occurred at trend level in the precuneus (F 2,34 = 2.47, p = 0.01). We followed up the relationships of dmPFC cortical thickness with dmPFC-seeded RSFC with a voxel-wise whole-brain conjunction analysis of the between-group differences in dmPFC-seeded connectivity and the relationship of dmPFC cortical thickness and dmPFC-seeded connectivity in patients (at p < 0.01, uncorrected). This analysis revealed a restricted overlap of effects in the precuneus. No group-specific effects of rostral STG cortical thickness on connectivity with the OFC or ventromedial PFC were observed (F < 1.27, p > 0.29). Across participants, cortical thickness of the rostral STG was correlated with RSFC of the medial PFC and OFC (mPFC: r Kendall's tau = 0.40, p < 0.001; OFC: r Kendall's tau = 0.35, p = 0.001; all one-tailed).
Medication confounds
Of the patients, four used mood-stabilizing medication that could be classified as anti-psychotic medication. Therefore we repeated our between-group analysis in SPSS after omission of these patients. Again, between-group differences were highly significant in all regions reported and effect sizes observed in these regions were very similar to the 19 HC versus 19 MDD comparisons. Also, the correlations of dmPFC volume with dmPFC–precuneus RSFC (r Kendall's tau = 0.37) and dmPFC–angular gyrus RSFC (r Kendall's tau = 0.33) within MDD patients were still significant (p < 0.05, one-tailed). The correlation with dmPFC–middle temporal gyrus RSFC, however, no longer reached significance (r Kendall's tau = 0.28, p = 0.08).
fALFF
No differences in local low-frequency oscillations between patients and HC were observed in any of the regions that showed abnormal cortical thickness in patients or any other regions.
Discussion
In this study, morphological cortical decline in patients with MDD was directly linked to functional disintegration of pathophysiological hot spot regions in disease-relevant brain networks, i.e. the DMN, the salience network (Seeley et al. Reference Seeley, Menon, Schatzberg, Keller, Glover, Kenna, Reiss and Greicius2007) and a ventral visceral–emotional network (Price & Drevets, Reference Price and Drevets2010). We observed that MDD patients present lower cortical thickness of the right dmPFC, right dlPFC, right STG/temporal pole, and the pMCC. We observed that the degree of dmPFC cortical thinning in patients is predictive of connectivity of this region with the precuneus within the DMN. Previously, Ma et al. (Reference Ma, Ding, Li, Guo, Long, Liu, Gao, Zeng, Zhao and Chen2012) also linked abnormal absolute brain volume to abnormal resting-state connectivity of the DMN in treatment-resistant MDD using voxel-based morphometry analysis, but did not relate the degree of volumetric decline to functional disintegration. To our knowledge this is the first study in MDD that links the degree of local structural abnormalities in cortical thickness to whole-brain resting-state connectivity, while controlling for local functional abnormalities. Local abnormalities in the amplitude of low frequency did not differ between groups, suggesting that the between-group differences from our cortical thickness-defined seeds did not result from differences in the functional properties of the seeds. As results were independent of illness severity, they may provide an important link between understanding the relationship between local abnormalities and the course of MDD on the one hand, and network abnormalities and the course of MDD on the other hand, which have both been previously reported. Despite the relatively small sample size and medication status limiting generalizability towards the depressed population at large, our study opens an interesting new possibility of linking structure to functional integrity, potentially important for understanding vulnerability for depression and its continued course.
In this study, we observed lower coupling of the dmPFC region with DMN regions, including the precuneus, the angular gyrus and middle temporal gyrus, as compared with HC. Decreased DMN connectivity with the PCC and precuneus has recently been described in first-episode medication-naive patients, whereas increased connectivity of the DMN with its anterior subcomponents was observed in the same study (Zhu et al. Reference Zhu, Wang, Xiao, Liao, Zhong, Wang and Yao2012). This suggests that functionally dissociable networks exist within the DMN (Andrews-Hanna et al. Reference Andrews-Hanna, Reidler, Sepulcre, Poulin and Buckner2010), with a shift towards frontal dominance of DMN control in patients, a suggestion that is supported by our findings of increased connectivity of the dmPFC with the anterior insula and lateral frontal regionsFootnote 2 . Nevertheless, our results of decreased connectivity of the dmPFC with the DMN are not consistent with other previous studies, also reviewed in Wang et al. (2012): Sheline et al. (Reference Sheline, Price, Yan and Mintun2010) suggested increased connectivity of a neighbouring region with the precuneus, although located more caudally and laterally. Moreover, they did not report on the unique connectivity of these regions, but summed connectivity of the precuneus, DLPFC and subgenual ACC, and did not report on whole-brain connectivity differences seeded from the dmPFC. Our results also contradict earlier work by Greicius et al. (Reference Greicius, Flores, Menon, Glover, Solvason, Kenna, Reiss and Schatzberg2007) who used an ICA approach and found increased connectivity strength with the thalamus and subgenual ACC and the DMN, a finding that could not be replicated in a second ICA report (Veer et al. Reference Veer, Beckmann, van Tol, Ferrarini, Milles, Veltman, Aleman, van Buchem, van der Wee and Rombouts2010). Local tissue abnormalities were, however, not accounted for in these studies, which could constitute an important source of variance that in our sample related to the degree of disconnectivity in the DMN.
Functional connectivity between the dmPFC and precuneus was not only found to be altered in depressed subjects, but was related to the degree of structural decline in the dmPFC, a region that has been repeatedly associated with emotional processing (Bermpohl et al. Reference Bermpohl, Walter, Sajonz, Lucke, Hagele, Sterzer, Adli, Heinz and Northoff2009; Walter et al. Reference Walter, Henning, Grimm, Schulte, Beck, Dydak, Schnepf, Boeker, Boesiger and Northoff2009a , Grimm et al. Reference Grimm, Ernst, Boesiger, Schuepbach, Boeker and Northoff2011), vulnerability for affective disorders (van Harmelen et al. Reference van Harmelen, van Tol, van der Wee, Veltman, Aleman, Spinhoven, van Buchem, Zitman, Penninx and Elzinga2010), divided attention (Walter et al. Reference Walter, Matthia, Wiebking, Rotte, Tempelmann, Bogerts, Heinze and Northoff2009b ) and the reactivation of cognitive schemes (Vohn et al. Reference Vohn, Fimm, Weber, Schnitker, Thron, Spijkers, Willmes and Sturm2007). The dmPFC region observed to show abnormal morphometry in our study mainly overlaps with a portion associated with anticipatory attention, however with importance for affective stimulation (Walter et al. Reference Walter, Matthia, Wiebking, Rotte, Tempelmann, Bogerts, Heinze and Northoff2009b ). Furthermore, activation of exactly this dmPFC region has been related to the depressive trait factor of negative self-concept during self-referential processing (Grimm et al. Reference Grimm, Ernst, Boesiger, Schuepbach, Hell, Boeker and Northoff2009). Notably, the predictive value of dmPFC morphometry for default-mode connectivity in patients was observed independent of illness severity, suggesting a pathophysiological mechanism that may be regarded a trait factor with high importance for individual relapse. However, the medication status of our patients may have confounded the relationship between illness severity and the morphometry–RSFC relationship. Therefore, the state-independency of our findings needs replication in a medication-naive sample, as use of a currently medication-free sample may not be sufficient to exclude the confounding influence of medication history (Rajkowska & Miguel-Hidalgo, Reference Rajkowska and Miguel-Hidalgo2007). Nevertheless, our findings suggest that abnormal thickness of the dmPFC specifically relates to the vulnerability for (relapse to) depression by affecting a network associated with self-referential processing, negative cognitive schemes and the expectational shaping of emotional experiences.
Additionally, we observed increased connectivity of the dmPFC with regions that make up a second emotional network, including the insula and superior frontal gyrus (the so-called fronto-opercular salience network)Footnote 3 . Results are consistent with previous work (Anand et al. Reference Anand, Li, Wang, Wu, Gao, Bukhari, Mathews, Kalnin and Lowe2005), and may represent the reduced propensity to regulate emotional processes (Leppanen, Reference Leppanen2006). Importantly, this increase happened in the domain of negative connectivity as indicated by negative correlation values. While the exact nature of potential anti-correlations remains open to date, and may depend on the preprocessing applied (Fox et al. Reference Fox, Zhang, Snyder and Raichle2009; Murphy et al. Reference Murphy, Birn, Handwerker, Jones and Bandettini2009), these results represent abnormal functional connectivity between different functional networks. This reduction in functional segregation must be seen pathological in the same vein as reduced positive correlations within a network would be interpreted. Furthermore, we observed connectivity abnormalities in MDD in a visceral–emotional network seeded from the rostral STG. This network, a putative output system modulating visceral functions related to emotions (Price & Drevets, Reference Price and Drevets2010), encompasses the medial OFC, rostral STG/temporal poles, bilateral amydala and mediodorsal thalamus and is related to other regions implicated in the DMN (Saleem et al. Reference Saleem, Kondo and Price2008). We observed lower rostral STG-seeded connectivity within this visceral cortico-cortical network with the medial OFC and medial frontal cortex in patients than in HC, in line with Cullen et al. (Reference Cullen, Gee, Klimes-Dougan, Gabbay, Hulvershorn, Mueller, Camchong, Bell, Houri, Kumra, Lim, Castellanos and Milham2009) and Veer et al. (Reference Veer, Beckmann, van Tol, Ferrarini, Milles, Veltman, Aleman, van Buchem, van der Wee and Rombouts2010). Abnormal connectivity was further modulated by the degree of cortical thickness in the rostral STG, although both in patients and HC. The rostral STG has been linked to emotional discrimination (Germine et al. Reference Germine, Garrido, Bruce and Hooker2011), reading affect (Wang et al. Reference Wang, Lee, Sigman and Dapretto2007) and abnormal emotional perception in schizophrenia (Taylor et al. Reference Taylor, Kang, Brege, Tso, Hosanagar and Johnson2012), and it has been suggested that the region plays an important role in feedback loops from the amygdala, subserving evaluation and attentional amplification to socially salient stimuli (Allison et al. Reference Allison, Puce and McCarthy2000). Therefore, this morphometric abnormality may further contribute to biased emotional processing associated with depression (Beck, Reference Beck2008). No long-range influence of structural deviance was observed for the pMCC and dlPFC seed. So far, the pMCC has not been a region of main focus for depression research and, given the lack of changes in functional connectivity, together with its putative involvement in basic motor tasks that are less typically impaired in MDD, we are not aware of previous descriptions of structural or functional abnormalities.
Our study should, however, be seen within the range of some important limitations. First, except for one, all patients were using psychotropic medication at the time of scanning, which could have influenced the volumetric and RSFC abnormalities observed. However, our approach was guided by abnormalities in cortical thickness and use of medication is often not associated with morphometric abnormalities, at least not in the regions that we found to be abnormal (Koolschijn et al. Reference Koolschijn, van Haren, Lensvelt-Mulders, Hulshoff Pol and Kahn2009). Also, it is unlikely that the linear relationship between local cortical thickness and RSFC connectivity is fully explained by medication status, and excluding four patients on anti-psychotic agents did not change the results. Second, 20 patients and 20 HC (19 versus 19 in the RSFC results) could be considered a relatively small sample size to observe other meaningful factors, explaining variance of structure and function, an issue that is a current focus of debate (Friston, Reference Friston2012; Ashton, Reference Ashton2013; Bacchetti, Reference Bacchetti2013; Button et al. Reference Button, Ioannidis, Mokrysz, Nosek, Flint, Robinson and Munafo2013; Lindquist et al. Reference Lindquist, Caffo and Crainiceanu2013; Quinlan, Reference Quinlan2013). Third, the gender distribution in our sample was near significant, although post-hoc testing showed that adding age and gender to the model did not change the results (data not shown). Nevertheless, this should also be considered a limitation that needs improvement in future research. Fourth, our fairly large voxel size in the RSFC analyses may not have been beneficial for detecting fine-grained spatial information in smaller well-defined subcortical structures. Therefore, smaller voxel sizes are recommended to investigate specific relationships with subcortical RSFC. It should, however, be noted that amygdala connectivity was clearly identified when reviewing the RSFC from the STG seed over all participants.
The present study, however, provides evidence that regional morphological deficits are linked to network irregularities in circuits vital for self-regulatory processing and salience processing. Moreover, effects were observed independent of current illness severity, which, however, may have been confounded by current medication status. However, volumetric abnormalities are most consistently observed independent of illness severity (Koolschijn et al. Reference Koolschijn, van Haren, Lensvelt-Mulders, Hulshoff Pol and Kahn2009), and no structural ‘normalization’ has been observed in longitudinal structural studies in MDD (Frodl et al. Reference Frodl, Meisenzahl, Zetzsche, Hohne, Banac, Schorr, Jager, Leinsinger, Bottlender, Reiser and Moller2004, Reference Frodl, Jäger, Born, Ritter, Kraft, Zetzsche, Bottlender, Leinsinger, Reiser, Müller and Meisenzahl2008). Nevertheless, structural abnormalities have been associated with course predictions (Frodl et al. Reference Frodl, Meisenzahl, Zetzsche, Hohne, Banac, Schorr, Jager, Leinsinger, Bottlender, Reiser and Moller2004, Reference Frodl, Jäger, Born, Ritter, Kraft, Zetzsche, Bottlender, Leinsinger, Reiser, Müller and Meisenzahl2008; McKinnon et al. Reference McKinnon, Yucel, Nazarov and MacQueen2009; Jarnum et al. Reference Jarnum, Eskildsen, Steffensen, Lundbye-Christensen, Simonsen, Thomsen, Frund, Theberge and Larsson2011) and the present results could provide a missing link between local abnormalities and the intrinsic organization of the brain, in turn providing an explanation for the unfavourable course of the disease: Patients with more severe thickness abnormalities were also the ones with the most abnormal integration of regions within and between the DMN. Our findings may ultimately suggest a connectivity-based structure–function relationship underlying the neurobiology of depressive disorders. Finally, our results indicate that structural variations in the dmPFC are strong predictors of network disintegration relevant for adequate emotional state regulation and that the function–structure relationship may be an important link in understanding the course predicting the value of morphometric abnormalities.
Future studies should investigate the importance of regional cortical and subcortical abnormalities for coherence of the DMN and salience network by using an ICA approach in a larger sample. This may increase the generalizability of the importance of morphometry variations for network integration, as the network definition is not biased by seed selection (Cole et al. Reference Cole, Smith and Beckmann2010). Finally, longitudinal analyses should confirm if we indeed here face a trait network abnormality that is predicted by morphometric deficits. Such data are at present not available.
Supplementary material
For supplementary material accompanying this paper visit http://dx.doi.org/10.1017/S0033291713002742.
Acknowledgements
We thank Dr Jörn Kaufmann, Dr Martin Kanowski and Renate Körbs for technical assistance. The study received the following funding: SFB779, DFG Wa2674 and National Natural Science Foundation of China (NSFC; no. 81250110088) and a Chinese Academy of Sciences (CAS) fellowship (no. 2011Y1GA05) to M.W.; NSFC (81271557, 61271151) to H.H.; and a CAS-German Academic Exchange Service (DAAD) scholarship to M.L.
Declaration of Interest
None.