Introduction
During the last session of the Austrian parliament before the 2017 parliamentary elections, Chancellor Kern used his speech to call for unity and further active collective policy-making. The speakers of his coalition partner ÖVP, however, did not join in and even refused to approve some joint government initiatives, although they had been able to implement many policies from their election manifesto over the past four years. However, the opposition parties were equally belligerent in their speeches. The Greens accused the governing parties of being ‘fake’ and controlled by large donors. Footnote 1 Would this debate have happened in the same way at any other time in the four years prior to the election? Probably not. Many commentators interpreted this behaviour in view of the upcoming election.
This specific excerpt from a debate gives reason to believe that the timing of the parliamentary cycle has an influence on the parliamentary discourse. I examine how the electoral cycle structurally influences the conflictuality of speeches in parliament. Previous studies show that both the topic under discussion and the overall political context have an impact on consensus and conflict in parliamentary debates (De Giorgi, Moury and Ruivo, Reference De Giorgi, Moury and Ruivo2015; Palau, Márquez and Chaqués-Bonafont, Reference Palau, Márquez and Chaqués-Bonafont2015). I argue that the timing in the electoral cycles is another key component that affects the conflictuality of the speeches of different parliamentary groups. I also argue that government and opposition are subject to different factors that have an influence on how strongly the electoral cycle affects their behaviour in parliament (Hix and Noury, Reference Hix and Noury2016). For government parties, it is particularly decisive to what extent they can implement their own ideas in bill proposals and if they need to distinguish themselves from a coalition partner when elections approach. For opposition parties, the opportunity to influence the policy-making process is important. This influence can be increased either under minority governments that rely on opposition support or by the institutional context.
In order to analyse these changes in behaviour, I use full transcripts of parliamentary speeches from Austria, Denmark, Ireland, New Zealand, Spain and Sweden from the past twenty to thirty years. These cases provide different government types and vary with regard to government and opposition rights. I analyse the sentiment of speeches on government bills in parliament (Liu, Reference Liu2015; Proksch et al., Reference Proksch, Lowe, Wäckerle and Soroka2019). I assume that a more positive tone can either be an indicator for praising achievements in policy-making or a desired influence on policy-making in a situation where a party is not able to pass legislation by itself. In contrast, a more negative tone is an indication of a more conflictual appearance. If parties are in a position of power, on the other hand, they will use more positive language to communicate their policy achievements to voters.
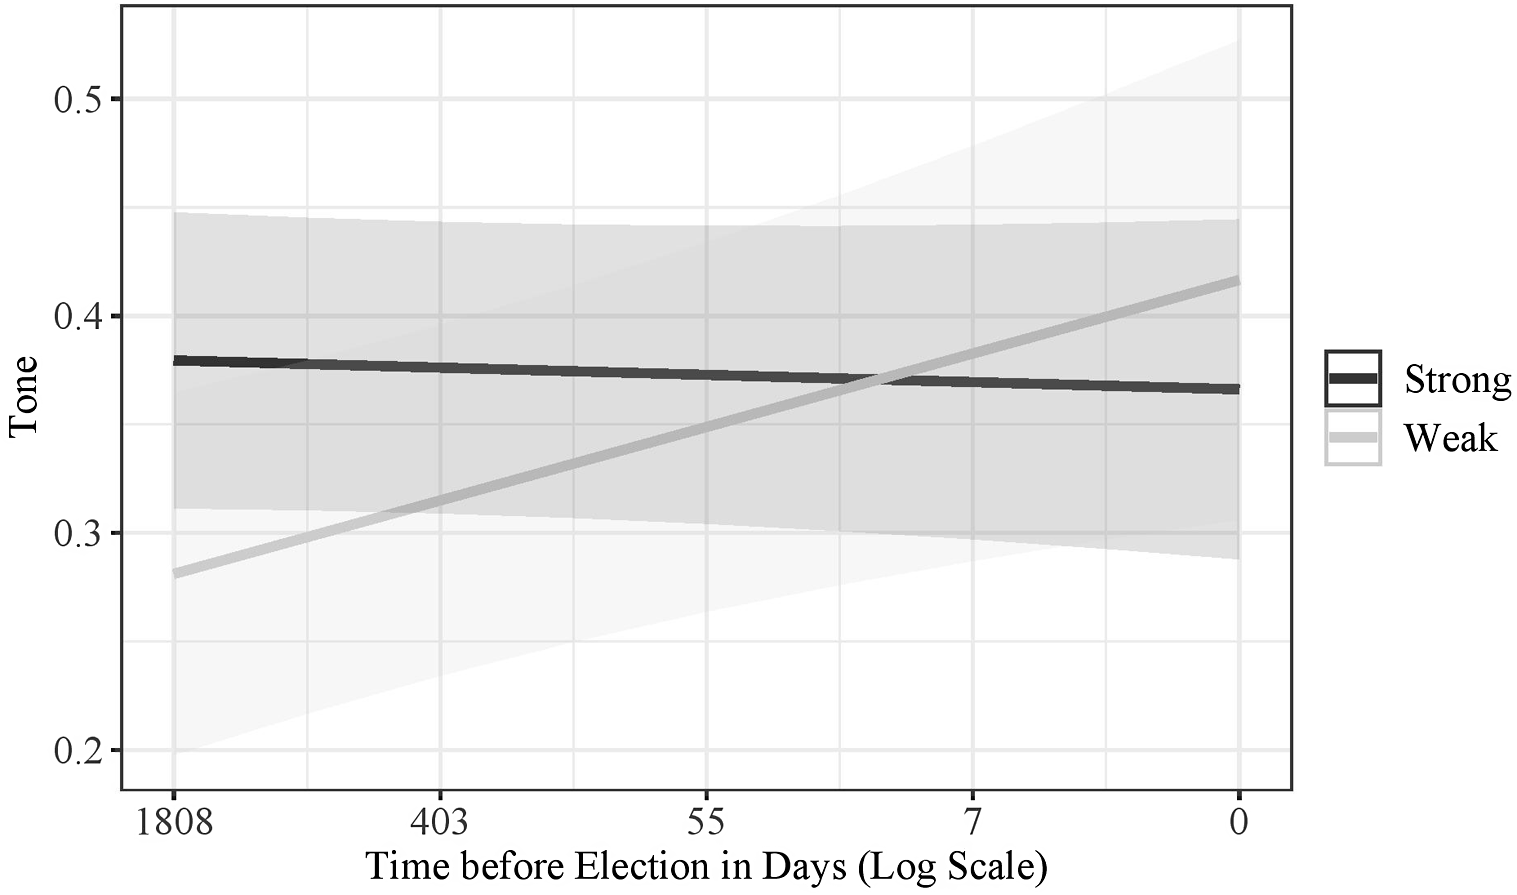
The following section outlines the current state of research on parliamentary behaviour of government and opposition parties and my hypotheses. After describing the data sources and research method, I analyse the results and conclude with the implications for further research. The results show that single-party governments tend to be more positive when elections come closer. However, this effect does not apply for government parties in coalitions. In contrast to previous results, opposition parties do not show a general negative trend. However, opposition parties under minority government show a more negative trend compared to their counterparts. The same applies to opposition parties when parliamentary institutions provide more possibilities to influence legislation. These results have important consequences for the analysis of parliamentary parties. On the one hand, future analyses need to take time into account in order to avoid biased results. On the other hand, the level of conflict affects citizens’ perceptions of the responsibility and legitimacy of parties in parliament (Andeweg, Reference Andeweg, Müller and Naurud2013; Goetz, Reference Goetz2014).
Theoretical foundations of party behaviour in parliament
Government and opposition parties have different instruments as well as agenda-setting opportunities that are supposed to ensure ‘the right of the majority to govern and the right of the minorities to be heard’ (Huber, Reference Huber1994, p. 1). Most models that analyse the interplay of these two groups in parliament consider their interests stable throughout the legislative cycle or even during several terms (Döring, Reference Döring2001; Tsebelis, Reference Tsebelis2002; Otjes and Louwerse, Reference Otjes and Louwerse2018). Some emphasise the importance of the government type as well as institutional features like parliamentary agenda-setting rules or opposition rights for the behaviour of parties. However, these are not expected to change throughout the electoral cycle. Important exceptions are Bräuninger and Debus (Reference Bräuninger and Debus2009) as well as Martin and Vanberg (Reference Martin and Vanberg2008). In their study of which party group initiates bills, Bräuninger and Debus take into account whether elections are approaching but find different effects per country. Martin and Vanberg, on the other hand, analyse how coalition governments discuss issues that are more internally divisive as elections draw near. Although such models may be well suited to describe long-term developments, they must be complemented by a short-term perspective if we take strategic party behaviour seriously.
Outside the legislative arena, the effect of the legislative cycle on party behaviour has recently moved into focus. Sagarzazu and Klüver (Reference Sagarzazu and Klüver2017), Seeberg (Reference Seebergforthcoming) and Van Der Velden, Schumacher and Vis (Reference Van Der Velden, Schumacher and Vis2018) examine in case studies how the issue attention of parties changes over the course of the cycle by analysing press releases. In comparative studies, on the other hand, Jennings and Wlezien (Reference Jennings and Wlezien2016) look at the change of voter preferences over the electoral cycle and Müller (Reference Müller2020) analyses how the coverage of campaign pledges in newspaper articles changes. Individual case studies have started to examine how the electoral cycle affects parties in parliaments (Pardos-Prado and Sagarzazu, Reference Pardos-Prado and Sagarzazu2019; Borghetto and Belchior, Reference Borghetto and Belchior2020). While these studies have advanced our understanding of the time-dependent strategic behaviour of parties in parliaments, conclusions have so far been limited to specific party systems in a particular institutional context. Based on the findings of these studies, I propose that parties’ motives in parliament change throughout an electoral term depending on different factors. How this change affects party behaviour depends both on their position in parliament and on the institutional possibilities to influence policy-making.
Whereas the two studies by Bräuninger and Debus (Reference Bräuninger and Debus2009) and Martin and Vanberg (Reference Martin and Vanberg2008) look at the initiation of bill proposals, I argue that focusing on the daily interaction in parliament offers an even more detailed insight into the impact of the electoral cycle on party behaviour. While bills generally require preparation time and the timing of their introduction is subject to strategic considerations, parliamentary interaction in debates offers a more immediate insight into the strategic behaviour of all parties. The literature on speech-making in parliament generally implies that the electoral pressure discourages shirking and is therefore beneficial to the interests of voters. In contrast, Fukumoto and Matsuo (Reference Fukumoto and Matsuo2015) show in their study of the Japanese House of Councillors that MPs who run for re-election allocate fewer resources to parliamentary activities when elections are closer. However, when they speak they try to be more efficient by delivering longer party messages. Furthermore, in their analysis of manifestos and party representatives’ statements, Baumann, Debus and Gross (Reference Baumann, Debus and Gross2021) find that approaching elections have an impact on the issues that different parties focus on in campaign messages. In addition, Pardos-Prado and Sagarzazu (Reference Pardos-Prado and Sagarzazu2019) show that regarding economic issues, public opinion and the reaction to opposition attacks play an increased role at different phases of the cycle.
In this analysis, I turn to another key factor, namely the expressed conflictuality in debates. I conceptualise conflict as the continuum between what Ilie (Reference Ilie2003) calls ‘adversariality’ and ‘cooperativeness’ in parliament: ‘on the one hand, a spirit of adversariality, which is manifested in position-claiming and opponent-challenging acts, and, on the other, a spirit of cooperativeness, which is manifested in joint decision-making and cross-party problem solving processes’ (Ilie, Reference Ilie2003, p. 73). I propose that electoral pressure has an influence on the expressed conflictuality in debates. Especially with the increase of technical possibilities for automated text analysis, the analysis of sentiment as a measure of conflictuality has become an important tool in the social sciences (Young and Soroka, Reference Young and Soroka2012; Liu, Reference Liu2015). More importantly, sentiment analysis is a theoretically well-founded way of measuring conflict across countries (Proksch et al., Reference Proksch, Lowe, Wäckerle and Soroka2019).
I interpret the expressed sentiment of a speaker in a speech as a combination of the proximity of their own position to the discussed matter - in this analysis a bill proposal - as well as a strategic consideration of which sentiment is best suited for achieving one’s goal. My expectation results from the general assumption that approval of a discussed matter results in a more positive language. Additionally, the willingness to act cooperatively is reflected in a more positive debate tone as well. On the other hand, negative sentiment can be an expression of positional distance or a more fundamental aversion to cooperation. It is thus central to the speaker’s behaviour which issue is discussed in a debate and which goals are pursued with the speech. For example, in their study of parliamentary opposition in Spain, Mújica and Sánchez-Cuenca (Reference Mújica and Sánchez-Cuenca2006) found that there is significantly less consensus in debates on government bills, while debates on issues that could not be clearly reduced to a left-right axis showed significantly more consensus. Furthermore, the broader political situation, such as an economic crisis, can have an impact on the general level of conflict (De Giorgi, Moury and Ruivo, Reference De Giorgi, Moury and Ruivo2015; Palau, Márquez and Chaqués-Bonafont, Reference Palau, Márquez and Chaqués-Bonafont2015). In addition, and independently of this, the electoral cycle provides incentives for individual groups in parliament to show more consensual or conflictual behaviour.
What consequences does this have for theoretical assumptions about the behaviour of parties in parliaments? As elections approach, a party’s focus shifts to representing the interests of potential voters or their own constituency. This is very likely to have an impact on the behaviour of MPs. I assume that parties have a greater interest in jointly shaping policies at the beginning of the legislative cycle than at the end of it. This leads to a lower willingness to compromise at the end of the cycle, which could be expressed in more negative language regardless of the topic under discussion. A more negative debate tone during the end of the electoral cycle has been found in other studies before (Proksch et al., Reference Proksch, Lowe, Wäckerle and Soroka2019). However, I assume that the effect of upcoming elections is not the same for all parties in parliament. For this reason, the effect might not be significant if all parties are examined in the same analysis. As Hix and Noury (Reference Hix and Noury2016) identify government-opposition dynamics as the most important factor for parliamentary voting behaviour, I expect the behaviour of both groups to be influenced by different factors. It seems plausible that government parties adopt a more positive tone in their debates when elections approach as they have a general incentive to sell their government work to voters as particularly positive. At the same time, I assume that opposition parties will be more negative in their speeches during this period in order to signal the need for a change of government. This divide is reflected in the first hypothesis:
H1: While the tone of government parties becomes more positive as elections approach, the tone of opposition parties becomes more negative.
In the same way that the behaviour of the two groups differs at the aggregate level, I assume that different factors within the two groups lead to varying behaviour over the legislative cycle. In how far the government-opposition divide is structuring the behaviour in parliament should depend on characteristics of the different parliaments as well as parties. For this reason, I examine both groups separately. The following sections outline these factors.
The change in government behaviour over the legislative term
The literature distinguishes between different types of government from different perspectives. One of the most obvious differences is between single-party governments and coalition governments. It has important implications for the expected behaviour in parliament: Whereas single-party governments can propose legislation as they wish (given they possess a majority of seats in parliament and the party is united with regard to the policy), coalition governments need to find a compromise in conflictual policy areas. From a theoretical perspective, there are different models of how government parties voice dissatisfaction and deal with disagreement (Martin, Reference Martin2004; Martin and Vanberg, Reference Martin and Vanberg2005, Reference Martin and Vanberg2008, Reference Martin and Vanberg2011, Reference Martin and Vanberg2014). In this context, it is important to look at the issues that government coalitions deal with at different points of time. Prominent studies show that the choice of issues accommodates the policy goals of both coalition members. First of all, issues that are more attractive for the government as a whole tend to get introduced earlier whereas unattractive issues are often postponed (Martin, Reference Martin2004). This is in line with the finding that coalition partners communicate with their potential voters more on internally divisive issues when parliamentary elections approach (Martin and Vanberg, Reference Martin and Vanberg2008).
In addition, coalition partners use the institutional features of parliament for scrutiny purposes (Martin and Vanberg, Reference Martin and Vanberg2011). This is associated with a longer time until a bill is passed. Therefore, a delay in the legislative process is used as a proxy for parliamentary scrutiny. Those scrutiny mechanisms result in the observation that ministerial drafts are more likely to be changed the greater the policy divisiveness of coalition partners. These studies lead to the conclusion that policies in a parliamentary system reflect, to a large extent, a compromise among the policy positions of coalition partners (Martin and Vanberg, Reference Martin and Vanberg2014). However, how easily this compromise is reached might differ between countries and parties and therefore has an effect on the behaviour in parliament.
I assume that in the case of a coalition government, the party behaviour might be more conflictual towards the end of the term as the different parties want to signal a distinct position to their voters. This assumption is in line with the findings by Sagarzazu and Klüver (Reference Sagarzazu and Klüver2017), who show that differentiation of issue attention of coalition parties in Germany increases towards the end of the electoral cycle. Additionally, as Martin (Reference Martin2004) has shown, introduced bills tend to be more conflictual at this time. For single-party governments, however, the effect would be the opposite: the closer elections are, the more positively their own legislative work is presented to the voters.
H2a: The tone of government parties in a coalition government becomes less positive the closer the next elections compared to a single-party government.
An additional factor might also have an influence on the timing during the legislative cycle when we look exclusively at coalition governments. It might be easier for a party in government that holds the prime minister’s office to signal a position to potential voters (Crabtree et al., Reference Crabtree, Golder, Gschwend and Indriđason2020; Klüver and Spoon, Reference Klüver and Spoon2020). Since the government’s position is often highly associated with this office, media attention is often disproportionately focused on the largest coalition partner. The smaller coalition party might feel the need to distinguish itself more in order to communicate its own position. For this reason, the smaller coalition parties might express themselves less positively at the end of the term than their bigger coalition partner in order to signal their specific position to the voters.
H2b: The tone of a junior coalition party becomes less positive the closer the next elections compared to the tone of the prime minister’s coalition party.
Furthermore, Martin and Vanberg (Reference Martin and Vanberg2011) analyse government coalition behaviour from the perspective of legislative institutions. They find that coalition parties can scrutinise each other if strong legislative institutions are present. Since this can have a substantial influence on the interaction of parties in the debate, I include it as a control variable for the analysis of the government parties.
The change in opposition behaviour over the legislative term
Martin and Vanberg (Reference Martin and Vanberg2011) focus, in their analysis of parliamentary behaviour during the legislative process, mainly on government coalitions. They argue that ‘strong parliaments do not simply serve as oversight bodies for the cabinet as a whole (…)’ but instead, allow ‘multiparty governments to resolve intra-government tensions’ (Martin and Vanberg, Reference Martin and Vanberg2011, p. 157). This implies that opposition behaviour is largely irrelevant for governmental bills, even though the authors leave a small leeway for the case of minority governments which they do not analyse in detail. This is in line with most of the literature that defines the goals of opposition parties as proposing alternatives to the potential voter rather than shaping policies actively (Dahl, Reference Dahl1966; Andeweg, Reference Andeweg, Müller and Naurud2013).
However, recent studies have shown that the influence of opposition parties is stronger than suggested so far. Seeberg (Reference Seeberg2016) shows that opposition parties are more important to policy change than assumed. Additionally, Russell et al. (Reference Russell, Gover, Wollter and Benton2017) demonstrate that non-government influence on amendments to bills in parliament is more extensive than the literature suggests and can be carried out for different reasons. These studies show that it can be reasonable for opposition parties to engage in the policy-making process and to collaborate with government parties. As Barnes (Reference Barnes2016, p. 29) puts it: ‘Collaboration is one of the only tools they [out-of-power legislators] have to advance their legislative agendas’. Moreover, this study is similarly interested in the impact of parliamentary interaction and discourse that does not necessarily influence policy outcomes directly.
There is also evidence for non-policy considerations in the behaviour of parties in parliament. Looking at voting behaviour, Tuttnauer (Reference Tuttnauer2018, p. 293) shows that ‘the better a party is placed to compete for office with the current government, in terms of size and governmental experience, the more likely it is to conflict with the government in plenary votes’. Therefore, not all opposition parties should be expected to engage in policy-making activities in parliament. In how far this influences the party behaviour of opposition parties, should be associated with the respective parliamentary system and the possibilities that they offer.
How does this translate into parliamentary behaviour? On a general level, opposition parties might follow a more conflictual strategy the closer elections are. This could also be related to the fact that voters perceive policy shifts from opposition parties much less than from government parties (Plescia and Staniek, Reference Plescia and Staniek2017). Therefore, they might engage in policy-making at the beginning of a cycle by criticising government bill proposals less negatively than during the times of elections. This general trend is already expressed in the first hypothesis. However, I expect this effect to be stronger for opposition parties, which have a higher possibility to influence legislation. These parties might use their influence by collaborating with government parties and actively change government bill proposals at the start of an electoral cycle. However, once elections are approaching they need to signal alternatives to their potential voters. Therefore, I assume that they will follow a more conflictual strategy and adopt a more negative attitude towards the government parties in comparison to their counterparts. Two important aspects affect the expected change of opposition parties throughout the legislative cycle.
One important factor for the influence of opposition parties is the presence of a minority government. In minority situations, the government is by definition dependent on the support from at least one opposition party or MP. Even though government parties often try to rely on support agreements, this enlarges the possibility for all opposition parties to shape policies (Gallagher, Laver and Mair, Reference Gallagher, Laver and Mair2006; Artés and Bustos, Reference Artés and Bustos2008). Additionally, countries that traditionally witness the formation of minority governments regularly might have a smaller government-opposition divide as issue-specific coalitions in parliament are changing more often (Strøm, Reference Strøm1990). De Giorgi, Moury and Ruivo (Reference De Giorgi, Moury and Ruivo2015) as well as Palau, Márquez and Chaqués-Bonafont (Reference Palau, Márquez and Chaqués-Bonafont2015) demonstrate, in their case studies on Portugal and Spain, significantly more consensus in the behaviour of the parliamentary opposition under minority governments. While I expect this effect on average also for this study, I assume a different effect throughout the electoral cycle. The increased possibility of influencing policy should have a more positive effect on the tone of speeches the further away elections are in comparison to opposition parties under majority governments.
H3a: The tone of opposition parties becomes more negative the closer the next elections in the case of minority governments compared to majority governments.
A country-specific factor that might lead to differences in the behaviour of opposition parties is the institutionalised policy influence. I assume that in the case of higher institutionalised influence of opposition parties, position-taking will be less structured by a government-opposition divide than in systems with less opposition influence. This influence is higher in the Scandinavian countries and Italy, lower in many central European countries and lowest in Great Britain (Strøm, Reference Strøm1990; Gallagher, Laver and Mair, Reference Gallagher, Laver and Mair2006; Martin and Vanberg, Reference Martin and Vanberg2011). Overall, parliamentary rules allowing opposition parties to influence policies are associated with fragmented opposition party systems. As a consequence, less deliberative rules lead to more merging of opposition parties and a stronger threat for government parties (Maeda, Reference Maeda2015). Garritzmann (Reference Garritzmann2017) identifies three major determinants of institutionalised opposition power: a strong committee system, agenda-setting rights and the possibilities to scrutinise the government through interpellations and questions. These variables give opposition parties in different countries varying possibilities to intervene in the legislative process. Regardless of the success of this effort to exert influence, I assume, in line with the previous hypothesis, that opposition parties will attempt to do so more at the beginning of the cycle. Therefore, as elections approach, I expect a more negative trend from opposition parties with more influence on legislation compared to those with less influence.
H3b: The tone of opposition parties becomes more negative the closer the next elections in parliaments where opposition parties have higher influence on government policies compared to systems with lower influence.
Models that look at the effect of the legislative term usually consider the end of the term to coincide with new elections and the possibility of a change in government and opposition. However, a new government formation does not necessarily need to concur with the end of the legislative term. In parliamentary democracies, the government is always dependent on the support of a parliamentary majority. Proposed effects might be less detectable in terms when the government changes during the term as this change might lead to similar effects as a new election and interrupt the ‘normal’ change in party behaviour during the term. Therefore, the analyses below are carried out in a robustness test only for ‘normal’ electoral periods in which the government does not change between two elections and without snap elections.
Empirical strategy
In order to analyse the changes in party behaviour during the legislative cycle, I use full transcripts of parliamentary speeches from Austria, Denmark, Ireland, New Zealand, Spain and Sweden. These are mostly drawn from the ParlSpeech data set, which contains annotated full text vectors of 6.3 million plenary speeches in the legislative chambers of key European states (Rauh and Schwalbach, Reference Rauh and Schwalbach2020). The data set has been supplemented with speeches from the Irish Parliament provided by Herzog and Mikhaylov (Reference Herzog and Mikhaylov2017). In order to make the raw data usable, the original documents of the parliamentary records had to be scraped from the archives of the respective parliamentary websites. The documents were then read into R (R Core Team, 2019) and processed with the packages stringr (Wickham, Reference Wickham2013) and quanteda (Benoit et al., Reference Benoit, Watanabe, Wang, Nulty, Obeng, Müller and Matsuo2018) to obtain an annotated data set suitable for analyses.Footnote 2
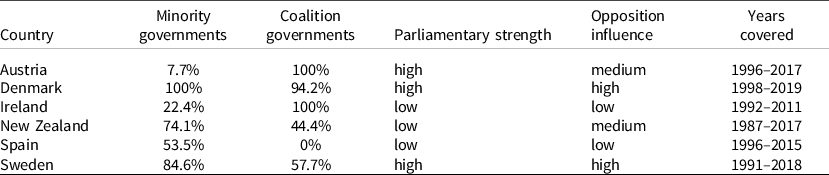
The selection of cases is based on two criteria in particular. For one thing, the cases are most similar in the sense that they are parliamentary democracies that have existed for more than 30 years. On the other hand, they show a strong variance with regard to theoretically important variables both within and between cases. Table 1 gives an overview of the distribution. The share of minority and coalition governments are measured as shares of all observations in the whole corpus.
Case selection

To compare the party behaviour, I selected only speeches on bill proposals that were initiated by the government. Due to differences in the working procedures in the parliaments, Footnote 3 this leads to different sample sizes for the countries although the time frames are comparable. On the one hand, there are differences in the initial number of speeches that are held in parliament on average. On the other hand, speeches in parliaments are distributed among different parliamentary activities, which are allocated at different proportions of the total time (in addition to bill proposals e.g., question times). The division depends on the working procedures of the respective parliaments. In order to classify the speeches, the titles of the debate topics had to be available for each country. For this reason, not all countries from the ParlSpeech data set could be included.
To analyse the changing strategies of parties in parliament, it would be possible to measure position-taking towards a proposed bill. This is technically possible through the use of scaling methods such as Wordfish or Wordshoal (Slapin and Proksch, Reference Slapin and Proksch2008; Lauderdale and Herzog, Reference Lauderdale and Herzog2016). However, one would have to assume that all debates on bills can be scaled on one overarching scale. Even though it is imaginable that the government-opposition divide is quite strongly structuring those debates, it is very unlikely that it does so equally across policy fields. Additionally, positioning oneself in parliament further away from one party might result in a position that is closer to another party. Therefore, the mechanisms of position-taking are rather complex. In contrast, expressing a sentiment that is more negative (or positive) does not necessarily mean being spatially closer to a party that is also expressing a negative (or positive) sentiment. For example, the sentiment of a radical left party towards a bill proposal on an economic policy issue of a centre-left government party might be similar to that of a centre-right party. The policy position of the two parties, however, might be very different. For this reason, a sentiment analysis of the bill debates is conducted to analyse the party behaviour during the legislative cycle.
Actors express sentiment in speeches in relation to other speakers and the topic of discussion, e.g., to other parties and/or the government, and to a legislative bill. I follow Proksch et al. (Reference Proksch, Lowe, Wäckerle and Soroka2019, p.102) in their notion of sentiment as ‘a one-dimensional quantity expressed using a relatively language-specific and possibly institutionally fixed set of lexical resources’. To conduct the sentiment analysis for all parliamentary speeches on bill proposals in the six countries, I use translations of sentiment dictionaries by Proksch et al. (Reference Proksch, Lowe, Wäckerle and Soroka2019) respectively in Danish, English, German, Spanish and Swedish. The authors have shown that the translated versions capture a comparable measurement of the tone of a speech. It is important to consider language-specific and parliament-specific aspects which lead to a general mean difference in the tone of different languages in parliament. For example, Rauh (Reference Rauh2018) concludes that sentiment scoring works better for positive messages than for negative messages for the German language. However, these differences are taken into account in the later analysis with country fixed effects. To analyse the expressed sentiment, I use the formula proposed by Lowe et al. (Reference Lowe, Benoit, Mikhaylov and Laver2011) of a log-ratio of positive over negative counts:
 $$log{{pos + 0.5} \over {neg + 0.5}}$$
This allows to capture only the relative positivity and negativity of a given speech in parliament. Footnote 4 The resulting score forms the basis of the dependent variable. If a party has spoken more than once during a bill debate, I analyse the tone of the combined speeches of all speakers of that party during one debate. The total amount of speeches per country varies due to differences in the parliamentary culture and the length of the investigation period: The smallest amount of individual speeches can be found in the Austrian case with about 195,000 speeches in 20 years and the largest amount in New Zealand with about 925,000 speeches in 31 years. In some cases, the data sets were slightly reduced at the beginning or end in order to analyse only full legislative periods.
In a further step, I deleted all speeches that did not belong to a speaker of a party (e.g., speeches by the chair). Then I separated the speeches according to whether they dealt with a government bill. In a final step, I deleted all debates in which only one party spoke or less than four speeches were made in total. Thus, purely procedural speeches are excluded that either serve to introduce a bill formally or initiate a voting procedure. These restrictions reduce the total sample by less than 10%. In a final step, I aggregate all speeches of the same party per bill debate during a parliamentary session, which I can identify with the respective title and date of the debate. These aggregations per debate and day form the unit of analysis and the basis for calculating the sentiment scores. This process results in a data set with roughly 114,000 sentiment observations of 53 parties. In this context, it needs to be stressed that parties are not unitary actors and the behaviour and position of their MPs cannot be expected to be completely consistent. Parties and their leadership differ in the way they interact with backbenchers, and the electoral system of a country has a considerable influence on these decisions (Proksch and Slapin, Reference Proksch and Slapin2015). However, this study is interested in the behaviour of parties as a whole. Nevertheless, intra-party differences and changes over time would be an important field for future research.
The main independent variable is the time before the next election. From a theoretical perspective, there are different approaches of how to specify this variable. The simplest implementation is to use the days until the next election. In order to control for the fact that not all countries and legislative periods are of the same length, this measure can also be transformed to a variable that measures the proportion of time passed in a legislative period. However, it seems unlikely that time will cause a uniform change throughout the entire term (Koop, Reh and Bressanelli, Reference Koop, Reh and Bressanelli2018). On the one hand, parties might switch to a campaign mode at a certain point before the election. For this reason, it is possible to use a dummy for the year before an election, as it is used as a control variable in other studies (Proksch et al., Reference Proksch, Lowe, Wäckerle and Soroka2019). However, this measure is also a simplification, as there will be changes within the election period and the cut-off point will not be the same for all parties and countries. Alternatively, it is possible that time has an influence over the whole term, but with varying degrees of intensity. I assume that the same range of days immediately before the election has a greater influence than earlier in the term. In order to account for the changing importance of the days before an upcoming election, I use the (natural) logarithm of the number of days before the next election as an independent variable and use the previous three specifications in robustness tests. Although this specification is theoretically most plausible, it should be noted that it leads to just a few cases for the distances right before the election and therefore provides less common support as well as potentially larger confidence intervals in the regression analysis. When estimating interaction effects, this has to be taken into account in order to avoid false conclusions about the present effect (Hainmueller, Mummolo and Xu, Reference Hainmueller, Mummolo and Xu2019).
All relevant information about the length of the cycles and government types (coalition governments, minority governments and support parties) are taken from ParlGov (Döring and Manow, Reference Döring and Manow2018). The coding of strong institutions for government coalitions is taken from Martin and Vanberg (Reference Martin and Vanberg2011) and the information on opposition influence from Garritzmann (Reference Garritzmann2017). Footnote 5 Additionally, I include characteristics of the parties as control variables that might influence the sentiment of the parties structurally. These are two dummy variables, whether the party is a mainstream party or whether the party is a challenger party (Meguid, Reference Meguid2007). The structure of the data is such that the sentiment variable is nested in debates, which in turn are nested in electoral cycles and these are nested in the respective countries. Therefore, I use a multilevel regression model including a debate-level and an electoral cycle-level as well as country fixed effects in order to analyse the interaction of the effect of timing and the relevant variable for government and opposition parties on the sentiment.
However, from this model alone it is not distinguishable whether the effect is due to strategic changes in behaviour over time or if it correlates with a general change in the conflict potential of the bill proposals discussed in parliament. Both results would be relevant, but would mean something different. Therefore, I need a proxy for an initial conflict potential for each discussed bill. There is no feasible way to assign a unique value of conflict to each bill debate topic for each country. For this reason, I use the issue area of the respective debate as a proxy. Needless to say, it would be naïve to assume that there is no variance of conflict between parties within issue areas. Nevertheless, this procedure reflects the widely accepted approach of projects, such as the Comparative Manifesto Project (Volkens et al., Reference Volkens, Krause, Lehmann, Matthieß, Merz, Regel and Weßels2019), that party competition takes place on the basis of lines of conflict relating to such issues. The potential for conflict between parties in a particular area is thus strongly related to the extent to which their respective positions in that area differ on a general level.
I use the information available on the topic of the debate, to classify the policy area for each of these bill proposals according to the classification scheme proposed by Klüver and Zubek (Reference Klüver and Zubek2018). In a next step, I merge the data with a data set from the Manifesto Project, that contains the respective positions of the parties in the different issue areas. From the position-taking of parties in their election manifestos, it is possible to estimate each party’s positional difference to the position of the proposing government party or government coalition mean. I use the resulting difference score as a control variable in order to be able to attribute the changing behaviour with more certainty to the underlying mechanism. By using this control variable, I take the essential component of agenda-setting power seriously. The resulting time effects for the government parties are thus either related to the strategic use of sentiment in the debates or the strategic addressing of more or less conflictual matters between the government parties within a topic area. For opposition parties, the link to the strategic use of sentiment is even more plausible, since these parties have no influence on the agenda-setting of governmental bill debates.
Results
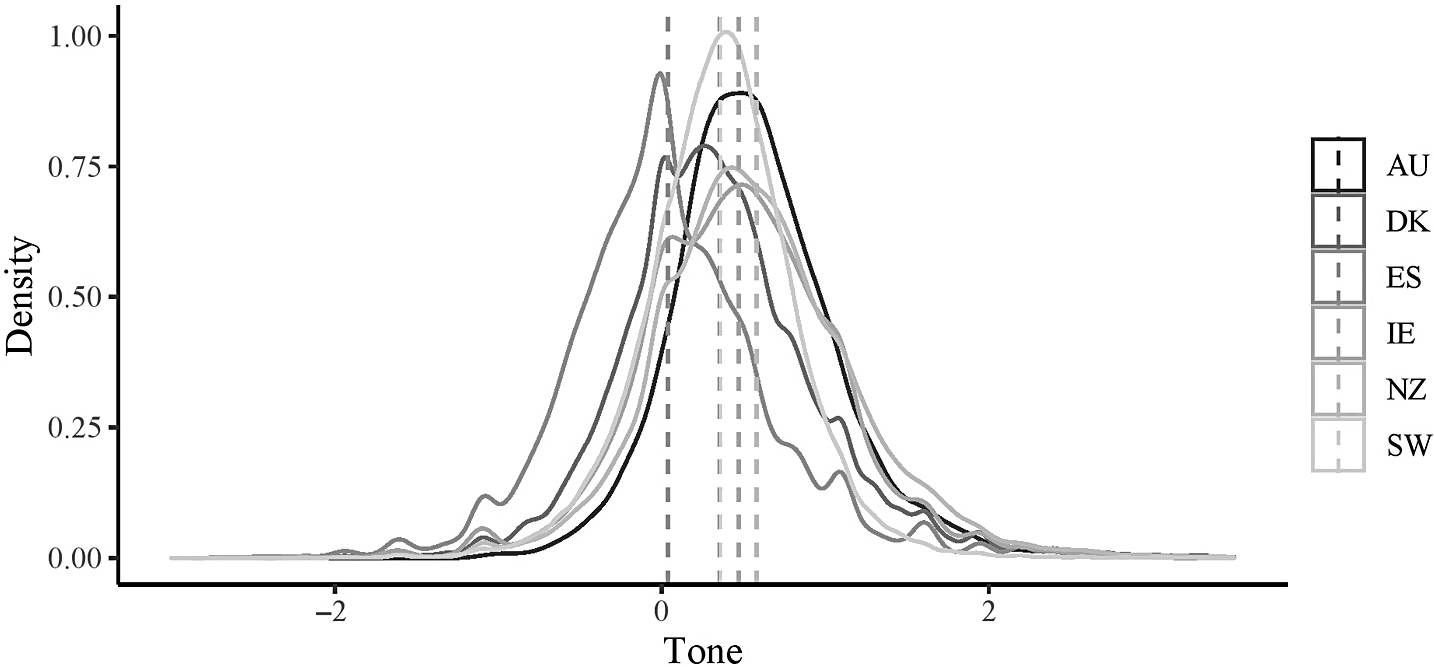
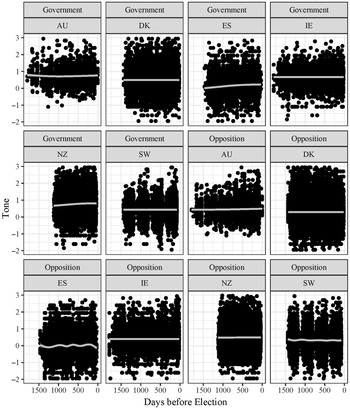
Before I take a closer look at the analysis of the influence of time on the sentiment of parliamentary debates, the dependent variable itself must be examined more closely. Figures A1 and A2 in Appendix A illustrate that the vast majority of the variable observations is between −1 and 1.5 with a mean of 0.38. This high concentration of the variable should be taken into account in the following analysis. As expected, the sentiment of government parties is on average more positive than that of opposition parties and there are substantial differences between countries. Furthermore, Figure B1 in Appendix B shows the plotted sentiment values broken down by country as well as government-opposition status throughout the legislative cycle. No uniform trend is apparent, but a positive trend for government parties and a negative trend for opposition parties can be seen for most cases. The figure also illustrates that speech observations for all countries are evenly distributed over the legislative cycle.
Interaction plot: Government vs. opposition.

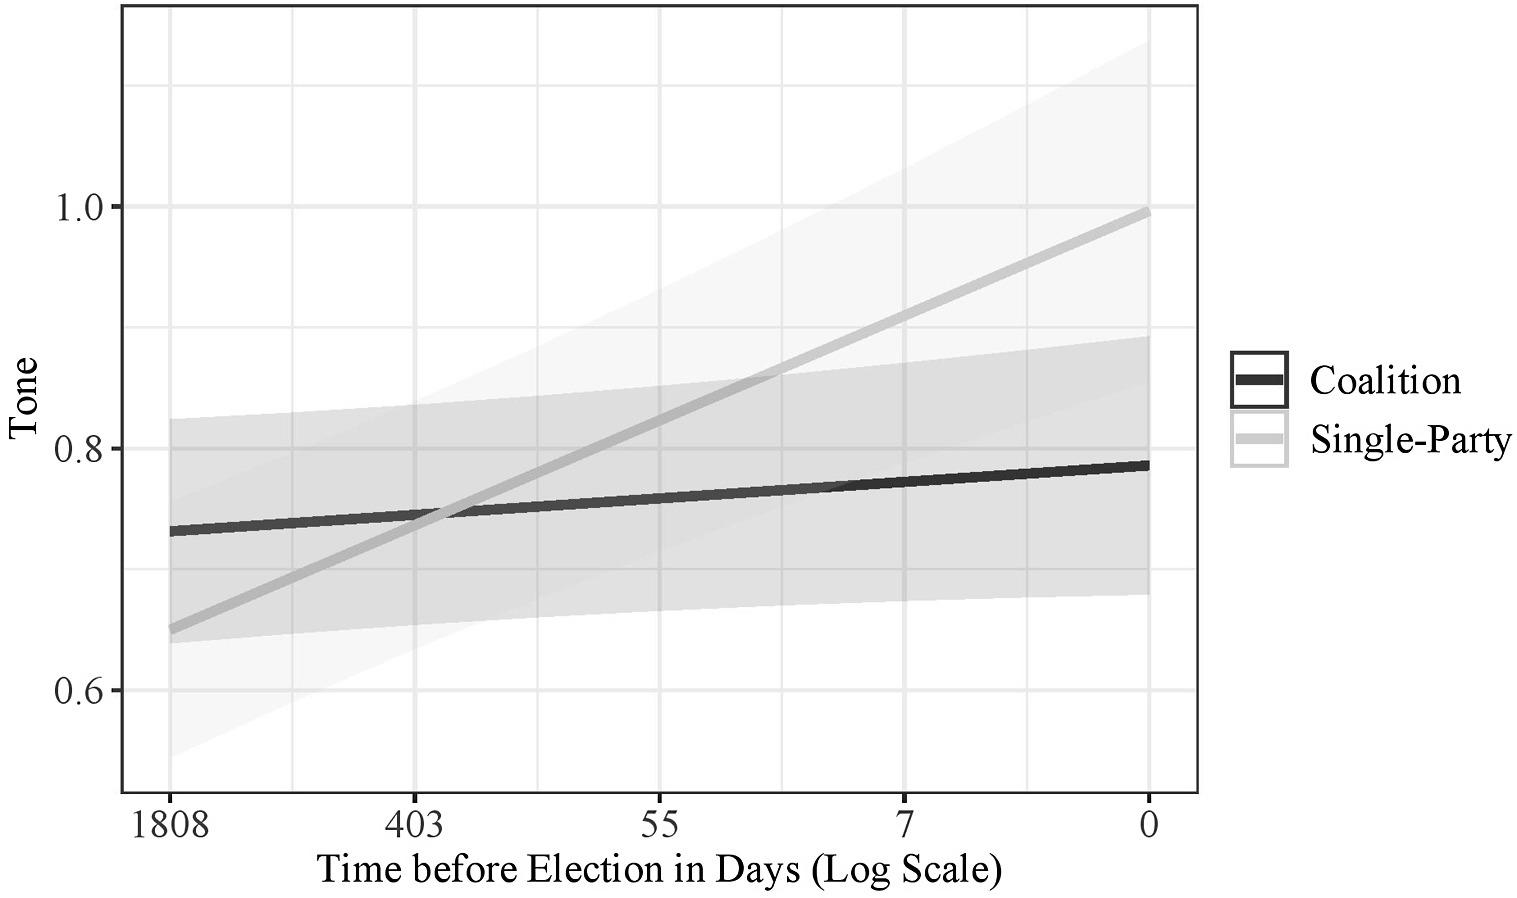
Interaction plot: Single-party vs. coalition government.

Regression models

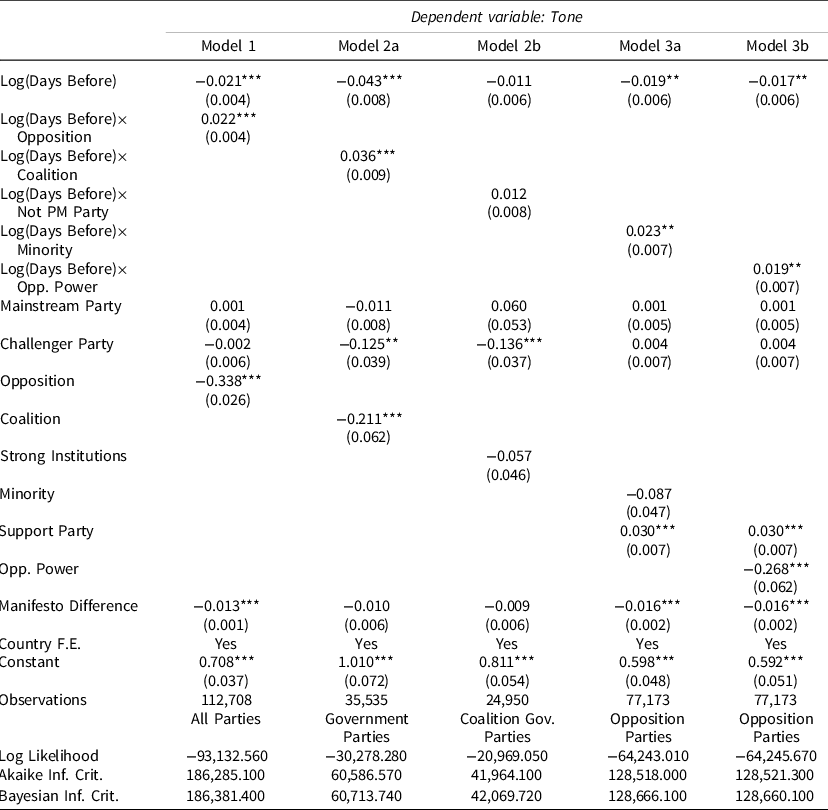
Note: *P < 0.05; **P < 0.01; ***P < 0.001.
In regression Model 1, I analyse the complete data set with a focus on the difference between government and opposition. In contrast to other studies, the model shows a positive trend for approaching elections. Footnote 6 I insert an interaction effect into the regression, which tests whether the sentiment before the election changes differently for government and opposition parties. It is significant and basically equalises the positive effect on tone during the legislative cycle for opposition parties: This confirms the assumption about the effect of elections on government parties. Contrary to H1 and previous findings, however, the sentiment of opposition parties does not change throughout the legislative cycle. Figure 1 illustrates this interaction effect: While there is a positive trend for government parties, the sentiment for opposition parties remains largely the same throughout the term. The party-specific control variables do not show a significant effect on the sentiment.
In order to analyse whether the mechanisms of the theoretical assumptions on coalition behaviour translate into the sentiment of parliamentary speeches, I subset the data set by only selecting government parties. As in the previous model, there is a positive effect of approaching elections on sentiment in parliamentary speeches (Model 2a). I add an interaction effect that estimates the impact of timing on different government types. This effect is significantly negative for coalition government parties and thus has a similar equalising effect for this group as in the previous model for opposition parties: While coalition parties show a relatively constant sentiment throughout the legislative cycle, parties from single-party governments become much more positive as elections approach. Figure 2 displays these interaction effects. It shows a more positive sentiment for single-party governments immediately before the election than for coalition governments. This indicates that single-party governments use, in particular, the time prior to an election to present their bill proposals in a very positive manner, as they count disproportionately more in the logarithmic model. While the mainstream party dummy has no effect in all models on government parties, challenger parties are particularly negative.
Model 2b takes a closer look at coalition governments (reducing the sample size to cases with coalition governments). I examine whether the effect is different on the party of the respective head of government compared to the other coalition parties. However, the two types of government parties do not show a significant interaction effect. As the literature on coalition governments distinguishes between different legislative institutions, I created a dummy variable for countries with strong legislative institutions and for those without them. This variable also does not show a significant effect. If we follow Martin and Vanberg (Reference Martin and Vanberg2011) with regard to the effects of legislative institutions, we should not expect a significant change in the sentiment of the opposition parties as they are not expected to be influential on government policies. However, as outlined above, there are good reasons to believe that the actual picture might be more complex. For this reason, Models 3a and 3b look specifically at opposition parties (reducing the sample size to opposition parties).
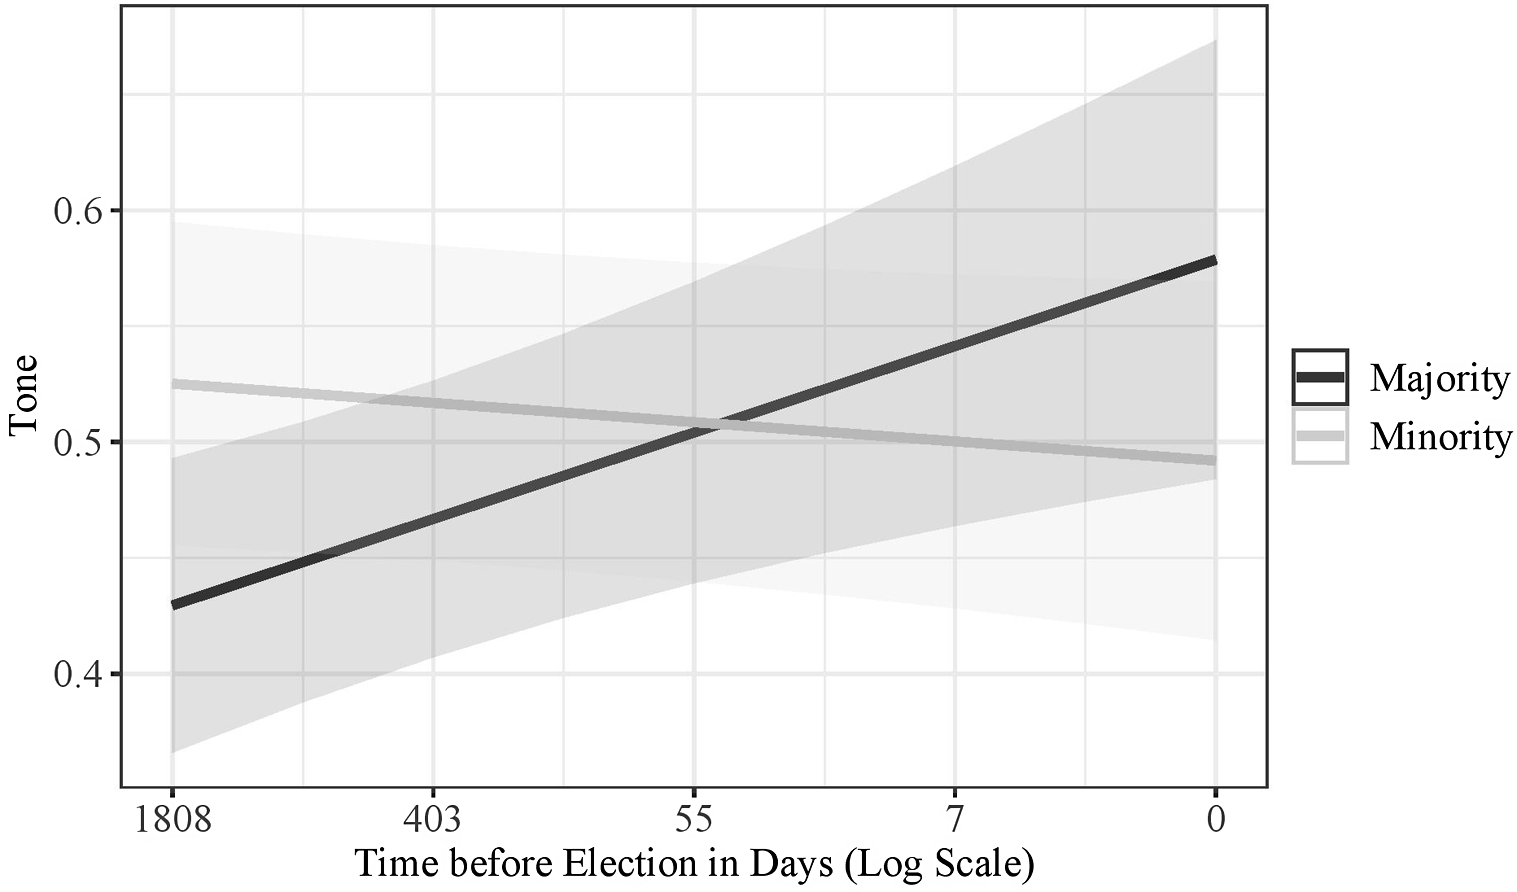
Model 3a examines whether the presence of minority governments has an effect on the tone of the debate. Minority governments, in general, do not show a significant effect on the tone of opposition parties. However, opposition parties are significantly more positive throughout most of the time of the electoral cycle under minority governments and only become more negative just before the election (Figure 3). Due to a positive trend for opposition parties under majority parties, the estimate for these parties is higher than the estimate for minority governments just before the election, which neutralises the general positive effect of minority governments. Therefore, the model confirms the different time effects for opposition parties under minority and majority governments. However, this significant difference is due to both the negative trend for minority governments and the unexpected positive trend for majority governments. Furthermore, support parties under minority governments are significantly more positive than other opposition parties.
Interaction plot: Minority vs. majority government.

One factor that might differentiate between countries is the institutionalised influence of the opposition on government policy-making. Model 3b shows that in countries with more opposition power to influence legislation, the sentiment of the opposition is generally more negative. However, there is also a significant interaction effect with the time variable. The plot of the interaction effect (Figure 4) demonstrates that while opposition parties in parliaments with weak opposition rights tend to show a positive trend with approaching elections, this trend is slightly negative in parliaments with strong opposition rights. However, the effect is less substantial compared to the previous significant interaction effects. In addition, it must be emphasised once again that the significant effects for both opposition models are also based on the positive trend of the respective counterparts (opposition parties under majority governments and opposition with weak influence on legislation). This finding does not contradict the theorised mechanisms. However, it contradicts the assumption that opposition parties in parliament generally enter a negative campaigning mode as elections approach.
Interaction plot: Weak vs. strog opposition influence.

The manifesto difference to the government has the expected significant negative effect for the first model as well as both opposition models: The further away a party is from the estimated government position in a policy area, the more negatively it expresses itself. This result underlines the importance of the topic for shaping the respective debate. This ties in with previous findings that opposition consensus varies significantly between issue areas (Mújica and Sánchez-Cuenca, Reference Mújica and Sánchez-Cuenca2006). Furthermore, it shows that the sentiment of opposition parties is strongly influenced by their ideological distance to the government’s expected ideal point. In the case of the two government models, the a priori policy distance has no significant effect. This makes sense, since the variation of the variable is very small and, by definition, becomes zero for all single-party governments. Taken together, the findings confirm that the parties’ behaviour is a result of the issues discussed as well as strategic considerations.
Robustness tests Footnote 7
In order to ensure the validity of the results, I run various robustness tests. In a first test, I exchange the time variable in my models with the three specifications described in the empirical strategy section. The results hardly change with the other specifications. Only when I use the dummy variable (year before an election) do the interaction terms of the time variables with minority government and opposition power become insignificant. However, as this variable provides the heaviest simplification, this is also where most of the variation and thus explanatory power is lost. Additionally, I calculate the multilevel regressions as OLS regression models. All interaction effects remain significant.
Secondly, I estimated all models with significant results once again with a subset of cases where the legislative term is complete. As described above, the effect could be altered by early elections if actors gear their behaviour to a full period and conditions change in the middle of a normal cycle. However, the results remain significant for this modification. Furthermore, I run the main models with an additional variable that measures agenda capacity (specified as number of speeches per year and country). However, this has no substantial influence on the results.
As a last robustness test, I run the main models and exclude one country at a time to test whether the results were driven by specific countries. Only the interaction effect between the time variable and the government-opposition dummy becomes just insignificant (P = 0.058) with the exclusion of New Zealand. This might support the assumption that the effects are rather related to the differences within both groups. Additionally, the interaction effect between opposition power and the time variable becomes just insignificant (P = 0.08) with the exclusion of Sweden. However, all other 22 models produce the same significance levels results and thus underline the robustness of the results.
Discussion and conclusion
In this study, I look at the changing motivations of parliamentary behaviour for different party groups in parliament. Starting from the premise that the proximity of elections is a decisive factor for party behaviour, I propose that this has different implications for different party groups in parliament. I argue that the timing of elections has an impact on the expressed conflictuality in parliamentary debates. In the case of government parties, those parties that are free to introduce their own bill proposals should also present them as positively as possible with elections approaching. For opposition parties, on the other hand, the effect of timing should depend on how strong their influence on the policy-making process is. I analysed the sentiment of speeches on government bill proposals in six national parliaments as a proxy for the degree of conflict which is expressed by the speakers of a party in a debate: A more negative tone serves as an indication of a more conflictual behaviour, which could be interpreted as more vote-seeking. A more positive sentiment, on the contrary, can be an indicator of more cooperative behaviour, for example when opposition parties try to influence the government’s policy proposals or government parties that try to sell their proposals to the voters.
The results show that there is no general trend towards the end of the legislative cycle. This may seem surprising at first, but it also makes sense, since the theoretical expectations for different parties are not the same. The breakdown by party groups shows significant differences. The analysis of government parties comes to the conclusion that the impact of the legislative cycle differs significantly between single-party and coalition governments. The former become much more positive as elections approach. This indicates that such governments can always express their ideal positions in bill proposals. Therefore, it is more attractive for them to sell these ideal positions to their voters as particularly positive when elections are close. This mechanism cannot be implemented to the same extent by coalition governments, since they always compete with their coalition partners and thus need to compromise. As a consequence, coalition governments are not fundamentally more negative, but the trend towards the end of the cycle is significantly more positive for single-party governments.
Contrary to my hypothesis and previous findings, opposition parties do not become generally more negative towards the end of the cycle. Instead, the effect of time on opposition parties is particularly determined by whether they can exert more influence on government proposals. This effect can be interpreted in such a way that opposition parties in these situations try, on average, more frequently at the start of the legislative period to influence government proposals through cooperative behaviour, while they criticise the government more strongly through negative sentiment before the election. Furthermore, the difference between minority and majority governments matters for opposition parties. In this respect, opposition parties under minority governments follow the same logic as those with more influence on policy-making since the government is dependent on opposition support. However, the difference in trend is also driven by a positive trend of the respective counterparts (opposition parties under majority governments and with weak institutional influence on legislation).
In summary, the results show that parties in parliament adjust their behaviour to the preference order of their own goals. However, the extent to which this is reflected in behavioural changes in parliament, in this context more or less conflictual speeches, depends strongly on the context. Thus, this study complements the existing literature on strategic behaviour of parties in parliament with regard to timing. While previous studies looked at agenda-setting (Martin and Vanberg, Reference Martin and Vanberg2014), the frequency of speaking behaviour (Fukumoto and Matsuo (Reference Fukumoto and Matsuo2015)), issue attention (Pardos-Prado and Sagarzazu, Reference Pardos-Prado and Sagarzazu2019; Sagarzazu and Klüver, Reference Sagarzazu and Klüver2017) or the impact of major political crises (De Giorgi, Moury and Ruivo, Reference De Giorgi, Moury and Ruivo2015; Palau, Márquez and Chaqués-Bonafont, Reference Palau, Márquez and Chaqués-Bonafont2015), I examined the influence of strategic considerations on the way MPs speak. Furthermore, it is innovative by comparing different government and opposition constellations in varying parliamentary settings.
What kind of implications do these findings have? On the one hand, there is a technical perspective. The analysis of parliamentary speeches and debates has moved into the focus of political science (Proksch and Slapin, Reference Proksch and Slapin2015). While new methods have emerged to analyse these speeches, theoretically sound assumptions are needed about how, when and why parties and MPs express themselves in their speeches. If the behaviour of parties towards legislative initiatives changes systematically throughout the legislative cycle - as this study shows - this has to be contextualised in analyses of parliamentary speeches. For example, if a speech by a single-party majority government MP is particularly positive just before an election, this could be related more to the timing of the debate than to her approval of the content of a bill. By controlling for time effects on the different groups in parliament, we can prevent potential bias in analyses and misinterpretation of speech behaviour. It is also possible to link the conclusions to other studies or it could be checked whether other routine procedures in parliament are also influenced by the electoral cycle. For example, Müller and Louwerse (Reference Müller and Louwerse2020) examine the impact of the electoral cycle on electoral surveys which may be influenced by a change in public behaviour in parliament. In addition, it could be examined to what extent the influence of the electoral cycle on extra-parliamentary activities such as press releases (Sagarzazu and Klüver, Reference Sagarzazu and Klüver2017; Seeberg, Reference Seebergforthcoming; Van Der Velden, Schumacher and Vis, Reference Van Der Velden, Schumacher and Vis2018) are related to the results of this study.
On the other hand, the implications can also be considered in relation to normative aspects. The discussion on the understanding of different actors’ roles in parliament is particularly important. This question ties in particularly with studies on what constitutes a responsive and responsible opposition (Andeweg, Reference Andeweg, Müller and Naurud2013; Goetz, Reference Goetz2014). On the one hand, it might be desirable if the opposition participates constructively in the legislative process, resulting in proposals that represent a larger part of the population. On the other hand, this may lead to a situation where government and opposition are no longer clearly distinguishable for the voter and political decisions are perceived as without alternative. In this area, further research is needed to determine what kind of sentiment constitutes a preferable debate. Relevant questions in this context are: When can we consider a very negative sentiment in debates as harmful to parliamentary cooperation and when can we consider an excessively positive tone or positions of parties that are perceived as too similar as equally harmful? The effects on the electorate would also be interesting with regard to the electoral cycle: To what extent, for example, is electoral campaigning perceived in parliament? This study has set a reference point by demonstrating that the electoral cycle structurally influences parties in their behaviour depending on their role in parliament.
Supplementary material
For supplementary material accompanying this paper visit https://doi.org/10.1017/S1755773921000291
Acknowledgements
The author thanks Stefan Müller, Christian Rauh, Stefanie Bailer, Ingo Rohlfing, Sven-Oliver Proksch and Bruno Castanho Silva for valuable and constructive comments on previous versions of the manuscript. Earlier versions of the paper were presented at EPSA 2019 and ECPR Conference on Advances in the Empirical and Theoretical Study of Parliaments 2019.
Disclosure statement
No financial interest or benefit has arisen from the direct applications of this research.
Appendices
A. Distribution of tone
Distribution of the dependent variable for government and opposition.

Distribution of the dependent variable by country.

B. Country trends
Country trends for the dependent variable.