Introduction
Lichens, being intricate symbiotic associations between algae and fungi (Spribille Reference Spribille2018), represent an important biodiversity component in many ecosystems. They often dominate habitats where plants are less successful and are important for ecosystem functioning at high latitudes and elevations (Asplund & Wardle Reference Asplund and Wardle2017). Lichens occur in most terrestrial ecosystems and often tolerate extreme desiccation and temperatures (Büdel et al. Reference Büdel, Becker, Porembski and Barthlott1997; Lange et al. Reference Lange, Belnap and Reichenberger1998, Reference Lange, Büdel, Meyer, Zellner and Zotz2000; Sancho et al. Reference Sancho, de la Torre, Horneck, Ascaso, de los Rios, Pintado, Wierzchos and Schuster2007; Colesie et al. Reference Colesie, Green, Raggio and Büdel2016). Yet they are vulnerable to environmental change, particularly to changes in climate (Cornelissen et al. Reference Cornelissen, Callaghan, Alatalo, Michelsen, Graglia, Hartley, Hik, Hobbie, Press and Robinson2001; Elmendorf et al. Reference Elmendorf, Henry, Hollister, Björk, Bjorkman, Callaghan, Collier, Cooper, Cornelissen and Day2012; Lang et al. Reference Lang, Cornelissen, Shaver, Ahrens, Callaghan, Molau, ter Braak, Hölzer and Aerts2012) and land use (Stofer et al. Reference Stofer, Bergamini, Aragón, Carvalho, Coppins, Davey, Dietrich, Farkas, Kärkkäinen and Keller2006).
Lichens interact with their environment by various functional traits and thereby increase functional diversity (Ellis et al. Reference Ellis, Asplund, Benesperi, Branquinho, Di Nuzzo, Hurtado, Martínez, Matos, Nascimbene and Pinho2021). Some functional traits relate to water uptake that allows them to utilize hydration sources such as rain, dew, and humid air (Lange et al. Reference Lange, Kilian and Ziegler1986; Gauslaa Reference Gauslaa2014; Phinney et al. Reference Phinney, Solhaug and Gauslaa2019). Light is essential for photosynthesis and growth, but only when lichens are moist (Palmqvist Reference Palmqvist2000). However, light affects hydration levels, as solar radiation drives desiccation rate (Lange Reference Lange1969; Gauslaa et al. Reference Gauslaa, Solhaug and Longinotti2017). Furthermore, high light often damages the photosynthetic apparatus in dry lichens (Gauslaa & Solhaug Reference Gauslaa and Solhaug1996; Gauslaa et al. Reference Gauslaa, Coxson and Solhaug2012) and causes oxidative stress (Beckett et al. Reference Beckett, Minibayeva, Solhaug and Roach2021). Thus, the interaction of high light and lasting desiccation can threaten various forest lichens. The pH of the substratum is another important factor. It influences nutrient availability (Richardson et al. Reference Richardson, Peltzer, Allen, McGlone and Parfitt2004; Penn & Camberato Reference Penn and Camberato2019) and thus shapes the distribution of many lichens (Gauslaa et al. Reference Gauslaa, Goward and Pypker2020). Some species, such as cyano- and cephalolichens forming the epiphytic Lobarion community, require a substratum with higher pH than the many acidophytic chlorolichens (Gauslaa Reference Gauslaa1985, Reference Gauslaa1995; Gauslaa & Holien Reference Gauslaa and Holien1998; Gauslaa et al. Reference Gauslaa, Goward and Asplund2021). Bark pH is shaped by the chemical characteristics of air-borne depositions, local soils and elemental uptake by the tree itself (Barkman Reference Barkman1958). Due to tree species-specific bark pH, tree species often host different lichen communities (Rose Reference Rose1988).
Many lichens are red listed, some close to extinction (IUCN 2021). Endangered lichens, such as the critically endangered cyanolichen Erioderma pedicellatum (Hue) P. M. Jørg. (Pannariaceae) (Scheidegger Reference Scheidegger2003), are often thought to be facilitated by the partly shaded and humid environment created by old forests. Erioderma pedicellatum was first described by Hue in 1911 from New Brunswick, Canada (Jørgensen Reference Jørgensen2000), and was reported as new to Europe from Norway in 1938 and Sweden in 1941 (Ahlner Reference Ahlner1948). The known Norwegian population consisted of a small number of specimens only, whereas the population in Sweden was greater (Ahlner Reference Ahlner1948). Shortly afterwards the species was considered extinct due to logging in all known European sites (Ahlner Reference Ahlner, Magnusson and Curry-Lindahl1954; Jørgensen Reference Jørgensen1990) and had declined elsewhere (Scheidegger Reference Scheidegger2003). The decline has been related to land-use changes such as logging (Cameron et al. Reference Cameron, Neily and Clapp2013b; Tagirdzhanova et al. Reference Tagirdzhanova, Stepanchikova, Himelbrant, Vyatkina, Dyomina, Dirksen and Scheidegger2019) and air pollution (Richardson & Cameron Reference Richardson and Cameron2004), but wildfire (Tagirdzhanova et al. Reference Tagirdzhanova, Stepanchikova, Himelbrant, Vyatkina, Dyomina, Dirksen and Scheidegger2019) and gastropod grazing (Cameron Reference Cameron2009) are important local threats. After new populations in Alaska and Kamchatka were discovered, the situation improved, but was still considered critical (Cameron et al. Reference Cameron, Goudie and Richardson2013a; Stehn et al. Reference Stehn, Nelson, Roland and Jones2013; Holien Reference Holien2015; Tagirdzhanova et al. Reference Tagirdzhanova, Stepanchikova, Himelbrant, Vyatkina, Dyomina, Dirksen and Scheidegger2019). After being considered extinct for < 50 years in Europe, two thalli were found in the Norwegian boreal rainforest (Tønsberg et al. Reference Tønsberg, Gauslaa, Haugan, Holien and Timdal1996). Later, a population was discovered in a canyon in Rendalen, south-eastern Norway (Reiso & Hofton Reference Reiso and Hofton2006), estimated to host 1500–2000 thalli (Björn Nordén, personal communication); this therefore currently comprises the largest European E. pedicellatum population. This population on thin dead Picea abies branches produces a litter of healthy specimens (A. R. Nilsson, personal observation 2019, 2020) available for experiments.
Our overall aim was to use newly fallen thalli to gain basic ecophysiological knowledge about this rare species, which may improve the success of future reintroductions to new sites. Without new knowledge, effective conservation for this globally threatened lichen is challenging, and conservation management is left with few other options than creating nature reserves. More specifically, we aim to 1) report microclimate (light, temperature, relative humidity) and bark pH in the best European site for E. pedicellatum. Another aim is to 2) quantify basic hydration traits for Norwegian E. pedicellatum and to compare them with recently assessed traits for a population on slightly shaded trunks of Abies balsamea in Newfoundland rainforests (Gauslaa & Arsenault Reference Gauslaa and Arsenault2020). In the macro-climatically dry Norwegian site, it occurs on sun-exposed thin Picea abies branches enriched by humid air from a waterfall, a situation known to support oceanic lichens in inland sites (Björk et al. Reference Björk, Goward and Spribille2009). We hypothesize that the sun-exposed Norwegian population has a higher water holding capacity (WHC) to compensate for higher evaporative demands than the more protected Newfoundland population on trunks. Furthermore, because E. pedicellatum is restricted to humid or rainy sites, we aim to 3) quantify its desiccation and high light tolerance (Gauslaa et al. Reference Gauslaa, Coxson and Solhaug2012), since light in the dry state can be detrimental for poikilohydric organisms (as reviewed by Beckett et al. (Reference Beckett, Minibayeva, Solhaug and Roach2021)). The morphologically similar Pannariaceae species, Pectenia plumbea (Light.) P. M. Jørg. & P. James, was included to test the hypothesis that the rare E. pedicellatum is more intolerant to desiccation and light than the common P. plumbea. Since measurements of CO2 uptake along environmental gradients can identify optimal conditions for lichen growth, we finally aim to 4) quantify photosynthetic responses of E. pedicellatum to light, temperature and desiccation. We hypothesize that this boreal lichen is most efficient at low light and cool temperatures, and that its optimal water content for photosynthesis is close to the internal water holding capacity (WHCinternal) as shown for chloro- and cephalolichens (Solhaug et al. Reference Solhaug, Asplund and Gauslaa2021).
Materials and Methods
Field site
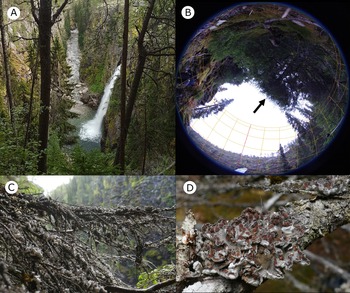
The best European E. pedicellatum site is in Rendalen (c. 61°52ʹN, 10°51ʹE, 460 m a.s.l., eastern part of southern Norway), c. 40 m from a 25 m tall waterfall in a small river. The catchment area for the waterfall is 89 km2, of which > 90% is situated above the timberline, creating a rather constant water flow in the growing season (Reiso & Hofton Reference Reiso and Hofton2006; NVE 2020). The macroclimate is slightly continental with precipitation c. 500 mm y−1. July and August receive most rain (Moen Reference Moen1999; NVE 2020). Normal annual temperature at the nearest meteorological station in Alvdal (28 km away) is 2.2 °C; −8 °C in December and 13.8 °C in July. The vegetation is middle boreal (Moen Reference Moen1999). From the waterfall, the canyon continues for 300 m before the landscape flattens (Fig. 1A). The canyon hosts some Picea abies, whereas Pinus sylvestris forms the open dry forest above the canyon. Erioderma pedicellatum grew only on thin, mainly dead branches (Fig. 1D) of some P. abies facing the waterfall up on the opposite side of the canyon, outside the waterfall spray zone during most of the year. The branches with most specimens were south-west-facing and sun-exposed (Fig. 1C).
A, canyon with the waterfall in Rendalen. The best site for Erioderma pedicellatum was on a cluster of small Picea abies on the steep, rocky SW-facing slope slightly downstream from the larger spruce trees seen to the left in the photograph. This cluster of trees faced, unobstructed, the waterfall on the opposite side of the canyon (photograph: Sigve Haugland). B, fisheye photograph, positioned horizontally, taken in October 2020 close to the SW-facing spruce branches with the densest population of E. pedicellatum. The upper part of the waterfall on the opposite side of the canyon can be seen in the lowermost part of the photograph close to the south direction. The dark cluster of dead, lichen-covered outer branches near the centre of the photograph (arrow) is where E. pedicellatum occurs most abundantly (see Fig. 1C). The gridlines show the annual sun tracks over the sky, dividing the year into 6 sectors and the day into 24 sectors (photograph: K. A. Solhaug). C, branches visible as the dark cluster facing the sky in Fig. 1B were totally dominated by E. pedicellatum, exposing their light lower side along marginal lobes. D, E. pedicellatum thallus showing the numerous brown apothecia (C & D photographs: Y. Gauslaa). In colour online.

Four small trees in one cluster hosted c. 90% of the E. pedicellatum population that dominated the epiphytic vegetation on the most sun-exposed branches. In addition, there were c. 10 nearby trees with some thalli on each. This strong spatial aggregation differs from its distribution pattern elsewhere (Cameron et al. Reference Cameron, Goudie and Richardson2013a; Stehn et al. Reference Stehn, Nelson, Roland and Jones2013; Holien Reference Holien2015; Tagirdzhanova et al. Reference Tagirdzhanova, Stepanchikova, Himelbrant, Vyatkina, Dyomina, Dirksen and Scheidegger2019). The lower part of the canyon represents a unique environment with epiphytes and microclimate resembling those in open patches of the Norwegian boreal rainforest (Holien & Tønsberg Reference Holien and Tønsberg1996), differing from the surrounding dry low-productive pine forest.
The spruce forest in the canyon is not old, but moss-loaded dwarf trees suppressed by excess humidity closer to the fall may have functioned as continuity carriers. The surrounding pine forest originated on former clear-cuts, and is aged < 100 y. Surrounding mountain ranges have protected the area against the most acidic rain; pH in the precipitation is c. 4.9 (Tørseth & Manø Reference Tørseth and Manø1996).
Lichen material
Healthy E. pedicellatum thalli found on dead, newly fallen branches on the ground were collected during visits (September 2019, April, May and October 2020, May 2021). For comparison, thalli of Pectenia plumbea were collected on Quercus petraea in Kristiansand (58°7ʹ50ʺN, 8°8ʹ7ʺE), southern Norway, in July 2020. After collection, lichens were air-dried at 20 °C and stored at −18 °C in the laboratory for 2–12 months, before experiments started. Lichen performance should not be affected by such treatment (Honegger Reference Honegger2003).
Microclimatic measurements
A hemispherical photograph (Fig. 1B) was taken in October 2020 close to the branches dominated by E. pedicellatum with a Pentax K-5II SLR camera using a Sigma 4.5 mm fisheye lens. The camera was placed horizontally with the true north direction indicated and positioned at a similar height above ground as the branches with most E. pedicellatum. The photograph was analyzed by Hemisfer v. 3.0 (www.schleppi.ch/patrick/hemisfer/) to estimate the duration of direct sunlight through the year under clear sky conditions.
Two HOBO Micro Station Data Loggers with a 12-bit Temperature/Relative Humidity Smart Sensor and a quantum sensor (model S-LIA-M003) monitored with HOBOware Pro v. 2.2.1 (Onset, Bourne, MA, USA) were installed for the 2020 growth season (18 April–4 October). Light, temperature and relative humidity were recorded every 5 min. One microclimate station was placed close to the main population (± 1 m), the other one next to a host tree (± 2 m) with only a couple of E. pedicellatum thalli, c. 50 m north-west of the main population, to differentiate between an optimal and suboptimal site. Both microclimate stations were placed c. 1 m above ground, and as close to the host trees as possible.
pH measurement
In May 2020, branches were collected from three categories of P. abies based on their epiphytic vegetation: 1) dominance of E. pedicellatum (n = 7); 2) dominance of other Lobarion species (cephalo- and cyanolichens; n = 10); 3) only chlorolichens in the Parmeliaceae (Parmelion; n = 10). Branches were brought to the laboratory and analyzed 2 d after collection. Each branch was cleaned (epiphytes removed), cut into a 6 cm long segment and put in a small glass vial with 6 ml 25 mM KCl and repeatedly shaken for 1.5 h. Thereafter, branches were removed and pH was measured in the solution with a calibrated pH-meter (see Gauslaa & Holien Reference Gauslaa and Holien1998).
Additionally, conductivity and pH were measured in six water samples from the waterfall. Conductivity was measured in the field with a portable conductivity meter (Mettler-Toledo International Ltd, Singapore), whereas the pH of water samples kept in closed bottles were measured in the laboratory within 24 h.
Hydration traits
A randomly selected batch of E. pedicellatum thalli was used to measure water holding capacity (WHC) and specific thallus mass (STM). First, air-dry mass (± 0.1 mg) was measured for lichens kept dry at 20 °C for 24 h. Then wet mass (WMshaking) was recorded by weighing sprayed and fully water-saturated thalli that had been gently shaken; and blotting mass (WMblotting) after removing surface water by gently blotting the lichens with filter paper. Each hydrated lichen was placed under a plate of glass to flatten it on a transilluminator to optimize the photographs (Pentax K-5II SLR camera with a Sigma 70 mm macro lens). We used ImageJ 1.48 (Rasband Reference Rasband2014) for calculating thallus area (A). Oven-dry mass (DM) was weighed in five additional thalli after 24 h drying at 70 °C, and the DM/air-dry mass-ratio was used to calculate DM for all experimental thalli. Specific thallus mass (STM = DM/A), total (WHCtotal = WHCshaking = (WMshaking − DM)/A), internal (WHCinternal = WHCblotting = (WMblotting − DM)/A) and external water holding capacity (WHCexternal = WHCshaking − WHCblotting) were computed.
Light and desiccation tolerance experiment
Randomly selected thalli were first acclimated in the moist state at low light (10–15 μmol photons m−2 s−1 from white fluorescent bulbs) for 24 h. When air-dry, five E. pedicellatum and four P. plumbea thalli were randomly placed on nets above saturated salt solutions (Greenspan Reference Greenspan1977) inside each of 16 boxes sealed with cling film across four relative humidity levels (0% [silica gel], 35% [MgCl2], 55% [Mg(NO3)2], 75% [NaCl]) and two light treatments (0 and 200 μmol photons m−2 s−1 of equal levels of red, blue and green light from an SL-3500 LED panel). Each of the eight combinations of humidity and light was thus replicated in two boxes (see Gauslaa et al. Reference Gauslaa, Coxson and Solhaug2012). The number of replicates for each of the eight treatments was 10 for E. pedicellatum and 8 for P. plumbea. Boxes were rotated daily to reduce the effects of small heterogeneities in light. On the 7th day, lichens were removed from the sealed boxes, hydrated, and placed under low light (10 μmol photons m−2 s−1 from white fluorescent bulbs). Recovery kinetics of maximal PSII efficiency (F v/F m) was measured at 15 °C after 0.5 h, 2 h, 6 h, 24 h and 48 h using ImagingPam (red-LED IMAGING-PAM M-series, Walz Effeltrich, Germany).
Photosynthetic responses to light and temperature
All measurements of photosynthetic CO2 uptake in this paper used a portable infrared gas-analyzer (LI-6400XT, LiCor, Lincoln, NE, USA) with a LiCor 6400-24 bryophyte chamber and a LI-6400-18 RGB LED light source. Light response curves for six thalli were recorded at 10 and 20 °C with white light (equal amounts of red, green and blue light) and 410 ppm CO2 and analyzed using Photosyn Assistant v. 1.1 (Parsons and Ogston, Dundee Scientific, Dundee, UK). To keep the humidity inside the cuvette at c. 70%, all water was removed from the incoming air when measuring large thalli. Before measuring light response curves, thalli were lightly blotted with drying paper to remove external water. After inserting a thallus into the cuvette, the first measurement was taken when photosynthesis was stable at 800 μmol photons m−2 s−1. The light was then reduced to 400, 200, 100, 50, 25 and 0 μmol photons m−2 s−1 in 2-min steps and CO2 uptake was recorded at the end of each step. For each measurement, we checked that lichens had an optimal water content for photosynthesis (Solhaug et al. Reference Solhaug, Asplund and Gauslaa2021) during the entire light response curve.
To quantify temperature responses, CO2 uptake was measured in 15 thalli at 5, 10, 15, 20 and 25 °C, respectively, at 410 ppm CO2 and 400 μmol photons m−2 s−1 red light, after removing external water by blotting. Firstly, moist lichens were acclimated to the selected temperature for 24 h at 10 μmol photons m−2 s−1, completing all measurements at one temperature in one day. Afterwards, lichens were acclimated for another 24 h at the next temperature before measurements at the second temperature, and likewise for each of the remaining temperatures.
CO2 uptake during desiccation cycles
Eighteen thalli were hydrated before their area was recorded with a leaf area meter (Li-3100 Area Meter, Li-cor, Lincoln, NE, USA). One by one, they were placed in the gas analyzer cuvette while fully water-saturated (WMshaking, corresponding to WHCtotal), at 410 ppm CO2, 400 μmol photons m−2 s−1 red light, and 20 °C. The thallus was taken out for weighing every 5 min until the lichen became air-dry and inactive.
Statistical analyses
Data were log-transformed to meet test assumptions when needed. Simple linear regressions tested the relationships between hydration traits of interest and surveyed relationships of interest in the desiccation experiment. Paired t-tests were conducted to test differences between parameters of interest for the microclimatic data.
One-way ANOVAs investigated differences between the categories for bark pH measurements and for CO2 uptake at different temperatures, combined with post-hoc analyses. Thalli were tested for as a random effect when the same thalli were repeatedly measured during an experiment, by using linear mixed models where assumptions were met.
In the light and desiccation tolerance experiment, a three-way linear mixed model was run for F v/F m after 48 h recovery with species, light and relative humidity as fixed factors, and box (i.e. the container that the samples were in) as a random factor. Assumptions for the model were met.
A small number of specimens of E. pedicellatum were excluded as outliers from some analyses due to very low responses, or errors during measurements with the gas analyzer. Since all specimens of E. pedicellatum were collected from fallen branches, it was expected that some individuals could be impaired by low vitality. Means ± 1 SE are given in the text. Statistical analyses were run using Jamovi v. 1.2 (www.jamovi.org/).
Results
Microclimate
The estimated daily direct sunlight on clear days lasted continuously for > 5 h around noon from early April to late August (Fig. 2). From late October to early March, lichens received no direct sunlight due to shading landscape elements. The largest European Erioderma pedicellatum population thus experienced much direct sunlight in summer and a total lack of sun exposure in winter.
Annual course of estimated duration of direct sunlight (minutes per day) near the Picea abies branches with the highest dominance of Erioderma pedicellatum, assuming clear sky conditions. Data were estimated from the hemispherical photograph in Fig. 1B using Hemisfer v. 3.0 (www.schleppi.ch/patrick/hemisfer/).

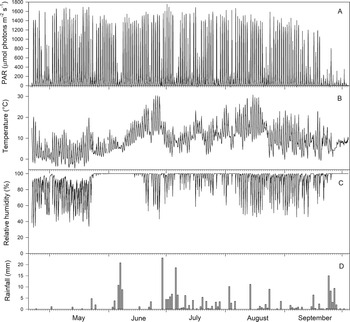
The relative humidity (RH) reached 100% almost every night between 24 May–4 October (Fig. 3C). Before 24 May, when nocturnal temperature often dropped below 0 °C and minimized snow melt (Fig. 3B) (and thus the flow rate in the river), RH never reached 100%. From 24 May to 19 June, RH was 100% day and night (Fig. 3C), but after 19 June higher air temperatures reduced RH during the daytime. Overcast and rainy days (Fig. 3D) with little light and small diurnal temperature amplitudes were associated with only minor daily reductions in RH. This was clearest during late September/early October before measurements ended (Fig. 3). High light (> 1500 μmol photons m−2 s−1) frequently occurred between April–August (Fig. 3A).
Microclimate measurements from the Erioderma pedicellatum site in Rendalen, Norway. A, photosynthetic active radiation (PAR). B, air temperature (°C). C, relative humidity (RH%). PAR and temperature were recorded for the main population, RH data were from the suboptimal population due to a longer period of missing data for the main population. D, rainfall (mm) records from the Alvdal meteorological station. All recordings started 18 April 2020 and ended 4 October 2020.

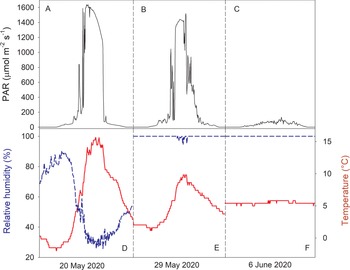
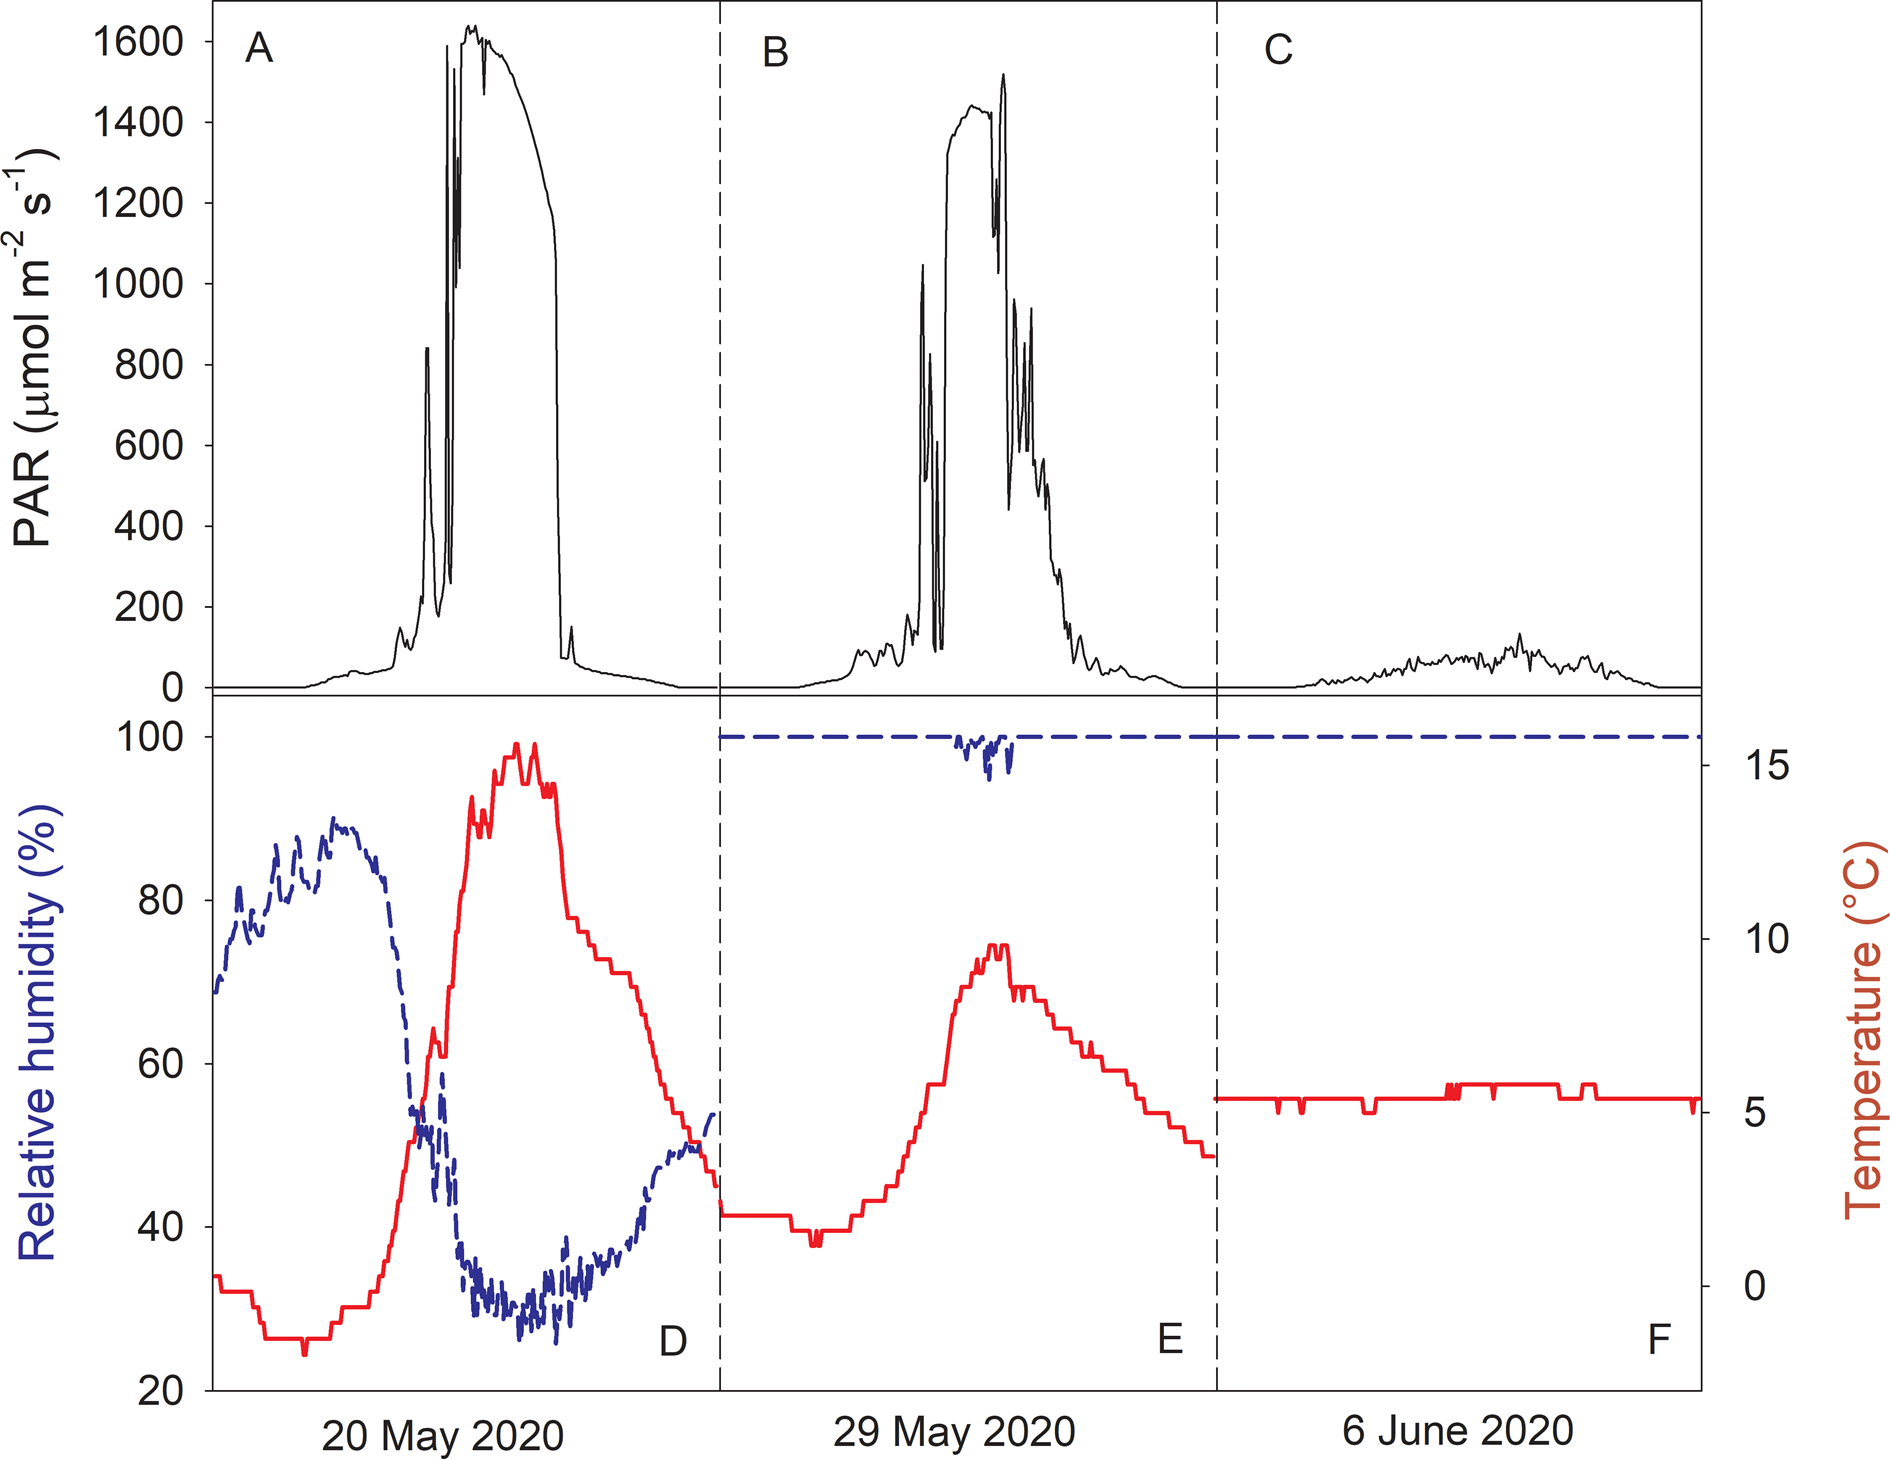
Strong links between light, air temperature and RH occurred on sunny days (e.g. 20 May; Fig. 4A & D). While RH gradually increased at night, increasing solar radiation in the morning heated the air with a rapid and strong concurrent decline in RH. However, after the marked seasonal shift in RH from 24 May (Fig. 3C), RH was rather unaffected by increases in light and temperature on clear days (Fig. 4B & E). On cloudy and rainy days, light hardly exceeded 100 μmol photons m−2 s−1 (Fig. 4C), with no diurnal variation in RH and air temperature (Fig. 4F).
A–C, diurnal variation in photosynthetic active radiation (PAR). D–F, relative humidity (RH%, dashed line) and temperature (°C, solid line). Data show three selected days with different weather conditions (see text). All data were from the microclimate station at the site of the main population. In colour online.
The optimal site had higher mean light (167 ± 2 vs 136 ± 1 μmol photons m−2 s−1, P < 0.001) and temperature (9.21 ± 0.03 vs 8.67 ± 0.02 °C, P < 0.001) than the suboptimal site, but lower RH (85.3 ± 0.1 vs 92.2 ± 0.1%, P < 0.001).
Bark pH
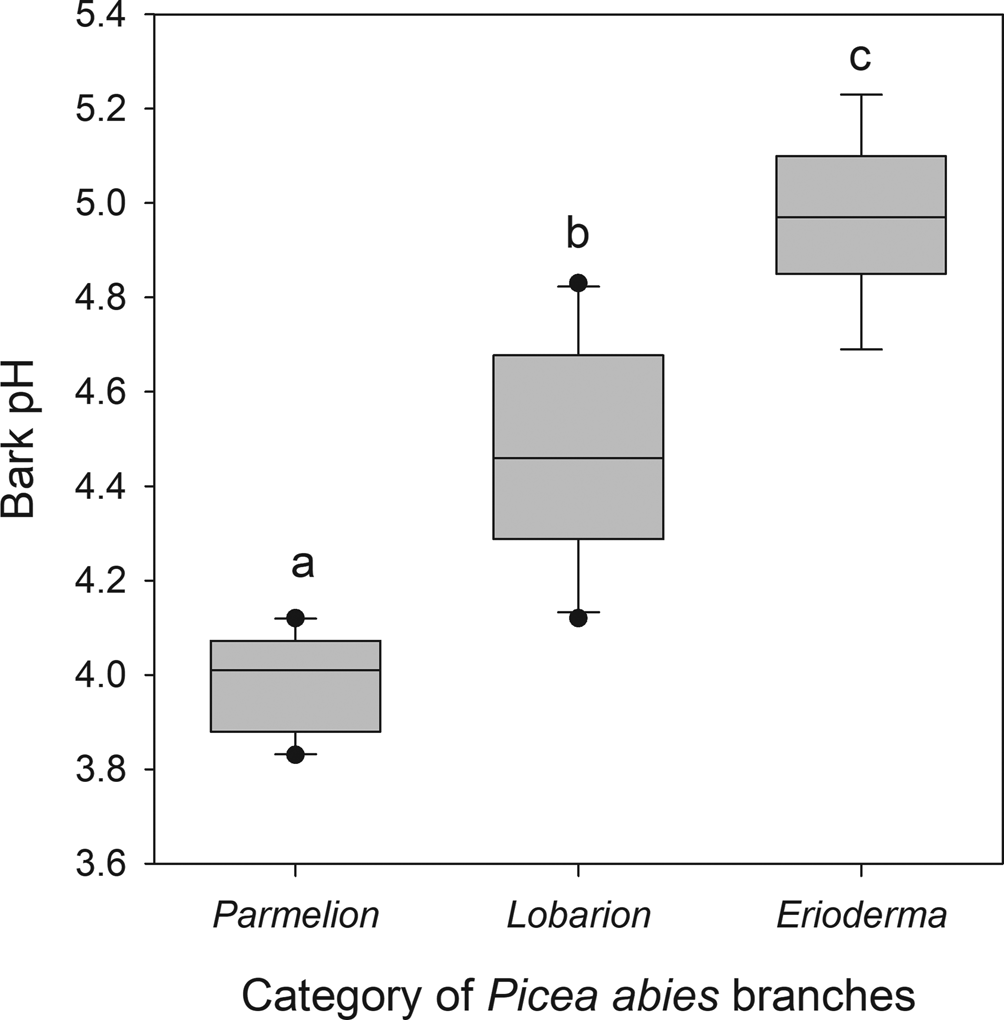
Bark pH differed significantly between sampled categories of Picea abies branches (P < 0.001; Fig. 5). Branches with chlorolichens (Parmelion) were acidic (pH = 3.98 ± 0.11), followed by the less acidic Lobarion branches with Lobaria and Nephroma species but without E. pedicellatum (pH = 4.48 ± 0.23), whereas branches with a dominance of E. pedicellatum had the least acidic bark (pH = 4.98 ± 0.18).
Boxplot of bark pH in three categories of Picea abies branches classified due to their epiphytic vegetation: 1) Parmelion dominated by chlorolichens in the Parmeliaceae (n = 10); 2) Lobarion dominated by cyano- and cephalolichens other than Erioderma pedicellatum (n = 10); 3) Erioderma, epiphytic vegetation dominated by E. pedicellatum (n = 7). Means with different letters significantly differed at P < 0.05 (Tukey HSD test); the one-way ANOVA showed a significant difference, r 2adj = 0.829, P < 0.001.
The water in the waterfall had a pH of 7.3 and a conductivity of 8.3 μS cm−1.
Hydration traits
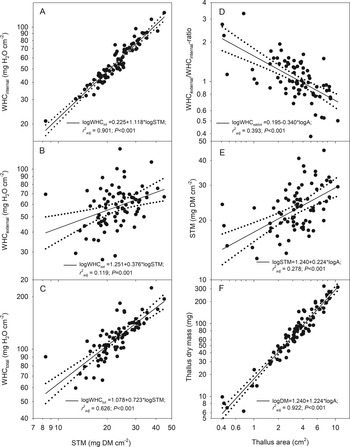
Mean specific thallus mass (STM), a proxy of thallus thickness, of E. pedicellatum was 23.6 ± 0.8 mg cm−2. Internal (WHCinternal = 58.1 ± 2.3 mg H2O cm−2), external (WHCexternal = 60.1 ± 2.1), and total water holding capacity (WHCtotal = 118.2 ± 3.5) were highly significantly correlated to STM (Fig. 6A–C); the strongest regression was found for WHCinternal, the weakest for WHCexternal. The thicker the thallus, the more water it held. Thallus dry mass (DM) was strongly related to thallus size (0.4–10.7 cm2; Fig. 6F). WHCexternal/WHCinternal-ratio (0.4–3.3) decreased with size (Fig. 6D), whereas STM, a proxy of thallus thickness, increased (Fig. 6E). Due to the connection between WHC and STM, WHCinternal and WHCtotal were also strongly size-dependent.
Relationships between measures of water holding capacity (A, WHCinternal; B, WHCexternal; C, WHCtotal versus specific thallus mass (STM)) and the size-dependency of WHCexternal/WHCinternal (D), STM (E), and thallus dry mass (F) in Erioderma pedicellatum. All axes are log-transformed. Regression equations (solid lines) with corresponding r 2adj and P-level are given. Dotted lines indicate 95% confidence intervals.

Desiccation and light tolerance
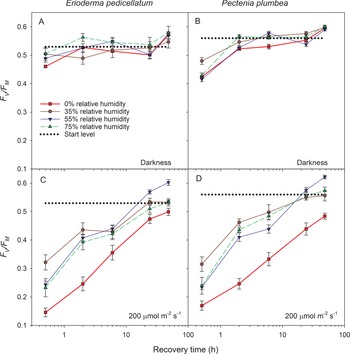
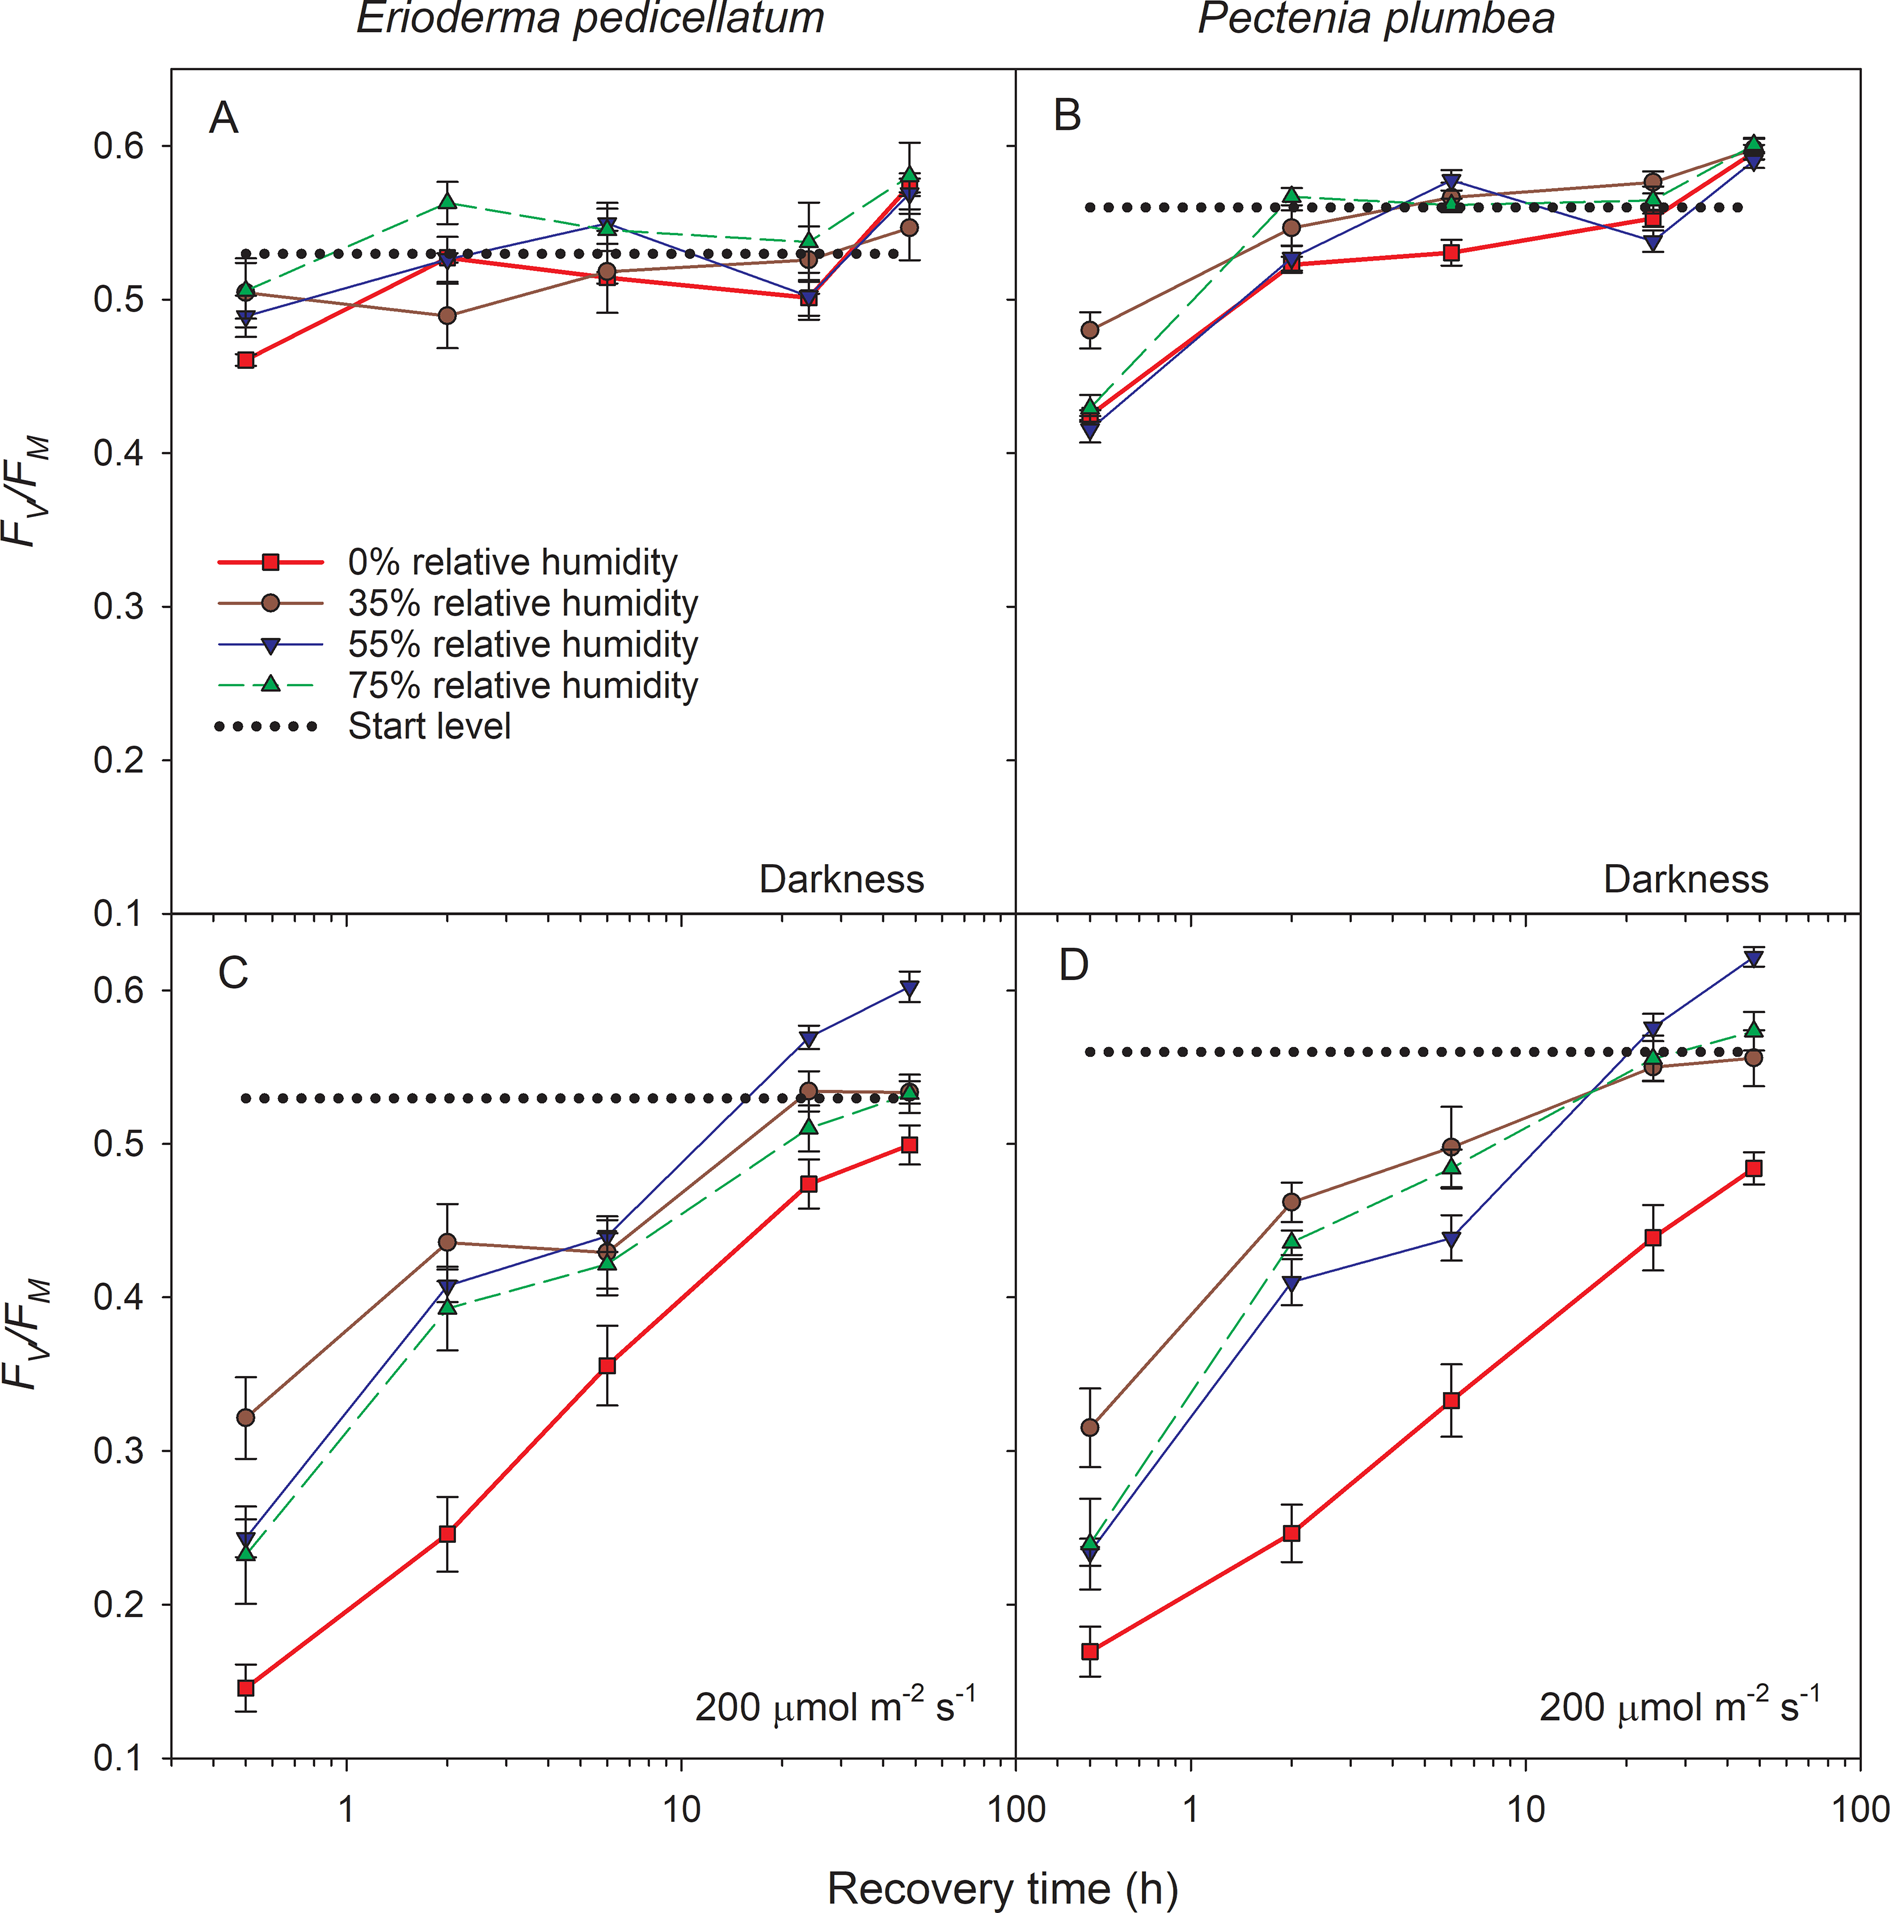
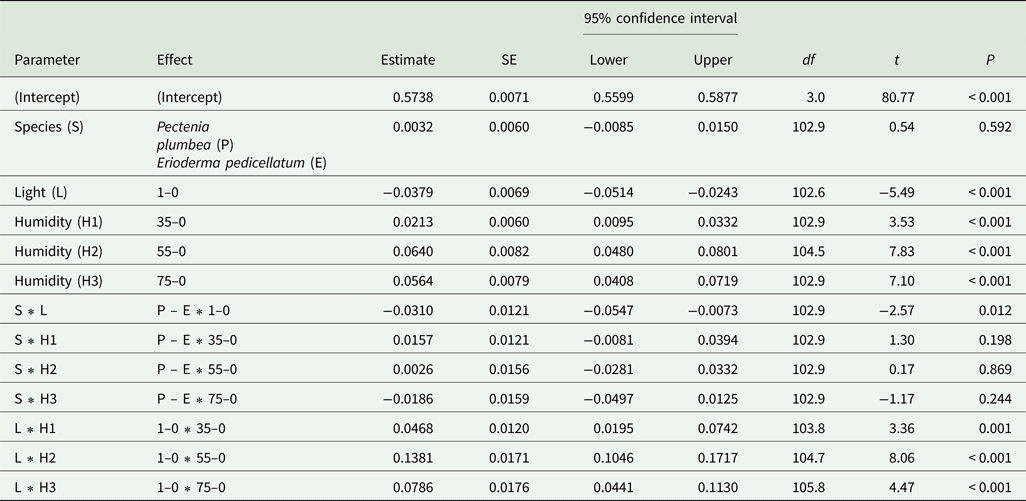
Before the start of the experiment, F v/F m (dotted lines in Fig. 7) was higher in Pectenia plumbea than in E. pedicellatum (P < 0.001, one-way ANOVA). After the desiccation treatment in darkness, the subsequent hydration caused rapid recovery of F v/F m to the starting values in both species, although P. plumbea initially responded more slowly than E. pedicellatum (Fig. 7A & B). The medium light used during desiccation severely aggravated the photoinhibition, evidenced by the strong depression in F v/F m and delayed recovery of both species (Fig. 7C & D). F v/F m after 48 h recovery, representing more lasting effects, was analyzed in a linear mixed model (Table 1; with estimates of fixed parameters given in Table 2). Box (i.e. sample container) was tested for as a random effect, and the full model including fixed and random factors accounted for slightly higher variation in F v/F m (r 2conditional = 0.759) than the fixed factors alone (r 2marginal = 0.694; Table 1). Nevertheless, after 48 h recovery, both light and humidity highly significantly affected F v/F m. The two species did not differ, but there was a weakly significant species × light interaction (P = 0.012; Table 1), implying a slightly stronger adverse effect of light in P. plumbea. The highly significant light × humidity interaction occurred because the hardest desiccation (0% relative humidity) had a much stronger impact in light than in darkness (Fig. 7, Table 1).
Maximal PSII efficiency (F v/F m) kinetics during recovery (h) after 7 d exposure to four levels of relative humidity and two light levels (0 and 200 μmol photons m−2 s−1). Dotted lines represent the mean start level. Vertical bars indicate ± 1 standard error; Erioderma pedicellatum n = 10, Pectenia plumbea n = 8. In colour online.
Fixed effect omnibus tests computed by the linear mixed model for maximal PSII efficiency (F v/F m) measured after 48 h recovery in Erioderma pedicellatum and Pectenia plumbea after exposure to two light treatments (0 and 200 μmol photons m−2 s−1) and four relative humidity treatments (0, 35, 55 and 75%). Box, that is containers of subsets of thalli during exposure, was treated as a random factor. Original data shown in Fig. 7.

The full model including fixed and random factors accounted for slightly higher variation in F v/F m (r 2conditional = 0.759) than the fixed factors alone (r 2marginal = 0.694). The non-significant 3-way interaction was excluded. Three extreme outliers had been removed (standard residuals higher than 4.0 or lower than −4.0). Note: Satterthwaite method for degrees of freedom (the df column is as follows: df of the factor, df of the error).
Fixed effects parameter estimates computed by the linear mixed model for maximal PSII efficiency (F v/F m) given in Table 1 for Erioderma pedicellatum and Pectenia plumbea after exposure to two light treatments, 0 (L0) and 200 μmol photons m−2 s−1 (L1) and four relative humidity treatments (H; 0, 35, 55 and 75%).
Photosynthetic responses to light and temperature
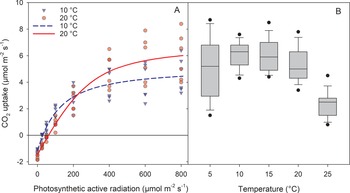
The CO2 uptake for E. pedicellatum was high and became light saturated at 400 (10 °C) and 600 μmol photons m−2 s−1 (20 °C; Fig. 8A). The light compensation point was 28 ± 3 and 63 ± 9 μmol photons m−2 s−1, and dark respiration was 1.14 ± 0.08 and 1.49 ± 0.08 μmol CO2 m−2 s−1 at 10 and 20 °C, respectively. There was no significant relationship between CO2 uptake and thallus area (4.45–12.5 cm2). According to a repeated measures ANOVA (data not shown), temperature alone did not affect the CO2 uptake. However, light and the light × temperature interaction were highly significant, as was the random factor thallus ID.
A, light response curve of CO2 uptake (μmol CO2 m−2 s−1) at 10 and 20 °C and at increasing light levels (μmol photons m−2 s−1) in six thalli of Erioderma pedicellatum. The lines represent mean CO2 uptake at the two respective temperatures. Curves are estimated using Photosyn Assistant v. 1.1 (Parsons and Ogston, Dundee Scientific, Dundee, UK). Darker symbols represent overlapping values for more than one specimen. B, CO2 uptake response to temperature treatments at 410 ppm CO2 and 400 μmol photons m−2 s−1. Only the mean at 25 °C significantly differed from the other means (P < 0.05; Tukey HSD test). n = 15, except for the 5 °C group (n = 13). In colour online.

Erioderma pedicellatum had a broad temperature optimum for photosynthesis (Fig. 8B). Only at 25 °C was the CO2 uptake significantly lower than at other studied temperatures. At 5 °C, differences between individual responses were large, even after removing two outliers. As the same thalli were measured at all temperatures, thallus ID was included as a random factor (P = 0.021) in a mixed effects model with temperature as a fixed factor (r 2adj = 0.707, P < 0.001).
CO2 uptake during desiccation cycles
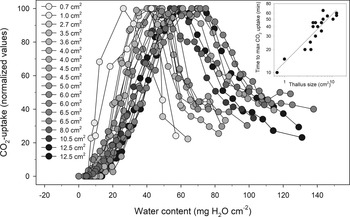
The desiccation cycles (Fig. 9) started at a hydration level of 98.5 ± 7.0 mg H2O cm−2, slightly below WHCtotal, implying substantial amounts of external water. At this stage, the CO2 uptake was depressed to 35 ± 2% (total range 22–49%) of maximal levels. Optimal photosynthesis occurred at a water content of 51.3 ± 3.1 mg H2O cm−2 (≈ WHCinternal, or at 280% water) that was reached after 39 ± 4 min of desiccation. The rather narrow phase of optimal water content peaked at slightly lower water contents than WHCinternal. The desiccation time needed for a fully saturated thallus to reach the optimal water content per thallus area (WCA) for photosynthesis strongly increased with thallus size (Fig. 9, insert; r 2adj = 0.815, P < 0.001), indirectly evidenced by a shift of the curves (Fig. 9) to higher water contents from smaller to larger thalli. There was also a highly significant positive regression between the WHCinternal and the optimal area-based water content for photosynthesis (WCA = 17.169 + 0.499 * WHCinternal; r 2adj = 0.648, P < 0.001). After maximal photosynthesis, CO2 uptake rapidly declined with decreasing water content. When lichens had reached a water content of 7.9 ± 0.8 mg H2O cm−2 (corresponding to 66 ± 5%), CO2 uptake was no longer measurable, and individual curves converged (Fig. 9) after a slower decline in CO2 uptake in larger than in smaller thalli.
CO2 uptake (normalized values) versus water content per thallus area during desiccation cycles for 18 thalli of Erioderma pedicellatum, starting with shaken wet thalli. Insert: the relationship between thallus size and the time needed for a fully saturated thallus to reach the hydration that provides maximal CO2 uptake rate; log(time) = 1.132 + 0.628 × log(thallus area); r 2adj = 0.815, P < 0.001.

Discussion
Microclimate
Studied canopies dominated by Erioderma pedicellatum occurred in a unique habitat that combined strong solar radiation with high humidity after vernal snow melt raised the waterfall flow rate. This microclimatic shift ended the early dry spring during which ground inhabiting bryophytes were often dry, even in the morning. The following long period with c. 100% RH even during sunny days probably occurred because the higher water flow formed aerosols that crossed the canyon and partly reached the cluster of small trees with E. pedicellatum up on the steep slope opposite the waterfall. When the snow later disappeared, RH during the daytime declined on clear days and became more driven by solar radiation and temperature. However, the water flow appeared sufficient to saturate the air humidity almost every night and kept RH during the day higher in summer than in spring.
The higher humidity at the suboptimal compared to the optimal site suggests that water can be too much, even for hygrophilous cyanolichens, consistent with the observed bryophyte dominance on trees within the waterfall spray zone and with data showing that river regulations reducing the discharge of water can result in a great decrease in hygrophilous bryophytes and an increase in lichens (Odland et al. Reference Odland, Birks, Botnen, Tønsberg and Vevle1991). It is also consistent with the strong suprasaturation depression in E. pedicellatum (Fig. 9). The higher light at the optimal site probably improves CO2 uptake by reducing external water and enables high photosynthetic rates in a species with high light compensation point and light saturation (Fig. 8A). The higher mean temperature at the optimal site during the growth season is closer to the presented temperature optimum for carbon gain in E. pedicellatum (c. 10–15 °C) than the temperature at the suboptimal site.
Bark pH
Erioderma pedicellatum grew on branches with higher bark pH (4.98 ± 0.18) than usual for P. abies (pH = 3.9–4.2; Gauslaa & Holien Reference Gauslaa and Holien1998). Conifer bark has been considered too acidic for Lobarion in parts of Europe previously influenced by acid rain (Rose Reference Rose1988). Lobarion grows on P. abies branches with higher pH than does Parmelion, a ubiquitous epiphytic community dominated by members of the Parmeliaceae, as shown in Norway (Gauslaa & Holien Reference Gauslaa and Holien1998) and British Columbia (Gauslaa & Goward Reference Gauslaa and Goward2012; Gauslaa et al. Reference Gauslaa, Goward and Pypker2020). More specifically, bark supporting the Lobarion community is higher in base cations (Ca, Mg, K) and lower in Mn (Hauck & Spribille Reference Hauck and Spribille2002; Gauslaa et al. Reference Gauslaa, Goward and Asplund2021), and local factors such as soil pH and dripzones from some tree species can modify the bark pH of P. abies (Gauslaa & Holien Reference Gauslaa and Holien1998; Goward & Arsenault Reference Goward and Arsenault2000; Gauslaa et al. Reference Gauslaa, Goward and Pypker2020). Faster growth in Lobarion species is associated with higher bark pH and base-cation availability (Gauslaa & Goward Reference Gauslaa and Goward2012, Reference Gauslaa and Goward2020; Bidussi et al. Reference Bidussi, Goward and Gauslaa2013b). Larsen & Rasmussen (Reference Larsen and Rasmussen2021) recently showed the importance of high bark pH for ascospore germination in the sexually reproducing Xanthoria parietina, which may also be the case for E. pedicellatum spores (Cornejo et al. Reference Cornejo, Nelson, Stepanchikova, Himelbrant, Jørgensen and Scheidegger2016).
In Europe, E. pedicellatum was first found in boreal rainforests (Ahlner Reference Ahlner1948) little affected by acidification, with a rainfall pH of 5.2 (Tørseth & Manø Reference Tørseth and Manø1996). In North America, air pollution is considered a threat to E. pedicellatum (Richardson & Cameron Reference Richardson and Cameron2004; Cameron et al. Reference Cameron, Goudie and Richardson2013a). In the past, acid rain threatened Lobarion communities by substantially reducing bark pH (Gauslaa Reference Gauslaa1995), and it has probably reduced suitable habitats for E. pedicellatum by depleting soils of cations, implying that bark and soil pH do not easily recover to preindustrial levels (Falkengren-Grerup Reference Falkengren-Grerup1986; Nilsson & Tyler Reference Nilsson and Tyler1995). Measured pH of E. pedicellatum branches (4.98) corresponds to the present rainfall pH (4.9) in Rendalen (Tørseth & Manø Reference Tørseth and Manø1996).
It is not clear why epiphytic vegetation and associated bark pH varied within the site. Tree species associated with high bark pH were absent, such as Populus tremula, which could have enriched the local canopy throughfall in base cations (Goward & Arsenault Reference Goward and Arsenault2000; Gauslaa et al. Reference Gauslaa, Goward and Pypker2020). Bark pH was possibly enriched by aerosols from the waterfall (pH = 7.3). However, the low conductivity in the river suggests low buffering capacity, and Lobarion branches on mossy trees in the waterfall spray zone had lower pH than host trees of E. pedicellatum. Local soil chemistry is important (Gauslaa et al. Reference Gauslaa, Goward and Asplund2021); the steep rock shelf with the best host trees is likely to be a source of newly weathered minerals and temporarily upwelling groundwater.
Hydration traits
The strong regression between WHCinternal versus STM confirms that thicker thalli hold more water as in other cyanolichens (Gauslaa & Solhaug Reference Gauslaa and Solhaug1998; Gauslaa & Coxson Reference Gauslaa and Coxson2011; Gauslaa & Arsenault Reference Gauslaa and Arsenault2020). The positive relationship between STM and size implies that growth and aging lead to increased thickness. Because STM is a strong predictor of WHCinternal in lichens with a given photobiont group (Gauslaa & Coxson Reference Gauslaa and Coxson2011), STM can be used to compare hydration traits among cyanolichens. A comparison of our size-dependent data for E. pedicellatum with those from Newfoundland (Gauslaa & Arsenault Reference Gauslaa and Arsenault2020) showed that our population had significantly higher STM (Fig. 10) and thus thicker thalli across all thallus sizes, evidenced by the non-overlapping 95% confidence intervals. The mean STM of Norwegian E. pedicellatum (23.6 ± 1.8 mg cm−2) was 1.5 times higher than the values from Newfoundland (Gauslaa & Arsenault Reference Gauslaa and Arsenault2020), despite the slightly smaller mean thallus sizes in Rendalen. The STM of the Norwegian E. pedicellatum population was as high as that of Pectenia plumbea (Gauslaa & Solhaug Reference Gauslaa and Solhaug1998), evidenced by overlapping 95% confidence intervals for regression lines for STM versus area (data not shown). The Pannariaceae species (Erioderma, Pectenia) studied here have thereby significantly higher STM and thus higher water storage than previously examined cyanolichen members (Lobaria scrobiculata, Pseudocyphellaria citrina) of the Lobariaceae (Merinero et al. Reference Merinero, Hilmo and Gauslaa2014).
The relationship between specific thallus mass (STM) and thallus area in Erioderma pedicellatum from Newfoundland (log(STM) = 1.010 + 0.3519 × log(area); r 2adj = 0.806, P < 0.001; Gauslaa & Arsenault Reference Gauslaa and Arsenault2020) and Norway (log(STM) = 1.240 + 0.224 × log(area); r 2adj = 0.278, P < 0.001), respectively. Solid lines show regressions and dotted lines indicate 95% confidence intervals.

Erioderma pedicellatum in Rendalen exclusively dominated branches (Reiso & Hofton Reference Reiso and Hofton2006; Holien Reference Holien2015) facing the sun in summer. With such high evaporative demands, dry mass should increase more than area (Bidussi et al. Reference Bidussi, Gauslaa and Solhaug2013a; Alam et al. Reference Alam, Gauslaa and Solhaug2015). By contrast, specimens on vertical trunks beneath a protecting canopy in Atlantic Canadian rainforests with frequent rain (Gauslaa & Arsenault Reference Gauslaa and Arsenault2020) probably experience longer periods with full turgor pressure that would promote hyphal elongation and thus area expansion. The high STM and corresponding WHCinternal in the sun-exposed habitat can be considered an acclimation to maximize water storage and thus prolong hydration in sunny places, consistent with findings from the chlorolichen Ramalina capitata (Pintado et al. Reference Pintado, Valladares and Sancho1997).
Cyanolichens depend on liquid water for activation of photosynthesis (Lange & Kilian Reference Lange and Kilian1985; Lange et al. Reference Lange, Kilian and Ziegler1986). Nevertheless, continuous humid air over consecutive days slowly activates cyanolichen photosynthesis (Schlensog et al. Reference Schlensog, Schroeter and Green2000). Such conditions rarely occur in the field because drying normally occurs during a day without rain. Therefore, Schlensog et al. (Reference Schlensog, Schroeter and Green2000) did not question the dependency of cyanolichens on liquid water as a general statement. However, the unique Rendalen habitat probably has sufficiently long humid periods to allow cyanolichen activation in humid air.
Desiccation and light tolerance
High light is an important stressor in many lichens, as reviewed by Beckett et al. (Reference Beckett, Minibayeva, Solhaug and Roach2021). Many lichens with green algae (cephalo- and chlorolichens) rapidly activate in humid air (Phinney et al. Reference Phinney, Solhaug and Gauslaa2018; Ås Hovind et al. Reference Ås Hovind, Phinney and Gauslaa2020) and are susceptible to longer exposures to high light when desiccated (Gauslaa & Solhaug Reference Gauslaa and Solhaug1996; Färber et al. Reference Färber, Solhaug, Esseen, Bilger and Gauslaa2014). Severe photoinhibition in light is often avoided in nature by cephalo- and chlorolichens because such lichens activate every humid morning (Lange Reference Lange2003) when they can repair photoinhibitory damage that otherwise would accumulate. By contrast, cyanolichens tolerate a long-lasting combination of light and desiccation (Gauslaa et al. Reference Gauslaa, Coxson and Solhaug2012), which is required due to their dependency on rarer occurrences of rain for activation (Lange et al. Reference Lange, Kilian and Ziegler1986). The rare E. pedicellatum seems to be no exception and follows other high light and desiccation tolerant old-forest cyanolichens such as Lobaria scrobiculata, L. hallii, L. anomala and L. retigera (Gauslaa et al. Reference Gauslaa, Coxson and Solhaug2012). In contrast to our hypothesis, it even has a slightly higher tolerance to light and desiccation than the more common P. plumbea. The dry and sunny spring before snow melt starts lasted longer than the seven days used in our experiment, and certainly implies a need for high light and desiccation tolerance.
In winter, E. pedicellatum was continuously shaded from direct sun, which may be important for reducing the potential of accumulation of reactive oxygen species during conditions with low photosynthesis due to desiccation or too low temperatures (Kranner et al. Reference Kranner, Beckett, Hochman and Nash2008; Beckett et al. Reference Beckett, Minibayeva, Solhaug and Roach2021).
Photosynthetic responses to light and temperature
Erioderma pedicellatum has a broad optimum for carbon gain (5–20 °C), but a high light compensation point (28 and 63 μmol photons m−2 s−1 at 10 and 20 °C, respectively). These high values, consistent with a Q10 for respiration of c. 2 (for example, see Lambers & Oliveira Reference Lambers and Oliveira2019), imply that the species is poorly adapted to shaded environments, in which respiration may consume much of the gained C. The clear reduction in light compensation at low temperatures probably contributes to its strong association with cool forests, consistent with its boreal distribution (Cameron et al. Reference Cameron, Goudie and Richardson2013a; Stehn et al. Reference Stehn, Nelson, Roland and Jones2013; Holien Reference Holien2015; Tagirdzhanova et al. Reference Tagirdzhanova, Stepanchikova, Himelbrant, Vyatkina, Dyomina, Dirksen and Scheidegger2019) and with a recorded mean temperature of 9.2 °C in Rendalen in the main growing season from late April to early October.
CO2 uptake during desiccation cycles
Like other rainforest lichens (Lange et al. Reference Lange, Büdel, Heber, Meyer, Zellner and Green1993), E. pedicellatum suffered substantially from suprasaturation when water-saturated, although not as severely as P. plumbea that had no net photosynthesis at maximal hydration (Gauslaa & Solhaug Reference Gauslaa and Solhaug1998). At high levels of water content, the CO2 uptake of E. pedicellatum was 1/3 of maximal rates, attributed to blockage of CO2 diffusive pathways by excess water (Lange et al. Reference Lange, Green, Reichenberger and Meyer1996). Long-lasting excess hydration could be disadvantageous for E. pedicellatum, consistent with the sparser population at the wetter (suboptimal) site and the total lack of E. pedicellatum in trees within the main waterfall spray zone. Nevertheless, E. pedicellatum, unlike P. plumbea, had a positive CO2 uptake when fully water-saturated, so it should not experience carbon loss when fully water-saturated in situ. Its optimal water content for CO2 uptake (c. 280%) was higher than in P. plumbea (200%; Gauslaa & Solhaug Reference Gauslaa and Solhaug1998). There seems to be large internal population dynamics with new regeneration and simultaneous loss of broken branches with E. pedicellatum. The growth rate of E. pedicellatum is therefore likely to be high, suggesting that there are long hydration periods without suprasaturation.
Maximum photosynthesis in E. pedicellatum occurs at a WCA ≈ WHCinternal, consistent with documented patterns in chloro- and cephalolichens (Solhaug et al. Reference Solhaug, Asplund and Gauslaa2021), and probably represents a general pattern in foliose lichens. Thalli with large WHCinternal thus need more water to reach maximum photosynthesis, implying a trade-off between robust thalli with large WHC versus small flexible thalli with low WHCinternal.
Conclusion
Even with access to only a restricted number of experimental thalli, this study has provided new and important knowledge about the threatened Erioderma pedicellatum. The studied Norwegian E. pedicellatum population on sun-exposed branches has higher WHC and STM than rainforest populations on trunks in Newfoundland, emphasizing the acclimation potential. The species not only depends on high light, high relative humidity and cool temperatures, but also tolerates well a rather extreme combination of desiccation and light. Since it also grows on P. abies branches with exceptionally high bark pH for this tree species, considerations of various unrelated habitat characteristics are important in management plans. CO2 uptake was high, consistent with fast growth and pioneer-like occurrences on outer fragile portions of thin and dead spruce branches. The unusual combination of habitat characteristics may explain the rareness of the species despite its flexible hydration traits. The new knowledge gained, in combination with that established previously, should form a basis for successful conservation and for selecting suitable habitat for restauration and reintroduction by transplantation to secure the future survival of this critically endangered lichen.
Author ORCIDs
Alexander R. Nilsson, 0000-0001-9282-8427; Knut Asbjørn Solhaug, 0000-0003-3368-5205; Yngvar Gauslaa, 0000-0003-2630-9682.
Competing Interests
The authors declare none.