1 Introduction
At the beginning of this century, pension funds in the Netherlands were hit by a fall in assets due to a sharp decline in equity markets and an increase in the value of liabilities due to a drop in interest rates to historically low levels (Boeri et al., Reference Boeri, Bovenberg, Coeuré and Roberts2006) As a result, funding ratios fell sharply. In addition, Dutch pension plans adopted a new accounting method using ‘fair-value’ principles that has had the effect of making underfunding problems more visible. In reaction to the sharp drop in pension funding, the Dutch government imposed strict new funding requirements in 2002.
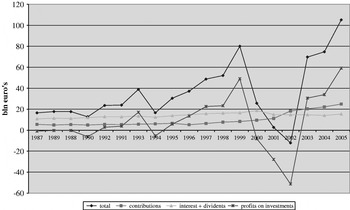
Pension funds have become more vulnerable to the ups and down of the stock market as they, in search of higher rates of return, mainly substituted private loans for equity. This process started at the end of the 1980s, and accelerated in the 1990s (see for more details Ponds and Van Riel, Reference Ponds and van Riel2007). In particular, the switch of the huge civil servant pension fund ABP to equities and the resulting internationalization of its investment portfolio, had a huge impact (see Van Riel, Hemerijck and Visser, Reference Van Riel, Hemerijck, Visser, Clark and Whiteside2003). The switch to equity led to higher but more volatile income of pension funds (Figure 1), putting pension plan design and implied risk sharing on the agenda of pension boards.
Sources of income of pension funds (1987–2005)

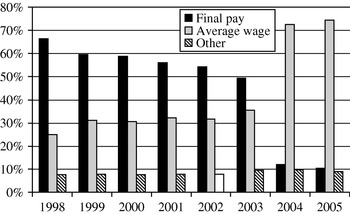
As shown in Figure 2, the predominant reaction by Dutch pension funds after 2001 was to switch from DB–final-pay plans to DB–average-wage plans. Between 1998 and 2005, the share of all active participants covered by average-wage plans jumped from one-quarter to three-quarters.
Percent of active participants in defined benefit plans by type, 1998–2005

A typical characteristic of these average-salary schemes is that indexation of all accrued liabilities is made dependent on the solvency position of the pension fund. Solvency-contingent indexation in addition to flexible contributions enlarges the funds' risk-bearing capacity. This is often ruled via a so-called policy ladder that is part of the pension deal agreed upon by the social partners within the board of trustees. A policy ladder relates the contribution policy and indexation policies explicitly one-to-one to the financial position of the pension fund.
This contribution evaluates the plan redesign in the Netherlands. Section 2 depicts the plan redesign as the outcome of a new compromise between the major stakeholders. Section 3 presents ALM evidence for different collective plans. Section 4 evaluates the new plan setting from different perspectives: welfare aspects, value redistribution between plan members, and transparency.Footnote 1Section 5 summarizes and concludes.
2 Search for a new compromise
Traditionally, risk management by Dutch pension funds in the postwar period was done primarily by adjustments in the contribution rate. A high funding ratio gave rise to contribution cuts, whereas a funding ratio that was perceived as too low led to an increase in the contribution rate. Indeed, as a reaction to the low funding ratios at the beginning of this decade, contribution rates nearly doubled. This sharp increase made it clear that risk management through contribution rates exclusively was no longer appropriate. Since most Dutch pension funds stem from the 1950s and 1960s, they have now, after 40 years, a high degree of maturity – as a large group of members has reached retirement age. Typical for a mature pension fund is that the ratio of pensioners to workers is high, and also the ratio of the value of pension-fund liabilities to wages is high. The ratio between liabilities and total wages is expected to rise from approximately 2.5 now to 4.5 in 2030. This sharp increase will severely undermine the effectiveness of the contribution rate as a steering instrument. To improve the funding ratio a 1% point would require additional contributions of 4.5% in the future, instead of the 2.5% at present. An indexation cut of 1% also delivers an increase in the funding ratio of a 1% point.
A renewal of pension fund risk management would require finding a new balance in the interests of the fund stakeholders. Pension funds in the Netherlands are independent financial institutions with their own governance and administrative structures separate from that of the employers. The legal status as a separate trust gives pension funds a significant degree of operational autonomy that is not always present in the Anglo-Saxon trust model (Laboul and Yermo, Reference Laboul, Yermo, Clark, Munnell and Orszag2006). Employers and unions are equally represented on Dutch pension fund boards. As the number of retirees has grown considerably over time, retiree organizations have increasingly claimed a say in pension fund management.
In contrast to for example the Anglo-Saxon defined-benefit plans in the private sector, Dutch employers are less able to dominate and to direct pension fund management and policy. Employers therefore have to compromise more with unions. The other side of the coin, however, is that they also are not regarded as exclusively responsible for correcting situations related to under-funding and risk-bearing. This contrast is accentuated by the dominance in the Netherlands of industry-wide pension funds, which are absent in the Anglo-Saxon world. For employers, it was important to address the declining effectiveness of the contribution rate as a steering mechanism, and to spread risks more evenly over participants and sponsors. But this also was a concern for unions. Unions in the Netherlands have to strike an internal compromise between the interests of younger workers, on the one hand, and the interests of older workers and pensioners (who often retain their trade union membership), on the other. In most cases, moreover, union representatives in pension boards are often closely involved in wage negotiations. This explains why unions have been willing to spread risks more broadly between active members and pensioners. An exclusive reliance on contribution rates to absorb risks would run the risk of alienating younger workers and put a heavy burden on wage negotiations, as employers would try to shift pension costs to workers.
In most final-wage pension plans, indexation of pension benefits was, at least on paper, dependent on the solvency position of the pension fund. Thus, in principle, pension funds could have invoked this possibility and shifted investment risk to pensioners. Given the maturity of most funds, indexation cuts are an effective instrument for restoring solvency. This was not easy to implement, however, as the conditional indexation of pension benefits had been poorly communicated to participants. Moreover, the clauses had been seldom invoked, as the financial situation of most funds was healthy or it was considered to be so in view of the old actuarial framework for valuing pension liabilities. As a consequence, strong resistance from pensioners might have been expected. Pensioners might have felt that they were the victim of contribution holidays in the roaring 1990s, when they threatened to go to court in case pension funds decided to shift risk their way only. As many pensioners remain union members after retiring, unions could not neglect their concerns. A way out was to broaden solvency-contingent indexation to all liabilities – including accrued rights of active members. Technically, this implied a switch from final-wage plans to solvency-contingent average-wage plans.
3 Pension-plan redesign by Dutch pension funds and risk re-allocation
In order to determine more specifically the consequences for risk allocation from the shift to solvency-contingent average-wage salary plans, we use an ALM framework to compare the allocation of risk among the plan members in a typical current pension plan in both a traditional DB plan and collective DC plan.
3.1 Policy ladders
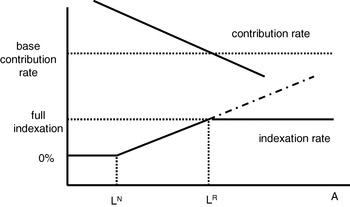
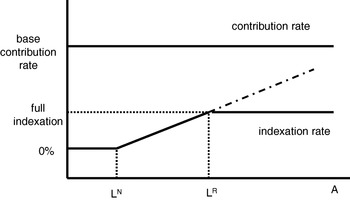
Figure 3 shows the functioning of a policy ladder for a typical pension plan in the Netherlands currently. In this figure, the x-axis denotes the value of the assets A of the pension fund under study. A pension fund is said to be fully funded when assets A equal the value of the real liabilities L R, the latter being the value of accrued rights when full indexation would always be given. L R is calculated by discounting the accrued rights with the real yield curve net of real wage growth. The value of the nominal liabilities, L N, is the value of accrued rights when no indexation would be given. The size of L N is determined by discounting the accrued liabilities with the nominal yield curve. The difference between real and nominal liabilities, L R−L N, is the required indexation reserve that is needed to cover the indexation promise to the participants. The actual indexation reserve position is A−L N, which may be either positive or negative. Along the vertical axis, the contribution rate and the indexation rate are set.
Hybrid DB-DC plan

The base contribution rate is fixed. There is room for full indexation equal to the wage growth when the value of assets is equal to or larger than the value of the real liabilities: A⩾L R. Then, the actual indexation reserve A−L N is at least equal to the required indexation reserve L R−L N. The indexation rate will be zero when the assets are equal to or even below the nominal liabilities: A⩽L N. The actual indexation reserve then is zero – or is even negative. Between these two points (i.e. when L N<A<L R), indexation follows the wage growth partly where the indexation given is determined by the proportion of the actual indexation reserve in relation to the required indexation reserve. When A>L R, catch-up indexation may be given up to a maximum equal to the previously missed indexation due to indexation cuts. The possibility of catch-up indexation is indicated by the dotted line.
Official statistics classify current average-wage plans as DB plans. However, the broadening of solvency-contingent indexation implies that the final pension result will be partly dependent on investment returns. The current typical average wage scheme can therefore better be described as a hybrid DB–DC plan, keeping a midway position between a traditional DB plan, with flexible contributions and well-defined indexed pensions, and a DC plan, with uncertainty as to the final pension result because of uncertainty on the rate of return on investments. The hybrid plan is partly DB by nature because the yearly accrual of pension rights is specified in the same way as a traditional DB plan, and because contributions are flexible, depending on the financial position of the pension fund. The hybrid plan is partly DC by nature, as the yearly indexation is related to the financial position of the fund and therefore is related to the investment returns.
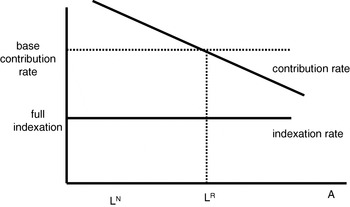
Figure 4 is a stylized representation of risk allocation within a traditional DB plan structure wherein indexed benefits are guaranteed and funding risks are absorbed by flexible contributions. This can be seen as a stylized representation of risk bearing in the Netherlands in the postwar period up to 2000. As in Figure 3, the base contribution rate is fixed. Additional contributions are not necessary when assets match real liabilities: A=L R. A situation of real under-funding, A<L R, or real over-funding, A>L R, leads to, respectively, a surcharge to, or a cut in, the contribution rate. A situation of under-funding or over-funding is smoothed out over a period of 35 years.
Traditional DB

A number of pension funds have gone one step further than the hybrid plan by abolishing the use of the contribution rate as a risk-steering instrument. This type of plan can be characterized as a collective DC plan with fixed contributions but flexible benefits, depending on the financial situation of the pension fund.
The setting of solvency-contingent indexation in the collective DC plan in Figure 5 is the same as in the hybrid DB–DC plan (Figure 3). The contribution rate in the collective DC plan is fixed. This plan also allows for catch-up indexation like the hybrid plan does, once again indicated by the dotted line.
Collective DC

3.2 Performance
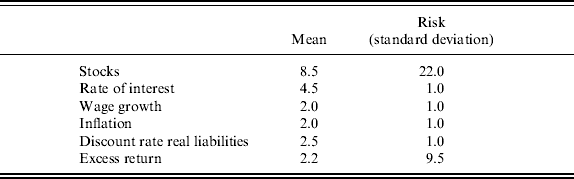
We evaluate the performance of the three examples of policy ladders described in Figures 1–3. Results are derived from Hoevenaars and Ponds (Reference Hoevenaars and Ponds2007). The pension fund under study is a stylized pension fund as a representative for industry-wide pension funds in the Netherlands. A classic ALM study is applied for a horizon of 20 years (2006–2025). For each of the three variants, the asset mix is composed of 50% stocks and 50% bonds. Table 1 presents means and risks of the key variables. On average, the expected return on a 50–50 mix over the 5,000 scenarios is 6.5%. The average growth rate of liabilities is 4.5%, consisting of the indexation component (equal to the average wage growth of 2%) and the discount-rate component (equal to 2.5%). On average, therefore, the excess return of assets over the liability growth rate is 2%.
ALM projections
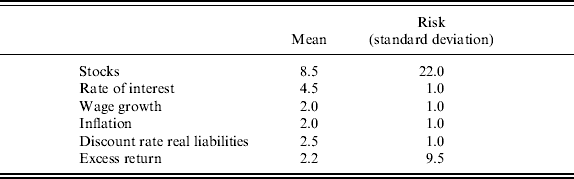
We set the initial real funding ratio at 85%,Footnote 2 reflecting the situation of underfunding for many pension plans in the Netherlands in 2006.
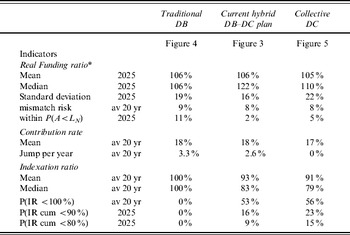
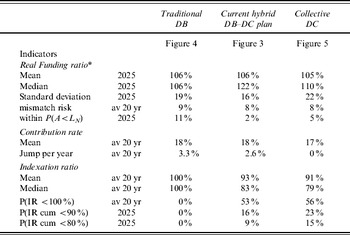
Table 2 summarizes the classic ALM results for the three variants of plan design. The note below the table explains the significance of the indicators. The reported evidence in this table provides insights regarding the question of how pension-plan design (i.e. the structuring of the policy ladder) determines the way in which the risks in the funding process are absorbed – by adjustments in contributions or by adjustments in indexation rate or changes in the funding ratio.
ALM results for pension-plan variants (2006–2025)
Notes: * initial real funding ratio 2006=85%.
The median, mean, and standard deviation of the real funding ratio are reported at the end of the 20-year evaluation period. Mismatch risk, defined as the degree of mismatch between the payoff structures of asset mix and liabilities, is measured by the standard deviation of the growth rate of the funding ratio. The term within P(A<L N) denotes the within probability of nominal under-funding; this is the probability of reaching a position of nominal under-funding within the 20-year evaluation period. The third group of indicators relates to indexation quality. The median, mean and standard deviation of the indexation ratio during the period of 20 years are shown. The yearly indexation ratio is measured as actual indexation over wage growth. The term P(IR<100) indicates the frequency of less than full indexation. The P(Ircum<90%) is an indicator of the indexation quality cumulative over the entire 20-year period, the probability that the cumulative value of the indexation ratio at the end of the 20-year period is less than 90% (less than 80%, respectively) of cumulative end value of full indexation.
Summary results of ALM analysisFootnote *
Note: * See Table 2 for explanations. Bold figures indicate the highest risk.
The expected real funding ratio after 20 years in all three variants is improved strongly from the low level of 85% in 2006, as shown by the mean and the median at the end of the evaluation horizon, which reach values above 100%. The mismatch risk for a 50–50 mix for the three variants is slightly higher than 8%. The variants differ in how this mismatch risk is absorbed. The traditional DB variant absorbs mismatch risk by adjusting the contribution rate in order to restore a situation of under-funding or over funding. This results in a high volatility of the contribution rate. The average year-to-year change in the contribution rate is 3.3% points. The funding ratio for risk and probability of under-funding are reduced strongly, due to the flexible contribution rate.
The hybrid plan makes use of two steering instruments to control solvency risk: adjustments in contributions and indexation. As a result, the within probability of nominal under-funding almost vanishes compared to the traditional DB plan. The collective DC variant has fixed contribution but flexible indexation. The within probability of under-funding is higher than the hybrid plan, reflecting the fact that the contributions are no longer part of the risk-bearing process. This also explains that the results of the indexation ratio are less favourable compared with the hybrid plan, as the indexation instrument has to take up more risk.
3.3 Trade-offs
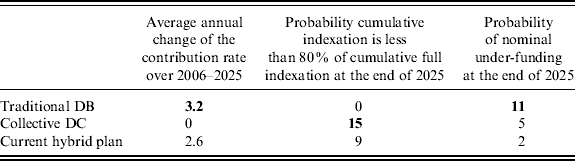
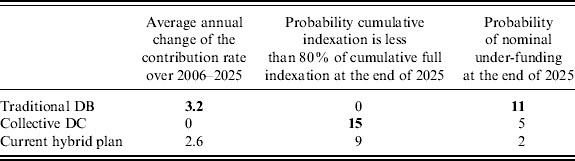
Pension-plan design is decisive with regard to how risk taken by the pension fund is allocated among stakeholders. Table 3 summarizes for key risk measures the performance of the three variants under study here. The key risk measures are as follows: the average annual change of the contribution rate (column 1), the cumulative deviation from full indexation (column 2), and the probability of nominal under-funding (column 3). The asset mix is the same for the three variants, so total risk to be distributed is the same for the three variants. The variants differ in the way in which risk is allocated over the stakeholders.
Welfare comparison of alternative pension plans with optimal individual plan
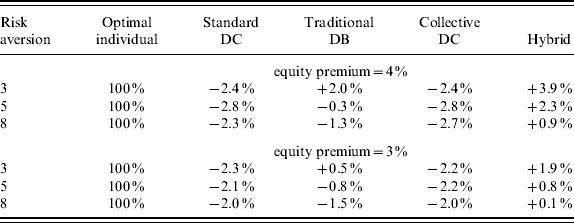
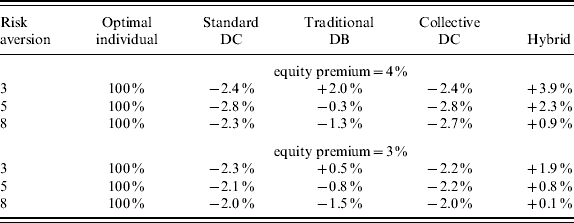
Source: Cui et al. (Reference Cui, De Jong and Ponds2007), Tables 1 and 5. We have adjusted the labels of the plans for the labels in our paper. The table above reports the welfare gain (+) or welfare loss (−) from the perspective of a new 25-year participant with the optimal individual plan as benchmark (absolute welfare level set at 100%) for different degree of risk aversion (CRR) and for an equity premium of 4% respectively 3%. Welfare effects are evaluated for a 55-years horizon, consisting of a 40 years working period and a 15 years retirement period. See Cui et al. for more details.
The table shows the various trade-offs confronted in pension-plan design. Full indexation in the traditional DB plan comes at the cost of both a higher risk of nominal under-funding and a high volatility of contribution rates. Fixed contribution rates in collective DC plans come mainly at the cost of high indexation risk. The current hybrid plan takes a midway position in these trade-offs: there is still volatility in contribution rates and there is less-than-full indexation. What is gained in the hybrid plans is a lower probability of nominal under-funding in comparison to both traditional DB plans and collective DC plans.
4 Evaluating the shift to solvency-contingent average-wage salary plans
In real life, most if not all individuals fail to define and to execute the appropriate pension savings strategy as suggested by modern theory due to missing markets, myopia, a lack of necessary knowledge, and so on. The guiding principle in assessing pension plan design should be the added value of a specific plan in assisting individuals to realize their preferences with respect to retirement income. How well does the construct of the new plan setting perform in meeting this guiding principle?
4.1 Welfare comparison
The shift to the hybrid plan structure may be preferred from the perspective of solvency risk management. One may wonder whether the hybrid plan is the preferred pension plan for the participants as well. Within an ideal setting with complete markets and no costs, Cui et al. (Reference Cui, De Jong and Ponds2007) perform a welfare comparison of a variety of realistic collective pension plans with as a benchmark the lifecycle-based optimal individual scheme. As to the latter, the individual can optimally choose the consumption level, savings rate, and portfolio composition (under a borrowing constraint) at any time throughout his life (Merton, Reference Merton1969). Cui et al. find that for different degrees of risk tolerance a collective plan structured like a Dutch hybrid plan with flexible benefits and flexible contributions is welfare-superior to the optimal individual scheme (compare Table 4). The welfare gain is larger compared to a standard DC plan with a fixed contribution rate. For individuals with low or moderate levels of risk tolerance, the individual scheme is dominant vis-à-vis collective plans with only one instrument of risk bearing, either via flexible contributions only (as the traditional DB) or via flexible benefits only (as the collective DC). Hence, more efficient risk sharing can be achieved by using more than one risk absorber.
The hybrid plan performs well because of its broad risk bearing capacity as risks can be shared among current workers, current retirees, and future participants. Therefore, the hybrid plan is more capable than the other plans of exploiting the equity risk premium in stocks. The welfare gain is the largest for the less risk-averse agent, whereas the more riskaverse agent obtains less welfare gain. This may be counterintuitive at first sight. The key reason is that the less risk-averse agent is willing to accept a more risky portfolio, and therefore to share more risk intergenerationally and thus to benefit more from intergenerational risk sharing.
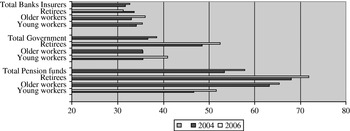
Table 4 also reports the welfare results when the equity premium is reduced from 4% to 3%, which probably is a better reflection of current capital market pricing. The relative welfare levels of the collective plans fall as the lower equity premium diminishes the advantages of intergenerational risk sharing. Note the optimal individual plan now performs almost as good as the hybrid plan and they both beat the other plans. The analysis probably will turn in favour of the collective plans when real-life features are added to the analysis, like incomplete markets and the higher costsFootnote 3 of running individual plans. In turn, however, the prolongation of collective plans is only possible as long as young and new participants retain confidence in these plans. Figure 6 displays results of a survey among Dutch households regarding the confidence in institutions in the field of retirement income provisions. The confidence of the general public in Dutch pension funds is very high compared with the outcome for the government and banks and insurers. This confidence in funds is even increased recently after the solvency crisis. This high level of confidence enables Dutch person to continue the collective hyrbid plan in order to reap the benefits of intergenerational risk sharing. As confidence is highly ‘man-made’, this puts a high responsibility on pension fund managers to arrive at good governanceFootnote 4 in order to safeguard time-consistency by controlling the risk of severe underfunding and generational equity, in particular as to the position of the younger members.
Confidence (moderate to high) in retirement income providing institutions

4.2 Value transfers from old to young
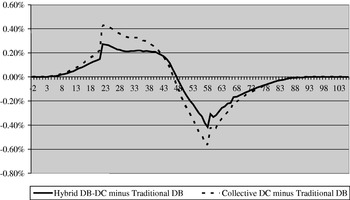
A pension fund essentially is a zero-sum game. The total value to be distributed within the pension fund at a specific point in time is given, and is equal to the value of assets under management. The content of the pension deal is decisive with regard to how the total value is distributed among stakeholders. Changes in the policy setup of a pension fund may easily lead to redistribution of value and risk among the members. Hoevenaars and Ponds (Reference Hoevenaars and Ponds2007) make use of the so-called method of value-based generational accounting to calculate value transfers between plan members due to policy changes. Figure 4 shows redistribution between plan members due to a switch from the traditional DB plan to a hybrid DB-DC plan, respectively, from the traditional DB plan to a collective DC plan.
Figure 7 reveals that the step from the traditional DB plan to either the hybrid DB–DC plan or the collective DC plan leads to redistribution from old to young. The elderly members lose value, as they have to accept that a de facto unconditional indexation policy is replaced by flexible benefits, depending on the financial soundness of the fund. The younger members win, since part of the risk bearing and funding burden can be shared with the elderly members.
Value redistribution between generations over 2006–2025 when from traditional DB plan to hybrid DB-DC plan or to collective DC plan (as % of total nominal liabilities 2006)

4.3 Transparency
A final-pay DB plan may be criticized for several reasons; however, it has the advantage of being simple regarding the pension result. Informed participants will easily understand that their pension result is equal to: (number of years of service)×(accrual rate)×(final-pay). Indexation after retirement follows the reference wage growth of the industry. Dutch funds have replaced this simple rule by an average wage plan, where the pension result will be determined by the wage path over the career, and the yearly accrual rate, where indexation is contingent on realized investment returns and reference wage growth in the industry. Moreover, most board of trustees of pension funds with policy ladders have discretionary power to deviate from the policy ladder if circumstances motivate them to do. So the construct of a policy ladder at best will not be supportive to reduce pension illiteracy among the general public. This is worrying as a recent survey (van Rooij et al., Reference Van Rooij, Kool and Prast2007) has pointed out that 44% of respondents do not know the type of pension scheme that they are covered by, 61% do not know about their pension rights, and 65% have no idea about the scale of their future benefits. Pension funds recently have started to improve their communication to their members. This indeed may result in greater consciousness among the members.
4.4 Contingent claims
Even for well-informed optimizing individuals, the implementation of a solvency-contingent indexation policy may lead to a welfare loss due to its inherent contingent claim structure. Modern economics models the savings process as the outcome of the preferred spreading of lifetime resources over lifetime consumption. Individuals aim to maintain the standard-of-living they have been used to before retirement. A wage-indexed defined benefit plan is an ideal provision to realize this aim as the accrued pension rights automatically are adjusted for nominal wage increases, being the sum of price inflation and real income growth. DB pension rights indeed offer a real guarantee to their holders. The switch from a de facto unconditional indexation towards a solvency-contingent indexation may be seen as a welfare loss for optimising individuals. Part of the labour remuneration is related to stock market performance, making future pension income uncertain in real purchasing power terms. A full restoration of the initial position will require trading a complex set of contingent claims being the offsetting mirror of the set of contingent claims involved in the policy ladder structure. Optimizing individuals may use their other wealth sources to undo changes in risk exposure, for example by going short in equities and long in indexed bonds. However, markets are far from complete and individuals may be borrowing-constrained, so it may be impossible to implement an offsetting strategy. In particular, the elderly may be hurt as their remaining lifetime is short and their capacity to absorb risk is small.
5 The jury is still out
The solvency crisis in 2001–2004 urged Dutch pension funds to reconsider their final-pay plans with de facto unconditional indexation. In the Dutch societal setting, a plan redesign required a new compromise between employers, employees, and retirees. Most pension funds have found a solution by switching to an average-wage plan with solvency-contingent indexation and contributions. The reported ALM evidence has made clear that solvency risk management indeed has improved considerably. We have characterized the new design as a hybrid DB–DC plan. On the one hand, it is DB, because the yearly accrual of pension rights is specified in the same way as a traditional DB plan, and because contributions are flexible, depending on the financial position of the pension fund. On the other hand, this plan is DC, as the yearly indexation is related to the financial position of the fund and therefore is related to investment returns.
The guiding principle in assessing pension plan design should be the added value of a specific plan in assisting the individual participants to realize their preferences with respect to retirement income. A final assessment of the new plan is not yet possible as ‘the jury is still out’.
The hybrid plan appears to be welfare-dominant compared to collective plans with less risk sharing capacity (traditional DB and collective DC) and also compared to individual plans (the optimal lifecycle planning model and standard DC plan). Dutch pension funds are able to exploit the benefits of intergenerational risk sharing as a building block for risk management due to the high confidence of the general public in these institutions. As confidence is highly ‘man-made’, this puts a high responsibility on the shoulders of boards of trustees to safeguard key aspects of collective risk sharing, in particular generational equity and controlling the risk of severe underfunding.
There are also serious drawbacks in the redesign, however. The change to solvency-contingent average-wage salary plan has led to considerable value redistribution in favour of younger participants at the expense of elderly workers and retirees. We have serious doubts about the degree to which plan participants and their representatives are aware of the direction and size of this value redistribution. If they would understand, it is highly questionable if they all would agree. A point of concern is that the general public in the Netherlands is highly illiterate on pension issues. This illiteracy among many plan members is worrying as the pension design change implies that they have to bear more risk. The real guaranteed pension promise of the final-pay plan is replaced by a projected pension income that at best provides the same result, but probably lower. As far as plan members are aware of their higher risk exposure, they will have difficulties in cancelling out the higher risk exposure in financial markets and restoring their initial preferred position. The inherent contingent claim structure of the new plan is simply too complex.