Arginine vasopressin is a nonapeptide hormone synthesized in the hypothalamus and stored in the posterior pituitary gland.Reference Vincent1, Reference Treschan and Peters2 Its predominant effects are mediated by so-called V1, vascular tone, and V2, renal water retention, receptors. It also has complex interactions with other hormonal systems via V3 receptors in the pituitary.Reference Treschan and Peters2, Reference Sharshar, Blanchard, Paillard, Raphael, Gajdos and Annane3 Its most important role in healthy, euvolemic individuals is maintaining the balance of water rather than vascular tone, and infusion of vasopressin in healthy subjects does not lead to hypertension.Reference Vincent1
Exogenous vasopressin has increasingly been used as a therapeutic agent for various forms of vasodilatory shock, including shock following sepsis and cardiac surgery.Reference Landry and Oliver4–Reference Barrett, Singer and Clapp7 Its therapeutic effect is felt to be secondary to correction of a vasopressin-deficient state.Reference Landry and Oliver8 There are few studies on whether assumptions regarding levels of vasopressin and post-cardiotomy vasodilatory shock are true in children. Because of this, we designed this prospective study to examine the hypotheses, first, that levels of vasopressin in children are affected by cardiopulmonary bypass; second, that children with evidence of haemodynamic instability are more likely to have inappropriately low circulating levels of vasopressin following bypass; and third, that preoperative use of inhibitors of angiotensin converting enzyme or congestive cardiac failure may affect the vasopressin or haemodynamic response to bypass, as has been shown in adults.
Materials and methods
This prospective study was conducted in a tertiary-care paediatric intensive care unit of a University hospital from November, 2004, to May, 2006. The institutional review board approved the study and signed informed consent was obtained from every parent/guardian.
Eligible patients
We considered all children under the age of 18 years undergoing cardiac surgery with cardiopulmonary bypass to be eligible. We excluded patients if bypass was not planned, if there was not an English or Spanish speaking parent or guardian, and if informed consent was not given.
Procedures
For each patient, approximately 2 millilitres of whole blood was drawn to measure a level of vasopressin immediately prior to bypass, during bypass, at the end of bypass while in the operating room, on admission to the paediatric intensive care unit, and at 4, 8, 12, 24 and 48 hours after admission to the intensive care unit. Blood was drawn only from indwelling arterial or central venous catheters, or when other samples were required by peripheral venepuncture in the routine care of the patient. No venepunctures were performed solely for the purpose of the study.
Whole blood specimens were collected in Becton Dickenson K2 EDTA tubes. Specimens were packaged and sent to the Specialty Outreach Laboratory immediately upon collection. Specimens were spun down using centrifuge at 2 to 8 degrees centigrade at 2000 gravities for 15 minutes, plasma separated from the cells and placed in a polystyrene tube and frozen at less than 20 degrees centigrade. Specimens were then sent and processed at the Specialty Laboratories in Valencia, California. Serum was analyzed using a Buhlmann double antibody radioimmunoassay kit designed for the quantitative in vitro diagnostic direct measurement of vasopressin in EDTA plasma.
Data collection
Demographic and clinical information, including age, weight, gender, cardiac lesion, preoperative medications, echocardiographic and cardiac catheterization results, were recorded for each patient. The periods of cardiopulmonary bypass, cross clamping, deep hypothermic cardiac arrest, and modified ultrafiltration, along with the anaesthetics used, the surgery performed, and the postoperative echocardiographic results obtained, were also recorded. In addition, we recorded the length of stay in the intensive care unit and hospital, the number of days when vasopressors were used, the number of days of mechanical ventilation, the Pediatric Risk of Mortality III Score,Reference Pollack, Patel and Ruttimann9 and the disposition at discharge. Serum chemistries, coagulation panels, complete blood counts, and blood gases as part of routine patient care were recorded at the time samples were drawn. In addition, vital signs and fluid balance were recorded.
We calculated a vasopressor score from the doses of continuous infusions employed (Dopamine × 1 + Dobutamine × 1 + Epinephrine × 100 + Norepinephrine × 100).Reference Zuppa, Nadkarni and Davis10 Hypotension was defined as systolic blood pressure less than the 5th percentile for age based on values used for recent sepsis guidelines.Reference Goldstein, Giroir and Randolph11 Serum osmolality was calculated as (serum sodium × 2) + (Blood Urea Nitrogen/2.8) + (Glucose/18). Patients were defined as having preoperative congestive cardiac failure if they were treated with digoxin, diuretics, inhibitors of angiotensin converting enzyme, or milrinone preoperatively, or if they had congestive cardiac failure listed as a diagnosis in their list of problems.
Statistical analysis
We anticipated that a study enrolling approximately 36 patients would give us 85% power to detect a difference of 7 picograms per millilitre in levels of vasopressin compared to baseline, with a two-tailed alpha of 0.05, assuming a standard deviation in levels of vasopressin of 8 picograms per millilitre.Reference Kindelan, Navero and De la Rosa12
Serial levels were compared to baseline using paired t tests. Levels were log-transformed prior to t tests or analysis of variance in order to approximate a normal distribution. The p values are presented as actual values rather than being adjusted for multiple comparisons. Spearman’s correlation was used to correlate levels of variance with other continuous variables, and t tests or analysis of variance were used to compare levels between groups. Significant correlations were confirmed using linear regression with adjustment for multiple within-subject measurements. Paired t tests were used to compare serial levels to baseline. Fisher’s exact test was used for comparisons between categorical variables. Receiver-operating characteristic analysis was used to evaluate the level of vasopressin as a predictor of hypotension. Values are expressed as mean and standard deviation unless otherwise stated. All analyses were performed with Stata 8.0 (Stata Corporation, College Station, Texas).
Results
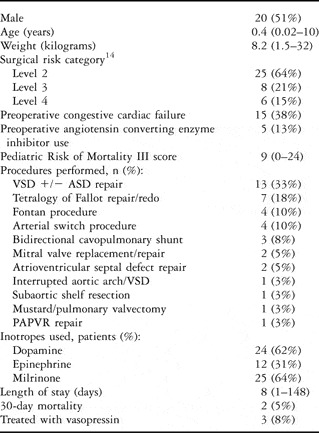
We identified 63 eligible subjects. Of these, 47 agreed to participate in the study. Data were obtained on 39 patients, described in Table 1. The 8 remaining patients were excluded because key samples were either not drawn or misprocessed in the laboratory. During the course of the study, 3 patients were treated with infusions of vasopressin, 2 of whom died. Levels were higher during treatment with vasopressin than at other times, at 393 plus or minus 258 versus 51 plus or minus 114 (p < 0.0005). Values obtained during treatment with vasopressin, therefore, are not included in the remainder of the analyses.
Patient characteristics (n = 39). Values are expressed as number (percent) or median (range).

VSD = Ventricular septal defect, ASD = Atrial Septal Defect, PAPVR = Partial anomalous pulmonary venous return.
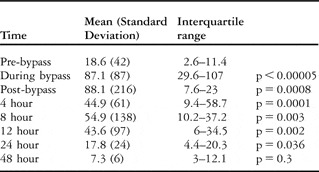
Table 2 shows the serial levels of vasopressin before, during, and after cardiopulmonary bypass. Levels rose during bypass, slowly fell over the following 24 hours, and returned to baseline by 48 hours. Patient age, gender, and the category for surgical risk did not correlate with levels of vasopressin. Longer duration of bypass predicted a higher level, with a 2.5 picogram per millilitre (95% confidence intervals from 1.4 to 3.6) increase in levels immediately after bypass for each additional minute of bypass. This relationship was no longer apparent by 12 hours after bypass.
Mean levels of vasopressin, in picograms per millilitre, at each time point. p values represent comparisons with pre-bypass levels. Measurements on therapeutic vasopressin excluded.

Levels did not differ at baseline between patients treated with inhibitors of angiotensin converting enzyme preoperatively and those who were not, at 11 versus 20 picograms per millilitre, p = 0.65, with 95% confidence intervals for the difference from −33 to 51 picograms per millilitre, although levels after bypass were higher in those treated with inhibitors of angiotensin converting enzyme preoperatively, at 137 plus or minus 198 versus 37 plus or minus 103 picograms per millilitre (p < 0.00005), with significant differences noted at admission to the paediatric intensive care unit, and after 4 hours and 8 hours. Preoperative use of inhibitors of angiotensin converting enzyme did not predict the requirement for infusion of vasopressin during hospitalization (p = 0.3), or the development of hypotension (p = 0.28).
Levels of vasopressin at baseline did not differ between patients with or without preoperative congestive cardiac failure, at 13.9 versus 22 picograms per millilitre, p = 0.37, with 95% confidence intervals for difference from −22 to 38 picograms per millilitre. Levels after bypass, however, were higher in patients with preoperative congestive cardiac failure, at 73 plus or minus 148 versus 35 plus or minus 104, p = 0.0001, with significant time points at admission to the paediatric intensive care unit and after 4 hours. Patients with preoperative congestive cardiac failure were not significantly more likely to require infusions of vasopressin, 13% versus 3%, (p = 0.54), or to become hypotensive (p = 0.5).
Measurements of systolic blood pressure taken during the study were under the 5th percentile for age 22% of the time. Of the patients, 24 (62%) thereby met this definition for hypotension for at least one measurement during the study. Only 4 patients (10%) exhibited persistent hypotension over more than two time points. There was no correlation of levels of vasopressin with either the vasopressor score (p = 0.4) or the presence of hypotension (p = 0.55), although patients with persistent hypotension did have higher levels immediately after bypass, at 422 versus 42 picograms per millilitre, (p = 0.008). The differences at other time points did not reach statistical significance.
Levels measured while patients were being treated with vasopressin were excluded from the analysis, but we did examine the level immediately prior to the decision to begin vasopressin in each patient to determine if it was unusually low. Levels immediately prior to beginning infusions were still above baseline, ranging from 59 to 809 picograms per millilitre, and when compared to all other levels obtained were higher, at a mean of 347 picograms per millilitre versus 59 picograms per millilitre ( p = 0.003). Of the patients treated with vasopressin, 2 were in the persistently hypotensive group. In addition, the level of vasopressin did not correlate with central venous pressure.
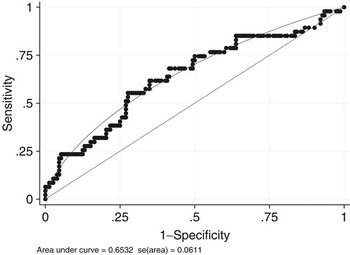
Receiver-operative characteristic analysis (Fig. 1) showed that the level of vasopressin was a poor predictor of hypotension, with an area under the curve of 0.65 and no cutoff point with an adequate sensitivity and specificity. “Deficient” levels, less than 10 picograms per millilitre,Reference Jochberger, Mayr and Luckner13 during hypotension were seen in only 4 patients immediately after bypass, and in only 2 patients at 48 hours. Only one of these patients, with a deficient level at 48 hours, was in the group with persistent hypotension. All other time points showed no inappropriately low levels in hypotensive patients.
Receiver operating characteristic curve using the level of vasopressin as a predictor of hypotension. Area Under the Curve demonstrates that the level would be lower in patients with hypotension versus those without only 65% of the time.

The category for surgical risk as defined in the RACHS-1 consensus statementReference Jenkins, Gauvreau, Newburger, Spray, Moller and Iezzoni14 did not significantly influence levels of vasopressin (p = 0.12). Patients who died had a trend towards having higher postoperative levels compared to patients who survived, at 106 plus or minus 235 versus 47 plus or minus 114 picograms per millilitre (p = 0.056). Pediatric Risk of Mortality III score did not correlate with higher postoperative levels (p = 0.4).
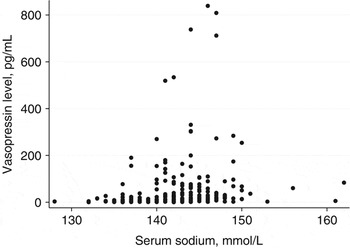
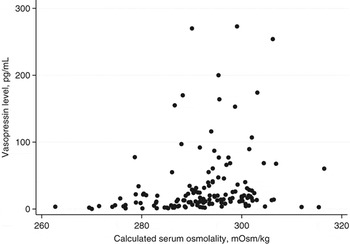
Higher levels of vasopressin correlated with both higher levels of sodium in the serum (Spearman’s rho=0.37, p < 0.0005, Fig. 2) and higher calculated serum osmolality (Spearman’s rho=0.37, p < 0.0005, Fig. 3). The association remained significant (p < 0.0005 for sodium and p = 0.003 for osmolality) on regression analysis adjusted for multiple within-subject measurements. Higher levels of vasopressin also correlated weakly with a positive fluid balance (Spearman’s rho=0.23, p = 0.008).
Levels of vasopressin level plotted against sodium in the serum, Spearman’s rho = 0.37, p < 0.0005. Values obtained during treatment with vasopressin excluded.

Levels of vasopressin plotted against calculated serum osmolality, Spearman’s rho =0.37, p < 0.0005. Values obtained during treatment with vasopressin excluded. Outliers with vasopressin level greater than 400 excluded from graph for clarity, but were included in analysis.

Discussion
The vasopressor and water-balance effects of pituitary extracts were first described over 100 years ago, and vasopressin was first isolated and synthesized in the early 1950s, work which quickly led to a Nobel prize.Reference Dunser, Lindner and Wenzel15 Cardiac surgery and atrial stretch were recognized to affect levels of vasopressin in humans and animals over 40 years ago.Reference Shu’ayb, Moran and Zimmerman16, Reference Richardson, Giles and Pate17
More recently, attention has focused on levels of vasopressin and treatment with exogenous infusions of the agent infusions in states of vasodilatory shock, such as septic and post-cardiotomy shock.Reference Sharshar, Blanchard, Paillard, Raphael, Gajdos and Annane3–Reference Argenziano, Choudhri, Oz, Rose, Smith and Landry6, Reference Shu’ayb, Moran and Zimmerman16–Reference Lodha, Vivekanandhan, Sarthi and Kabra21 It has been hypothesized that patients in these forms of vasodilatory shock have a relative deficiency of vasopressin, which can be corrected by replacement. Vasodilatory shock after cardiac surgery may be more common in adults with preexisting congestive cardiac failure or use of inhibitors of angiotensin converting enzyme.Reference Argenziano, Chen and Choudhri5
Relatively few studies have examined levels of vasopressin in children following cardiac surgery. Kindelan, et al.Reference Kindelan, Navero and De la Rosa12 showed minimal changes from preoperative levels in 65 children, but did not assess levels until 24 hours postoperatively. Another series of 9 childrenReference Ationu, Singer, Smith, Elliott, Burch and Carter18 showed that mean levels rose to 153 picograms per millilitre following bypass, and were higher than normal for 12 to 24 hours. Another small seriesReference Rosenzweig, Starc and Chen19 reported on 11 children treated with vasopressin as a rescue therapy postoperatively. In 3 of these children, levels ranged from 1.9 to 52.4, felt to be inappropriately low given their degree of hypotension.
We have now shown that cardiopulmonary bypass affects endogenous levels in children. In our cohort, the levels rose during and immediately after bypass, then fell to normal within 24 to 48 hours. Surprisingly, we were unable to demonstrate any relationship between low levels and the requirement for vasopressors or hypotension, although others have shown no correlation with haemodynamic variables.Reference Jochberger, Mayr and Luckner13, Reference Boldt, Menges, Kuhn, Diridis and Hempelmann20 Similar to a recent study of serial levels in children with sepsis,Reference Lodha, Vivekanandhan, Sarthi and Kabra21 very few of our patients seemed ever to become vasopressin “deficient”. In fact, persistently hypotensive patients seemed to have higher levels immediately after bypass. It is possible that children are not as likely to deplete their stores of vasopressin as adults, which could potentially explain the lower incidence of vasodilatory shock in children.Reference Killinger, Hsu and Hardart22
Longer cardiopulmonary bypass time did correlate with higher levels, as did preoperative use of inhibitors of angiotensin converting enzyme and congestive cardiac failure, at least at some time points. In contrast to adults, however, use of inhibitors of angiotensin converting enzyme and preoperative congestive cardiac failure did not lead to a compromised postoperative haemodynamic state. The correlation of higher levels of sodium in the serum, and calculated serum osmolality, with higher levels of vasopressin presumably reflects the powerful osmolar stimulus to secretion of vasopressin, although we are unable to demonstrate the direction of causality in these data.
There are limitations to our study. Standards for age-appropriate definitions of hypotension are not as readily available in children as they are in adults, as illustrated by recent challenges in finding appropriate definitions for guidelines for the treatment of septic shock.Reference Goldstein, Giroir and Randolph11 The difficulty in finding appropriate percentiles is reflected in the fact that two of the patients in our series were “hypotensive” by the criterions used preoperatively. We also did not include findings from physical examination in our data collection that could be used to differentiate vasodilatory shock from other causes of hypotension, due to the difficulty in establishing objective criterions. None of our patients had pulmonary arterial catheters in place for measurement of cardiac output and systemic vascular resistance.
There is also no standard definition of vasopressin “deficiency” or what level represents an inappropriate response to hypotension, with cutoffs from 3.6 to 20 picograms per millilitre having been used in the literature.Reference Sharshar, Blanchard, Paillard, Raphael, Gajdos and Annane3, Reference Jochberger, Mayr and Luckner13, Reference Albright, Zimmerman and Selzman23 Receiver operating characteristic analysis using our data did not demonstrate an appropriate cutoff point for associating a level of vasopressin with hypotension.
The variability in levels of vasopressin in our data was much greater than that shown in other studies.Reference Kindelan, Navero and De la Rosa12 This may have decreased the power of the study to show significant differences, but the change in levels from baseline over time, our primary outcome, was dramatic enough that the difference was significant despite the wide variability. It is possible that our study was not adequately powered to assess some of our secondary outcomes. For instance, there were few patients enrolled with preoperative congestive cardiac failure or preoperative use of inhibitors of angiotensin converting enzyme, resulting in the wide confidence intervals shown.
It is possible that massive transfusion of stored blood during bypass affected our measured levels, although this could not explain the sustained rise in levels as a vasopressin half-life of approximately 11 minutesReference Treschan and Peters2, Reference Barrett, Singer and Clapp7, Reference Lodha, Vivekanandhan, Sarthi and Kabra21 should have allowed levels to fall more rapidly. We checked the level from the prime used in one cardiopulmonary bypass circuit before placing the patient on bypass, and the level was not elevated at 7.9 picograms per millilitre.
We can conclude from our study that cardiopulmonary bypass in children leads to elevated levels of vasopressin compared to preoperative values. Additional analysis showed that longer duration of cardiopulmonary bypass was associated with higher postoperative levels, and that higher levels were seen in patients with preoperative congestive cardiac failure, or those using inhibitors of angiotensin converting enzyme. Higher levels also correlated with higher levels of sodium in the serum, and calculated osmolality, as well as weakly with positive fluid balance. We found no evidence for correlation of post-cardiotomy hypotension with a vasopressin-deficient state in children. Exogenous vasopressin may still have an appropriate therapeutic role in children after cardiac surgery, but it cannot be presumed that its effect is mediated by physiologic replacement. Multicentric trials on the therapeutic use of vasopressin are currently underway in adults with cardiac arrest, septic shock and hemorrhagic shock.Reference Vincent1, Reference Dunser, Lindner and Wenzel15 Further studies are indicated in children to determine how their physiologic and therapeutic response differs.
Acknowledgements
We thank the Rafael Nieves Foundation for their generous support of this study. We also could not have performed it without the assistance of Dr Anne Savarese and Dr Monique Bellefleur in the Department of Anesthesiology, who coordinated all the intraoperative measurements of vasopressin.
Work supported by a grant from the Rafael Nieves Foundation.