Africa and Latin America secured their independence from European colonial rule a century and half apart: most of Latin America by the 1820s and most of Africa by 1960.Footnote 1 Despite the distance in time and space, independence was followed in each case by a half-century of political instability, violent conflict and economic stagnation—lost decades. The parallels between postcolonial Latin America and Africa invite comparison. We argue here that the failure to achieve stability and growth resulted from similarities in the conditions that produced those unfavorable outcomes. We also argue that the postimperial experiences of Latin American history suggest that Africa might now be entering a period of relative political stability and economic growth. In exploring the comparison, we proceed sequentially, first addressing the epoch of imperial rule and collapse, and then the postcolonial lost decades. Following the comparison, we discuss the subsequent revival in Latin America, its lessons for modern Africa, and offer reasons for believing that the latter may be recovering from its postcolonial decline and entering an era of political stability and economic growth.
IMPERIAL RULE
Economic Integration, Imperial Deterrent, and Stability
Imperial rule brought entire regions around the globe into direct contact with the tensions and rivalries between European states. Most colonies, however, did not become directly involved in these conflicts. In Latin America, the Dutch invaded Brazil's sugar-rich northeast (1630–1654); Spain lost most of its Caribbean possessions in the seventeenth century and fought to defend the rest for most of the eighteenth century; Spain and Portuguese Brazil skirmished over territory that is now Uruguay. But for the most part, the mainland colonies did not become the locus of disputes among European powers. The imperial occupation of Africa also occurred with a relatively low level of conflict, despite the belligerent nationalism that characterized the “great scramble” for Africa.Footnote 2 Tensions were highest in North Africa, climaxing (perhaps) at the time of the Fashoda incident, but only during World War I did imperial nations fight on the continent.Footnote 3 They tended to resolve their disputes through diplomacy rather than warfare.
Imperialism also brought a measure of economic integration. It fostered trade, if only because groups of colonies shared a single master. Trade and factor mobility were augmented within each of the imperial domains of Latin America due to common legal systems, fiscal policies, currencies, and governing structures. Spanish restrictions on intercolonial trade in some products were imposed in the early seventeenth century, but ended with the Bourbon Reforms in the eighteenth. French-speaking territories in Africa formed a currency zone and sterling provided a common currency for Britain's African colonies. Central Africa maintained a free trade zone; Southern Africa maintained a common tariff; and Britain promoted economic integration for Uganda, Kenya, and Tanganyika in east Africa and Northern Rhodesia, Southern Rhodesia, and Nyasaland in Central Africa.
The imperial powers also successfully contained or repressed internal challenges to colonial rule. In Latin America, potential threats to colonial rule came from ambitious European settlers, enslaved Africans and their descendants, and burdened indigenous peasants. Colonial governments produced few public goods, spent nothing on education and next to nothing on infrastructure apart from fortresses and customs houses. Many functions of the modern state were left to “corporate” bodies authorized by the colonial authorities but formed by the settlers themselves: the Church, the militia, the merchant guilds (consulados), and other private organizations. These settlers demanded more power, more privileges, and lower taxes, and colonial courts and bureaucracies often served them better than the Crown. Spain and Portugal had virtually no police or professional military in their American colonies, but managed to deter (and occasionally suppress) settler-led revolts by maintaining their capacity to mobilize their vast imperial resources. This deterrent helped keep the settler elite in line, but the elite also needed imperial protection from the slaves and indigenous peasants that surrounded them. Large-scale revolts by Indian and slave populations were rare in Latin America, although low-intensity resistance was endemic.Footnote 4
Imperialism was also accompanied by an influx of European settlers into eastern and southern Africa in the early twentieth century and from Portugal into south central Africa in the 1950s. As was true of Latin America, settlers in Africa adopted repressive labor strategies, forcefully seized land, and drove the indigenous population into crowded reserves. By contrast, the Crown had largely abandoned forced indigenous labor in Latin America by the early 1600s (except in Peruvian mines) and made an effort to protect indigenous property rights. In both Africa and Latin America, natives were forced into formal labor markets to earn cash with which to pay taxes.Footnote 5
Demographic Disaster and Indigenous Accommodation
Perhaps the biggest difference between Latin American and African imperialism was its impact on demography. A century after Columbus's first voyage, European disease had caused immense demographic damage in Latin America as the indigenous population shrank from perhaps 50 million in 1492 to as few as three to four million by the early seventeenth century.Footnote 6 The Atlantic slave trade tried to substitute African slaves for decimated indigenous populations but their addition was far smaller than the subtraction from the indigenous population caused by European disease. Moreover, Africans were not transported to the once densely populated highlands where the population losses were greatest, but mainly to the sugar-rich tropics. The demographic collapse destroyed indigenous political and institutional structures, facilitated religious and cultural assimilation, and helped raise the per capita income of the indigenous survivors who resettled on the best lands.Footnote 7 By the mid-late seventeenth century, half of the much-diminished indigenous population had succumbed to European domination. The other half lived on the colonial fringe (e.g., the Mexican north, the southern cone, and the vast Amazonian interior).
Although there is evidence of African epidemics occurring in the wake of imperial incursion in Africa, the death rate among the local populations never approached anything like that which accompanied the massive collapse of indigenous Latin American populations.Footnote 8 The forced emigration of more than nine million slaves to the Americas certainly had a positive impact on labor supplies, but it was relatively small and spread out over four centuries. The demographic differences associated with early imperialism had important implications for the two regions. First, the ratio of European settlers to indigenous populations was much bigger in colonial Latin America than it was in colonial Africa. In colonial Latin America, the figure was about 19 percent in 1605 and 40 percent in 1810.Footnote 9 For British colonies in interwar Africa, the figure was about 0.1 percent, and for Portuguese colonies it was 1.9 percent.Footnote 10 Thus, the European presence in Latin America was from ten to four hundred times greater than in Africa. Second, because local African populations, and thus their institutions and political structures, remained pretty much intact, it often required the use of European military force to subjugate them.Footnote 11 In colonial Latin America, indigenous institutions virtually collapsed after the initial conquest, or persisted in vastly weakened or altered forms. Third, the demographic disaster in Latin America must have contributed to higher (but unknown) GDP per capita there compared to Africa. In summary, different demographic experience must have left quite different economic and political imprints on the two colonial empires. Although this article stresses the similarities between postcolonial Africa and Latin America, some of the differences we observe may well be explained by the initial demographic events.
IMPERIAL COLLAPSE
It is important to stress that the decline of imperialism in both Latin America and Africa was not driven by some endogenous response to local forces but rather by exogenous events in Europe. In the former case, it was the Napoleonic wars that eroded Iberian imperial power, whereas in the latter it was World War II.
The collapse of the imperial deterrent occurred gradually for Portuguese Brazil and abruptly for the Spanish Americas. In Brazil, the Portuguese government fleeing Napoleon's army arrived in ships protected by the British fleet in 1807. Independence occurred when the king reluctantly returned to Lisbon in 1821, leaving his son behind to declare Brazil an independent “empire.” In the Spanish case, the imperial deterrent collapsed abruptly when Napoleon suddenly turned on the Spanish government. In 1808 he hustled the king (Carlos IV) and his eldest son (Fernando VII) off to a golden exile in Provence and installed his brother Joseph on the Spanish throne. By the time Fernando recovered his throne in 1813, both Spain and its empire had changed forever. For a brief time, it seemed possible to restore the status quo ante: the hidalgo revolt in Mexico was crushed in 1810; dissident movements in the Andes were suppressed shortly thereafter; and the Venezuelan rebels led by Bolivar were defeated in 1812. But disaster struck with an army revolt against the Crown in 1820. When the king faltered, settler elites in the empire understood they could no longer rely on Spain to protect them. Indeed, the resumption of Spanish liberal reforms threatened their privileges, just at a time when the scramble for political power already threatened to get out of control. Hidalgo had already proclaimed the end of the caste system and legal equality of all Spanish subjects. Bolivar and San Martin offered freedom to slaves who joined them.Footnote 12 Indigenous populations had stopped paying the hated head tax (tributo). Urban workers with no property demanded voting rights. The settler elites might look back wistfully to a quieter time of stability and order, but, with a weakened Spain turning liberal, insurrection and independence were around the Latin American corner.
As in Spanish America, most African anticolonial movements suffered initial defeat, but external shocks associated with World War II strengthened these movements while weakening imperial power. The imperialists traded war services for pledges of citizenship and equality. Financially exhausted by the costs of war, and embattled by anti-imperial uprisings in other parts of the globe, they also reluctantly conceded power to local politicians. In the French territories, African voters won the right to elect representatives to the Parliament in Paris. In English-speaking Africa, the British appointed local politicians to legislative institutions; later, they filled these posts through elections; and later still they modified the colonial governor's Cabinet in the same manner.
The demise of imperial rule in Latin America and Africa differed in at least one major respect. Imperial political retreat in Africa was accompanied by economic investment, and this investment was targeted at the traded portion of the economy.Footnote 13 The European powers emerged from World War II with immense debt and capital shortage.Footnote 14 In response to economic exigencies, they rendered imperial policy a branch of national economic policy. This meant promoting African protectionism for France: rather than importing cocoa or coffee from Latin America, France promoted their production in its African colonies, and rather than importing foreign textiles, France encouraged the creation of textile factories in Africa.Footnote 15 For England and Belgium, it meant enhancing the capacity of their African colonies to produce goods for export to the dollar market. The postwar demand for African commodities grew as did colonial trade surpluses, and these surpluses were transferred to the home country where they were used to retire war debt.Footnote 16
INDEPENDENCE AND POSTIMPERIALISM
Postcolonial Violence
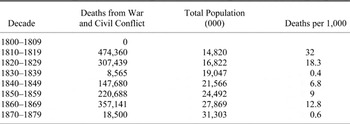
As the empires collapsed, so too did imperial defenses against external intervention and the imperial deterrent to internal conflict. Latin America fell victim to numerous foreign interventions (Table 1). Spain made serious efforts to reconquer its colonies until well in to the 1830s. Britain, France, Spain, and other powers imposed blockades or landed troops to secure economic and military advantages, or to defend their foreign markets. Elite factions in many former colonies supported these interventions. Beginning in the 1820s the United States competed directly with the British in Mexico, the Caribbean, Central America, and occasionally elsewhere, the two powers backing opposing factions in local civil conflicts. Relative to the industrial core, Latin America was a violent place between 1820 and 1870 where violent deaths averaged 1.2 per thousand, or nearly four times that of western Europe.Footnote 17
VIOLENCE INDICATORS FOR LATIN AMERICA, 1800–1879

Notes:
Deaths here are those caused by civil and international conflict in 12 LA countries: Argentina, Bolivia, Brazil, Chile, Colombia, Cuba, Ecuador, Mexico, Paraguay, Peru, Uruguay, and Venezuela.Total population was taken at mid-decade.
Source:
Singer and Small, Wages of War 1816–1965, chapter 4; Scheina, Latin America's Wars, pp. 93–375; and Coatsworth, “Patterns of Rural Rebellion,” pp. 36–37.
Foreign incursions also increased in postindependence Africa. While avoiding a hot war on European soil, the Soviet Union and the United States were quite willing to spar on developing world soil. The cold war spilled over into the Congo on several occasions, with the USSR, China, and Cuba supporting rebel movements and the United States and its allies backing incumbent regimes. In the Horn of Africa, where tensions between Ethiopia and Somalia bred instability and conflict, the United States and the USSR again backed opposing sides. So too in South Africa, where the United States long condoned the Apartheid government's occupation of Namibia, while the Soviets and Cubans backed liberation movements there and in the Portuguese colonies of Mozambique and Angola. The result was widespread destruction of property and thousands killed.
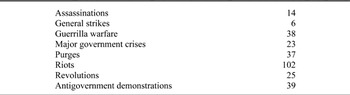
The newly independent Latin American countries did not possess internationally or even domestically recognized boundaries. Border wars, especially in Central America, were provoked by efforts to reunify now-independent territories. The conflicts were very costly and contributed to persistent fiscal crises: between 1822 and 1860, military expenditures averaged about 77 percent of total budgets in Latin America.Footnote 18 Conflicts over borders were less prevalent in Africa.Footnote 19 Wars against minority regimes were more common, particularly in Southern Africa. Table 2 summarizes the evidence on African violence between 1950 and 1973. Over that quarter century, violent deaths averaged 2.4 per thousand in Africa, or more than six times the OECD.Footnote 20 Note that postcolonial Africa was twice as violent as postcolonial Latin America (2.4 versus 1.2 deaths per thousand). One wonders how much of the difference was due to the larger European presence in Latin America and how much to the relative inefficiency of nineteenth-century weaponry.
VIOLENCE INDICATORS FOR EIGHT AFRICAN COUNTRIES, 1950–1973

Notes:
The eight countries are: Cote d'Ivoire, Ethiopia, Ghana, Kenya, Nigeria, South Africa, Tanzania and Zaire. The totals refer to all 23 years, and “warfare” refers to country-years of warfare.
Source:
Banks, Time Series 1815–1973.
Lost Decades and Violence
In postcolonial Latin America and Africa, high levels of violence, political instability, economic balkanization, and antitrade policies all sabotaged economic growth and reduced state capacities below the already low levels that had characterized the colonial regimes.Footnote 21
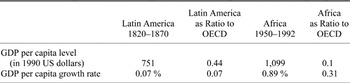
Table 3 summarizes Latin American economic performance between 1820 and 1870, where it is compared with the European “core” (what we call in Table 3 the OECD) and with post-1950 Africa. Latin American per capita GDP growth rates were 0.07 percent per annum, or, adjusting for the dubious quality of the data, about zero. This during a period when per capita GDP was growing at 1 percent per annum in the industrializing European core. The postindependence decades were clearly ones of dramatic falling behind for Latin America, and the correlation between conflict, violence, and instability, on the one hand, and poor growth, on the other, was causal.Footnote 22 The African per capita GDP growth rate was 0.89 percent per annum between 1950 and 1992, this during an era when the European industrial core grew almost three times as fast. These postindependence decades were ones of dramatic falling behind for Africa, and it appears, once again, that conflict, violence, and political instability were the root causes.Footnote 23 In short, economic performance in the half-century after independence was abysmal in both Latin America and Africa in the postimperial era.Footnote 24 Lost decades indeed.
GDP PER CAPITA LEVELS AND GROWTH: LATIN AMERICA, 1820–1870, AND AFRICA, 1950–1992

Notes:
All regional averages are weighted by population. Latin America = Argentina, Brazil, Chile, Colombia, Mexico, Peru, and Venezuela. Pre-1870 OECD = Austria, Belgium, Denmark, Finland, France, Germany, Italy, Netherlands, Norway, Sweden, Switzerland, and United Kingdom. Post–1950 Africa = Cote d'Ivoire, Ethiopia, Ghana, Kenya, Nigeria, South Africa, Tanzania, and Zaire. Latin America and OECD GDP per capita for 1820–1870 is an average of 1820 and 1870. Africa and OECD GDP per capita 1950–1992 is an average of all years in the period.
Source:
Maddison, World Economy; and Coatsworth, “Economic and Institutional Trajectories.”
Paul Collier and his collaborators offer insight into the impact of violence on private capital in Africa.Footnote 25 Conflict affected both the composition and the quantity of capital. In the face of political instability, uncertainty over property rights, and potential violence, individuals tend to hold more mobile forms of capital, liquid rather than fixed investments, or land. And when fighting destroys old capital, investment in new capital also declines. Both the reduction in the demand for local capital and the shift from fixed to liquid assets promoted capital flight. One estimate has it that 40 percent of private African wealth had been moved offshore by 1980, and that the threat of violent conflict was among the most important determinants of capital flight.Footnote 26
Kwabena Gyimah-Brempong and Marva Corley find both a direct and a lagged relationship between civil war and economic growth in Africa, the channel of influence running through capital formation.Footnote 27 The impact was very large relative to average growth rates, something in excess of 4 percentage points. Collier and his colleagues calculated that the longer term effect amounted to a reduction of 2.1 percentage points over the five years following a civil war.Footnote 28 Although lower than that estimated by Gyimah-Brempong and Corley, the Collier estimate is large enough to account for a major portion of the lost-decades gap between Africa's GDP per capita growth rate and that of other parts of the world.
At the end of the cold war, Africa had about a quarter of the world's nations, about a tenth of the world's population, and about a twentieth of the world's GDP.Footnote 29 Yet, it had about half of the world's civil wars.Footnote 30 Thus, Africa has supplied far more than its share of violent political conflict. It is perhaps for this reason that Africa is rated the riskiest continent for investors.Footnote 31 One can only suppose that the same political instability and violence explained the lack of foreign capital in postindependence Latin America even after 1850 when the late-nineteenth-century global capital market really started its boom.Footnote 32 Although we cannot offer any hard estimates of capital flight from postcolonial Latin America, it probably happened there, too, although to a lesser extent.Footnote 33
Lost Decades, Balkanization, and Antimarket Policy
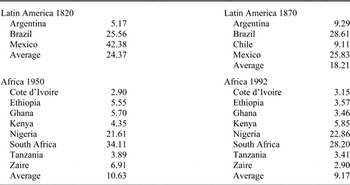
Political, fiscal, currency, and market fragmentation created economic balkanization in postindependence Latin America.Footnote 34 Balkanization probably had a smaller impact in Latin America than in Africa because intercolonial trade in the Americas was relatively modest, largely due to imperial trade monopolies and high transport costs.Footnote 35 Unfortunately, postcolonial protectionism diminished any positive impact that could have been expected from the removal of Iberian commercial monopolies. Table 4 gives us some notion as to what was lost by market fragmentation and protection in Latin America. In 1820 the three biggest Latin American economies had an average market size (GDP) only about one-fifth that of the average European core country (again, called OECD in the table). Combined, these three would have formed a federation about 73 percent of the OECD average size. The young Republics paid for this fragmentation with small markets, small scale, and correspondingly low productivity. In 1870 the average figure for the four biggest Latin American economies was less than a fifth of the average European core country, but the four combined would, once again, have made a federation 73 percent of the OECD average. If scale economies and internal trade matter as much as economists (and historians of the United States) think, postcolonial Latin America could have lost a lot from this fragmentation and balkanization, especially after railroads became available in the 1830s to conquer the physical barriers to market integration.
MARKET SIZE DURING LOST DECADES (percentage of OECD average)

Notes:
Market size calculated as GDP. All averages are unweighted of the countries listed.
Source:
As in Table 3.
Balkanization took place in postindependence Africa as well, and to an even greater degree. By 1960 the French colonies had opted for self-government and dismantled their respective federations.Footnote 36 While they remained within a currency zone managed by France, each could now impose tariffs, regulate trade, and manage transport services with an eye to their respective national jurisdictions rather than to international markets. The achievement of independence by Zambia and Malawi marked the break-up of the Federation of the Rhodesias and Nyasaland. The East African High Commission also broke apart, as newly independent Uganda and Tanzania each sought to promote the growth of local industries, which tended to locate in Kenya. Throughout Africa, each newly independent country issued its own currency. Both English- and French-speaking countries regulated the flow of labor and capital across their boundaries. In addition, governments, especially those in southern Africa, adopted policies that fragmented transport networks. The effect of balkanization is clear in the data: the average African economy had a market size (GDP) only one-tenth that of the average OECD country in both 1950 and 1992. To make matters worse, most countries opted for import-substituting industrial policies, seeking to promote the formation of local manufacturing despite the small size of local markets, much as the new Latin American republics did in the nineteenth century.
International conflict added to the pressures for economic protection and the resultant segmentation of markets. Governments waging war need revenues, and customs duties were the most convenient source.
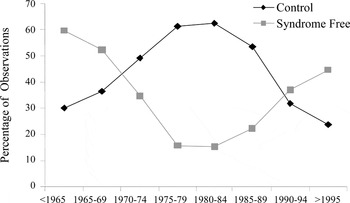
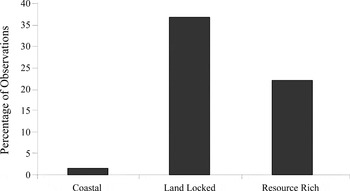
The aggressive antitrade and antimarket policies in Latin American meant that the continent failed to benefit from the boom in world trade between 1820 and 1870.Footnote 37 So too in Africa, where protected economies failed to exploit the world trade boom that started after 1950. Like Latin American regimes, postcolonial African governments adopted a mix of antitrade and antimarket policies, the most notable features of which were the movement to a closed economy, the regulation and promotion of industry, and the widespread use of price controls.Footnote 38 Prevailing economic doctrines, political commitments to socialism, and pressures for economic redistribution put a political premium on these interventionist policies. Indeed, governments adopted such policies in 60 percent of the cases by the mid-1970s (Figure 1).Footnote 39 Even Africa's coastal economies, which were spared civil war in the postimperial period (Figure 2), were subjected to these antitrade and antimarket policies. This fact may help explain their failure to emulate the growth performance of coastal economies in other parts of the developing world in the late twentieth century, especially those of Asia.Footnote 40
AFRICAN POLICY REGIMES OVER TIME

CIVIL WARS BY AFRICAN REGION, 1970–1995

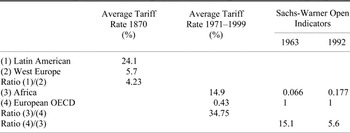
Table 5 offers some summary statistics confirming that both regions were highly protectionist, antiglobal, and had high tariffs (and export taxes). The average Latin American tariff rate in 1870 was about 24 percent, more than four times that of the European core.Footnote 41 Furthermore, Latin America relied heavily on customs duties as a source of revenue. The average share of customs duties in total revenues across 11 Latin American republics was 57.8 percent between 1820 and 1890.Footnote 42 Customs revenues were even more important for federal governments (65.6 percent). In the modern era, when nontariff barriers are often much more effective in reducing trade, the average African tariff rate was still almost 15 percent (1971–1991) vastly higher than for free-trade OECD. Postcolonial Africa scored, and postcolonial Latin America would have scored, extremely low on the Sachs-Warner openness index. In the case of Latin America, these negative antiglobal factors swamped the positive effects that should have come from the dissolution of imperial trade monopolies.Footnote 43
SUMMARY STATISTICS ON TARIFFS AND OPENNESS

Notes:
Latin America in 1870 includes Argentina, Brazil, Chile, Colombia, Mexico, and Peru. Africa in 1971–1999 includes Cote d'Ivoire, Ethiopia, Ghana, Kenya, Nigeria, South Africa, Tanzania, and Zaire. All regional averages are population weighted.
Source:
Tariff rates 1971–1999 are from World Development Indicators online. The Sachs-Warner open index includes five attributes of openness, including tariffs, black market foreign exchange rates, and trade as a share of GDP (Sachs et al., ”Economic Reform.”) Latin American 1870 tariff rates are from data underlying Coatsworth and Williamson, “Roots.”
The World Economic Environment
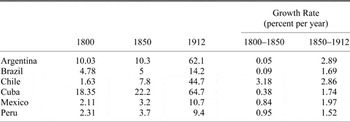
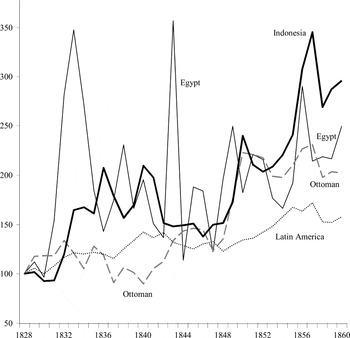
What about exports per capita, another measure of openness? Table 6 reports impressive growth rates in Latin America after the lost decades, averaging a little more than 2 percent per annum from 1850 to 1912. The half century before 1850 is quite a different story: except for Chile, the growth rates of exports per capita were below 1 percent per annum, and in three cases they were below 0.4 percent per annum. The source of low and stable exports was certainly not faltering world demand as during its lost decades Latin America shared in the spectacular secular terms-of-trade boom that favored all commodity exporting periphery regions.Footnote 44 True, Figure 3 suggests that Latin America had a less dramatic terms-of-trade boom than did the rest of the periphery, but over the four decades between 1820 and 1860 the ratio of export to import prices in Latin America rose by more than 50 percent.
LATIN AMERICAN EXPORTS PER CAPITA IN US DOLLARS, 1800–1912

Source:
For 1850, Coatsworth, “Economic and Institutional Trajectories,” p. 31. For 1800 and 1912, Bulmer-Thomas, Economic History, p. 37.
TERMS OF TRADE COMPARISONS ON THE UP-SIDE: THE PERIPHERY, 1820–1860 (1828 = 100)

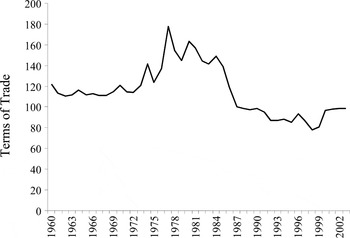
What about postcolonial Africa? Figure 4 presents a terms-of-trade series for sub-Saharan Africa from 1960 to 2003. Although the mid-late 1980s were certainly bad years for its commodity prices, Africa had 20 or even 40 years (if we reach back to 1940) of strong markets for its exports.Footnote 45 Clearly, explanations for Africa's and Latin America's lost decades cannot lie with poor world market conditions.
SUB-SAHARAN AFRICA TERMS OF TRADE, 1960–2003 (1987 = 10)

Violence and the Drift to Liberalism
Postcolonial violence and economic decline in both Africa and Latin America reduced state capacities and thus undermined economic strategies that required strong national governments. Yet, Latin America's civil wars and international conflicts also undermined many burdensome colonial institutions: caste systems, slavery, state monopolies, internal customs, trade regulations, heavily taxed urban consumption, state enforcement of the tithe, and archaic property rights in land (such as entail and mortmain).Footnote 46 Conservative governments attempted to revive elements of the caste system in Bolivia and Peru, but enforcement depended on indigenous collaboration, which soon evaporated. The slave systems had been undermined in Hispaniola and in those mainland colonies where independence leaders offered freedom to slaves who joined them (Bolivar in Venezuela and Columbia, San Martin in Argentina and Chile). Secularizing governments stopped enforcing the tithe. Entail (mayorazgo) was abolished when republican governments refused to recognize titles of nobility. Church property was disentailed, and when the Church resisted (as in Mexico), its properties were expropriated and sold. The hitherto inalienable lands assigned to indigenous villages and town councils (cabildos, ayuntamientos) were sold and efforts were undertaken to privatize public lands through auctions, grants, and colonization. Reforms of the property rights system culminated in new civil and commercial codes after mid century. Fiscal necessity (to finance conflicts) as much as ideology drove much of this activity, which was often accompanied by new tariff codes, fiscal reform, and the reorganization of judicial systems.
The net effect of these institutional changes was to liberate economic activity from a burdensome colonial legacy. In that sense, Latin America's civil wars and international conflicts of the postindependence decades had a modernizing impact. They undermined and made unenforceable both the state-sanctioned private privileges of the region's elites and the myriad internal taxes, regulations, and monopolies of the colonial regime. Thus, Latin America began drifting toward liberalism long before it became an ideology and a slogan.
Economic decline also undermined state-centered, antimarket strategies in Africa and set in motion the liberalization of economic policies. Governments had overvalued their currencies, undermined export incentives, and created incentives for smuggling. Because total public revenues relied so heavily on import and export taxes, they declined. In addition, governments that had regulated industries and imposed price controls created incentives for economic activity to shift to the informal economy, where it remained untaxed. This policy induced fiscal crisis and contributed to the collapse of political order. Furthermore, because governments had retained power by targeting economic benefits to powerful constituencies, the decline in public revenues led to a rise in political instability. When governments could not pay their military forces—or paid them in worthless currencies—soldiers began to pay themselves in kind by engaging in extortion and looting, giving rise to even higher levels of economic insecurity.
The rising African public debt was held by international financial institutions, particularly the World Bank, which by the late twentieth century had assumed a major portion of the costs of African government. The bank increasingly pressured governments to abandon policies that sought to override market forces and to adopt policies that harnessed market incentives.Footnote 47 Attempts to stabilize the political and economic fortunes of the state in Africa thus led to liberal policy reform: abandonment of public deficits, price controls, and government monopolies.Footnote 48Figure 1 depicts this movement toward liberal, free market reforms—what has been labeled “syndrome free” policies elsewhere.Footnote 49
Why Were the Lost Decades So Long?
Neither the premodern imperialists in Latin America nor the modern imperialists in Africa sought to create a social base for economic growth in their colonies. Thus, the forces making for a postcolonial Latin American liberal drift were successfully resisted by powerful settler elites for decades while proponents of liberal reform remained too weak to dislodge them quickly. In the most populous Latin American colonies, typified by Mexico and Peru, colonial elites resisted change because their class and ethnic interests linked them to the imperial regime. Colonial restrictions on economic activity had impeded the development of a business class sufficiently strong to overturn the privileges of the colonial elite. Furthermore, the civil strife that accompanied independence impoverished many businessmen who might have been inclined toward liberalism. In most large countries, liberals were also federalists, which made national governments even weaker.Footnote 50 Political stalemate and economic stagnation slowed, and at times even temporarily reversed, Latin America's decades-long drift toward liberalism.
The equally glacial drift toward African economic reform reflected the power of the same perverse equilibrium in which political actors may have understood the costs of antigrowth and antimarket policies but could not unilaterally abandon their commitment to them. Policies toward agriculture illustrate the point. Urban labor, industry, and the governments that represented them, all championed “low price” policies for basic foodstuffs. Through retail price controls, monopsony purchasing, and the opening up of domestic markets to foreign imports (which could be purchased with overvalued currencies), African governments sought to provide urban consumers with cheap food.Footnote 51 These policies raised real incomes for city workers, and lowered the own-wage of urban labor, thus supporting industrial profits. But these pro-urban policies undercut the profitability of agriculture (the largest sector of most African economies), and led inevitably to food shortages and diminished economic growth.
Although these policies imposed significant costs on African states, they endured for decades. No labor leader could afford to demand their reversal. And no political leader could champion policies that would, initially at least, raise the cost of living for urban consumers. As a result, the antigrowth policies remained in place throughout the lost decades. Eventually, they undermined the legitimacy of governments.
REFORM AND RECOVERY
Nearly everything changed in Latin America after the 1860s. First, there came political (and often military) victory of Liberal political forces that eliminated ethnic discrimination by the state, abolished slavery, separated church and state, put an end to archaic property rights in land, privatized public assets (especially land), abolished internal customs, and eliminated public monopolies. Second, long-term stability was secured in most cases by means of historic compromises among competing economic interests. Once conservatives accepted the new rules of the game, militarism and popular mobilization were replaced by governing arrangements that provided major domestic and foreign business groups secure access to influence. Third, the new political economy came to be embodied in modern civil and commercial codes, judicial reform and reorganization, new banking and insurance laws, renegotiation of domestic and external debts, tariff protection for industries in the larger economies, increasing public investment in physical infrastructure and security. Fourth, stability facilitated economic growth, which helped to cement the new political economy.Footnote 52 The GDP per capita growth rate was 1.8 percent per annum for Latin America between 1870 and 1913.Footnote 53 Economic growth was sustained by new investment, particularly foreign investment, which came first in response to government guarantees and subsidies (railroads, public works, banking), and then to exploit new opportunities in export production and industry.Footnote 54
These changes could not have been achieved in most Latin American countries without the conflict and bloodshed of the lost decades. Civil wars destroyed many of the colonial institutions that Liberals sought to abolish long before the fighting stopped. This destructive phase of institutional modernization facilitated the transition to a second more constructive phase in which governments discovered—often through trial and error over two or three decades—the institutional arrangements and policies most likely to encourage investment and growth. The new regimes succeeded in eliminating (or at least diminishing) the political participation of the rural poor. They centralized power in provincial and national capitals, away from villages and small towns. They also installed, or enforced more rigorously, property and literacy limits on the franchise. Political exclusion aided political stability and economic growth, but favored a less egalitarian society and government policies that maximized short-run returns on social overhead capital, and fostered the import of foreign investment, technology, and skills.Footnote 55 Still, most stable Latin American regimes of the late nineteenth century lacked the capacity or the incentives to create institutions that could credibly guarantee the property and civic rights of ordinary citizens or give priority to investments in human capital. Thus, institutions favoring inclusive development did not develop in Latin America after the lost decades were over.
In recent years, Africa has also experienced a decline in political conflict. While it continues on the Horn of Africa, the liberation wars in Southern Africa have come to an end, as have the civil wars in post-colonial Mozambique and Angola. Whereas Chad, Ethiopia, Somalia, Sudan and Zimbabwe are still torn by civil war, 14 others have dropped from that list, and, most recently, perhaps even Cote d'Ivoire.Footnote 56 In many—especially Cote d'Ivoire, Congo, Burundi, and Nigeria—peace remains fragile, but at least military conflict had stopped when this was written.
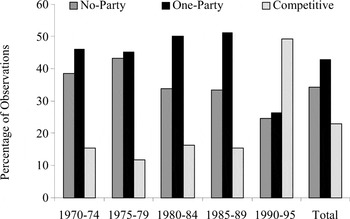
Unlike Latin America, where newly stable regimes worked to exclude majorities by restricting the franchise, Figure 5 shows that in Africa no-party (largely military) and single-party systems gave way to competitive party systems with universal adult suffrage during the period of democratic reforms in the 1990s. Policy reform followed political reform in Africa, with the abandonment of regimes that controlled the economy in favor of ones that regulated the economy less, produced fewer price distortions, and relied more heavily on market incentives.Footnote 57 That African political reform and policy reform should go together should not be surprising. Small holder farms faced high costs of organization, and so were ineffective lobbyists; but, being numerous, they constituted a large voting bloc. With the reintroduction of competitive party politics, that large voting bloc got voice, and leaders now had incentives to abandon the antigrowth policies that had imposed such heavy burdens on small holder agriculture for so long.
POLITICAL LIBERALIZATION IN AFRICA, 1970–1995

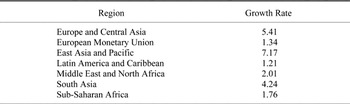
Just like Latin America in its late-nineteenth-century belle époque, modern Africa has also experienced a rise in the demand for its exports. Fueled by fast economic growth in Asia—China and India in particular, Africa now benefits from a growing demand for timber, oil, metals, and other primary products.Footnote 58 This and liberal reforms have yielded the first spell of positive rates of economic growth since the first decade of independence, more than 40 years ago (Table 7).
REAL GDP PER CAPITA GROWTH RATES, 2000–2005 (percent per year)

Source:
World Bank, World Development Indicators 2006.
HISTORICAL LESSONS FOR AFRICA'S FUTURE
The comparison we have offered suggests cautious optimism for Africa's future. One the one hand, Latin America finally emerged from its postindependence lost decades into a second half-century of impressive growth and political stability, and there are signs that Africa may emulate this experience. On the other hand, the social costs of the policies that led to this Latin American outcome were high, generating benefits for the few, more economic inequality, and political exclusion. If history repeats itself, Africa too can grow, but the danger is that the achievement of economic growth and political stability may come at the same high social cost.
The 1990s were marked by the rise of democracy and the overthrow of authoritarian regimes in Africa. Instead of single-party politics or military rule, multiparty politics prevailed in nearly 70 percent of the region by 1995. In addition, African governments increasingly adopted more liberal economic policies. The fall of communism, external pressures for policy reform, and the simple fact that governments wishing to remain in power had to compete for votes meant that they could no longer impose the policies they once had favored. Thus, an economic benefit accompanied the end of political conflict because much of Africa began to adopt more market-oriented and progrowth policies when expanding world markets were reinforcing Africa's improved economic performance. The rising demand for primary products from Asia's growing economies has helped spark a resumption of growth in twenty-first-century Africa just as an accelerating world industrial revolution helped create the belle époque for late-nineteenth-century Latin America.
But will Africa pay the same price for modern economic growth as did Latin America? Will the growth of exports, the abandonment of monopolies, and the promotion of markets also be accompanied by the rise of inequality and the consolidation of power by an oligarchic elite? There are signs of such a trend: the privatization of public assets in Africa has already led to their accumulation by the political elite. However, Africa is departing from Latin American history in two fundamental ways. First, there are no restrictions on the franchise in the emerging African democracies, whereas there certainly were such restrictions in most of late-nineteenth-century Latin America.Footnote 59 Second, recall that Africa's population is composed of a far larger share of indigenous people and a far smaller share of European settlers (and their descendants) than was true of Latin America 150 years ago. As a result of the vastly greater political weight of the indigenous population, the reform of private property rights to land, which could lead to concentration and inequality, remains off the political agenda in most of Africa, whereas it was central to the political agenda of the liberal regimes in late-nineteenth-century Latin America. Perhaps Africa will not have to pay the same social inequality price for modern economic growth that Latin America did following its lost decades.