I. Introduction
Many studies show that foreign capital plays a significant and positive role in spurring the development of emerging stock markets. For example, foreign capital helps to lower firms’ capital costs (Bekaert and Harvey (Reference Bekaert and Harvey2000)), spur economic growth (Bekaert, Harvey, and Lundblad (Reference Bekaert, Harvey and Lundblad2005)), facilitate cross-border mergers and acquisitions (Ferreira, Massa, and Matos (Reference Ferreira, Massa and Matos2010)), promote corporate governance (Ferreira and Matos (Reference Ferreira and Matos2008), Aggarwal, Erel, Ferreira, and Matos (Reference Aggarwal, Erel, Ferreira and Matos2011)), expedite global information transmission (Bae, Ozoguz, Tan, and Wirjanto (Reference Bae, Ozoguz, Tan and Wirjanto2012)), and improve price efficiency (Kacperczyk, Sundaresan, and Wang (Reference Kacperczyk, Sundaresan and Wang2021)). However, there are still two key open questions in the literature on foreign capital: whether and how foreign capital contributes to local price discovery and informational efficiency.
First, there is mixed evidence regarding whether foreign investors predict local stock returns and contribute to local price discovery. On one side, Kang and Stulz (Reference Kang and Stulz1997) show that holdings of foreign investors do not predict monthly stock returns in Japan, possibly because foreign investors tend to hold large-firm stocks that have low expected returns; Hau (Reference Hau2001) finds that foreigners have trading losses in Germany, suggesting that foreign investors face informational disadvantages caused by geographic barriers; Dvořák (Reference Dvořák2005) also shows that foreign investors perform poorly in Indonesia.Footnote 1 Conversely, Grinblatt and Keloharju (Reference Grinblatt and Keloharju2000) find that foreign investors display positive investment performance in Finland, possibly because foreign investors are more sophisticated than locals and possess informational advantages. A few studies focus on the predictive power of international capital flows at the market level but provide mixed results. For instance, Brennan and Cao (Reference Brennan and Cao1997) find that U.S. investors are disadvantaged in emerging markets, whereas Froot, O’Connell, and Seasholes (Reference Froot, O’Connell and Seasholes2001) show evidence on the opposite side.
Second, there is surprisingly little direct evidence on how foreign investors obtain their return predictive power, which would link their activities to local information efficiency. A few studies suggest that foreign investors might have informational advantages, but they only offer indirect evidence. For instance, Bailey, Mao, and Sirodom (Reference Bailey, Mao and Sirodom2007) find that foreign trades significantly increase during and after earnings announcements in Thailand, indicating that foreign investors might be able to process local information; Froot and Ramadorai (Reference Froot and Ramadorai2008) show that the responses to price and net-asset-value returns for closed-end country funds are roughly of the same magnitude, suggesting that cross-border flows are linked to fundamentals at the market level. Because there is no definite answer to whether foreign capital flows can predict local returns and there is no direct evidence of how foreign investors process local information, the fundamental mechanism of how foreign investors facilitate local stock price discovery and local information efficiency (Kacperczyk et al. (Reference Kacperczyk, Sundaresan and Wang2021)) appears unclear.
Our study fills in the blanks by directly examining whether and how foreign order flows predict firm-level returns in the cross section of local Chinese A-share market stocks with detailed, high-frequency trade data. To be exact, we utilize a proprietary data set of investors’ daily trading records from 2016 to 2019, which includes all foreign order flows at the stock level. This data set also provides data on order flows from local institutions, such as mutual funds, hedge funds, and others, which we use as benchmarks for comparison purposes. More importantly, we build a direct connection between trading with firm-level information events and the environment. The detailed nature of our data allows us to answer long-standing questions that are interesting and particularly important for the general international investment community. Meanwhile, given that the Chinese equity market is collectively the second largest in the world and plays an increasingly important role in global asset allocation, the relevance of the Chinese market is also significant in and of itself.
Before we move on to the empirical results, we briefly introduce the institutional background. Over the past 20 years, regulators from China, clearly recognizing the benefits of foreign capital, consistently invited foreign investors to participate in the development of the Chinese stock market. Three major channels were created to allow foreign capital access to domestic Chinese equity A-shares. First, the Qualified Foreign Institutional Investors (QFII) program, launched in November 2002, allows foreign institutional investors to trade equities and other financial instruments by converting foreign currencies into onshore RMB. Second, the Renminbi QFII (RQFII) program, introduced in December 2011, permits qualified overseas institutional investors to invest in the domestic capital market using offshore RMB directly. Third, and most recently, the Hong Kong Stock Connect (HKC) programs, linking the Hong Kong stock market with the Chinese mainland stock market, were launched in 2014. HKC enables Hong Kong and overseas individual and institutional investors to trade eligible Chinese A-shares. By the end of 2021, foreign investors held around RMB 3.67 trillion in A-shares through these channels, collectively accounting for 4.97% of A-share aggregate market capitalization.
First, we provide direct evidence of whether foreign capital flows predict local firm-level returns. Taking QFII as an example, we find that an interquartile increase in daily QFII order flow is associated with an 11.88 bps increase in the next day’s stock return (or 29.94% annualized), with a highly significant t-statistic of 17.03. When we turn to RQFII and HKC, an interquartile increase in daily order flows is associated with 3.05 and 7.57 bps increases, respectively, in the next day’s return (or 7.69% and 19.08% annualized). For comparison, an interquartile increase in daily local institutional order flow is associated with a 9.33 bps increase in the next day’s return (or 23.51% annualized). Taking these figures together, foreign investors’ trading activity significantly predicts future local stock returns, and their predictive power is on par with that of their local institutional counterparts. When we extend the prediction window from days to weeks, foreign investors significantly predict cumulative stock returns over at least the next 12 weeks, implying that the information in their trading flows is not transient.Footnote 2
There are alternative and nonexclusive hypotheses for foreign capital flows, including the diversification and liquidity hypotheses. As discussed in Van Nieuwerburgh and Veldkamp (Reference Van Nieuwerburgh and Veldkamp2010), the diversification hypothesis states that the capital flows from investors adopting diversification strategies in opening emerging markets have less return predictive power for future stock returns. The strong evidence of foreign capital flows’ predictive power for future returns does not support the diversification hypothesis. The liquidity hypothesis is more complicated. On the one hand, as discussed in Richards (Reference Richards2005), if foreign investors’ trading is persistent, their trading might generate price pressures, leading to higher future prices, consistent with a positive predictive relation between foreign capital flows and future returns. On the other hand, as suggested by Barrot, Kaniel, and Sraer (Reference Barrot, Kaniel and Sraer2016), if foreign investors’ trading follows a contrarian pattern, where foreign investors buy more when prices are lower, they provide liquidity to the market. They would be compensated by the subsequent positive returns to their buy orders. Our empirical results show that price pressures and contrarian trading from foreign investors might not be the main reasons for foreign investors’ return predictive power. Collectively, using detailed data heretofore unavailable to researchers, we provide definitive evidence that foreign capital flows predict local returns and contribute to local price discovery.
Next, given that foreign order flows strongly predict stock returns in the cross section, we build direct connections between foreign capital flows and firm-level information to understand whether foreign investors contribute to local informational efficiency. We build a broad data set on important firm-level information events, such as earnings announcements, analyst reports, and media news. We present clear evidence that foreign order flows significantly predict future firm-level news. Although the prior literature suggests that physical distance and language barriers may make it difficult for foreign investors to process local firm-level news, our results indicate that foreign investors seem able to process local firm-level information. In addition, we collect anecdotal evidence that foreign investors adopt effective strategies to overcome language and culture barriers. For instance, they are stationed in or close to China and hire the best local professionals to manage their portfolios.
Moreover, for firms with a better information environment, where information becomes more accessible to foreign investors and where information acquisition costs are lower, foreign investors with skills and resources may predict future stock returns even better. Using analyst coverage as a proxy for the information environment, we find that foreign investors have more substantial return predictive power on stocks covered by more analysts. We also provide evidence that foreign investors’ return predictive power is stronger for firms with more cross-border business, which indicates that foreign investors might have information advantages for firms more involved in global business networks. Finally, over our 4-year sample, Chinese regulatory authorities gradually relaxed the restrictions on foreign capital, allowing better access for foreign investors to participate in the Chinese stock market. Our empirical results suggest that expanding investment quotas and capital flows may contribute to foreign investors’ return predictive power (at least at the reform levels we observe). Overall, our study directly connects foreign capital flows’ predictive power to local firm-level information and the local information environment and provides direct evidence that foreign investors contribute to local informational efficiency.
In comparison with the existing literature, our article provides four new insights. First, our research contributes to resolving the ongoing debate about foreign investors’ return predictability by examining the return predictive power of foreign order flows with different hypotheses. Second, prior research examines whether foreign investors’ trading is informed indirectly. Using detailed transaction data and firm-level information, we connect foreign investors’ trading to various types of news and directly analyze whether foreign investors are informed about local informational events. Third, our data’s richness allows us to compare trading patterns between foreign investors and local institutions, improve on previous studies with a focus on overall institutional trading,Footnote 3 and provide a better understanding of overseas investors’ skills compared with domestic investors. Finally, we are one of the first studies to provide comprehensive evidence on the trading behavior of foreign investors in China—spanning QFII, RQFII, and HKC—and on their information content. A few studies on foreign investors in the Chinese stock market (e.g., Chen, Wang, and Zhu (Reference Chen, Wang and Zhu2024), Bian, Chan, Han, and Shi (Reference Bian, Chan, Han and Shi2023)) only focus on HKC investors with publicly available data.Footnote 4 Overall, our findings on the predictive patterns of various foreign investors and their information-processing skills are important for academic researchers, industry practitioners, and regulators.
II. Hypothesis Development
To guide our empirical analysis, we first develop hypotheses about whether foreign investors have return predictive power for cross-sectional stock returns. We measure foreign investors’ trading behavior by their order flows, which are widely used in studies on retail investors (Bailey, Cheung, and Wang (Reference Bailey, Cai, Cheung and Wang2009), Kelley and Tetlock (Reference Kelley and Tetlock2013), Barrot et al. (Reference Barrot, Kaniel and Sraer2016), and Boehmer, Jones, Zhang, and Zhang (Reference Boehmer, Jones, Zhang and Zhang2021)) and institutional investors (Hendershott et al. (Reference Hendershott, Livdan and Schürhoff2015)). Because the prior literature provides little direct evidence on the relation between foreign order flows and local stock returns, the answer to this question remains unknown. On the one hand, given the relatively low correlation with developed market returns, foreign investors may hold Chinese A-share stocks for diversification purposes. As suggested by Van Nieuwerburgh and Veldkamp (Reference Van Nieuwerburgh and Veldkamp2010), if investors follow a simple diversification strategy, they do not necessarily have an informational advantage and might be unable to predict future returns. Therefore, the diversification hypothesis suggests that foreign investors’ trade flows might not predict stock returns if they invest for diversification purposes. On the other hand, foreign investors are mostly attached to high-powered and well-resourced global institutions, and they might have considerable advantages in information processing. Albuquerque, Bauer, and Schneider (Reference Albuquerque, Bauer and Schneider2009) show that in a model where global investors possess valuable private information for trading in many countries, their trading flows are positively related to local returns. The information hypothesis implies that foreign order flows predict stock returns, particularly for those stocks on which foreign investors have significant informational advantages. Finally, foreign capital flows into the local market might affect the liquidity condition and lead to predictive patterns for future returns. On the one hand, as discussed in Richards (Reference Richards2005) and Ferreira, Matos, and Pires (Reference Ferreira, Matos, Pereira and Pires2017), persistent capital inflows from foreign investors are demand shocks for local stocks. They can generate price pressures and positively predict future returns. On the other hand, Barrot et al. (Reference Barrot, Kaniel and Sraer2016) show that investors can be compensated by providing liquidity in the market. If foreign investors supply liquidity by following a contrarian strategy, their order flows predict future returns and would be compensated for liquidity provision.
We summarize these competing hypotheses for foreign capital flows’ predictive power for future returns as follows:
Hypothesis 1a. (diversification hypothesis). Foreign capital flows do not predict cross-sectional stock returns in the Chinese A-share market if these investors mainly invest for diversification purposes.
Hypothesis 1b. (information hypothesis). Foreign capital flows predict cross-sectional stock returns in the Chinese A-share market if these investors are informed investors in Chinese firms.
Hypothesis 1c. (liquidity hypothesis). Foreign capital flows predict cross-sectional stock returns in the Chinese A-share market if these investors generate price pressures and/or provide liquidity to the local market.
Given that our later empirical results are more consistent with the information hypothesis and that one key open question in the literature is to understand the direct relation between foreign investors’ trading and firm-level information, our second hypothesis is developed around this question. We hypothesize that the strong predictive power of foreign investors for future returns might be rooted in their information collection and processing skills. If true, their order flows should predict firm-level news, such as earnings surprises, analyst updates, and media news. If not, foreign order flows should not predict firm-level news.
Hypothesis 2. Foreign capital flows can predict firm-level news.
Finally, we hypothesize that foreign investors’ return predictive power may be related to firms’ informational environment. On the one hand, according to Fernandes and Ferreira (Reference Fernandes and Ferreira2008) and Harford, Jiang, Wang, and Xie (Reference Harford, Jiang, Wang and Xie2019), firms with a better information environment may have more information available, and the information acquisition costs might be lower for these firms. Foreign capital’s predictive power may be stronger for firms with a better information environment. However, Easley, Hvidkjaer, and O’Hara (Reference Easley, Hvidkjaer and O’hara2002) and Easley and O’Hara (Reference Easley and O’hara2004) point out that firms with lower information risks also have lower compensation for information acquisition activities. If true, foreign investors’ return predictive power might be weaker on stocks with a better information environment.
Hypothesis 3. Foreign capital flows’ predictive power for returns is higher for firms with a better information environment.
By testing these hypotheses, we obtain general findings on foreign investors’ return predictive power in the local market, which are helpful for the general setting of the global capital market.
III. Institutional Background and Data
A. Foreign Investors in the Chinese Stock Market
Foreigners mainly invest in the Chinese onshore stock market through three programs: QFII, RQFII, and HKC. As investment channels for foreign capital, the three programs share common goals yet differ in several aspects, such as investor eligibility, investment scope, and capital control, which may lead to distinctive trading patterns in the Chinese stock market.Footnote 5
We summarize the key differences in Table 1. First, in terms of investor eligibility, QFII and RQFII include only foreign institutional investors, whereas HKC includes both individual and institutional investors from both Hong Kong and overseas areas. It is worth noting that foreign investors through QFII must meet certain thresholds on assets under management and operational durations. As a result, most of the QFIIs are large and renowned institutions in global capital markets, such as Barclays Bank and Goldman Sachs. In contrast, RQFII was created in 2011 to expedite offshore RMB business, and it was only available to Hong Kong subsidiaries of domestic financial institutions (such as China Asset Management HK) and foreign institutional investors (such as Fidelity HK).Footnote 6 Therefore, especially in its early stages, the RQFIIs include many institutions intending to spend offshore RMBs, rather than pursuing superior investment performance. The HKC program provides access for both institutional investors and retail investors, with international asset management companies (e.g., J. P. Morgan China A-share Funds) and overseas brokers backed by hedge funds being the main HKC investors, and retail trading accounting for only a small portion of the HKC program.Footnote 7 Given the small proportion of retail investors through the HKC program, we treat the HKC order flows as representative of institutional investors in later discussions.Footnote 8

Second, foreign investors from different channels are subject to different capital control regulations. For most of our sample, QFIIs and RQFIIs are subject to a 3-month lock-up period to promote long-term involvement. QFIIs can only repatriate investment principal and profits monthly, up to 20% of the previous year’s total assets. Capital inflow and outflow, however, are not a concern for HKC investors, meaning that they can more easily enter and exit the Chinese domestic market over short periods. Therefore, QFIIs and RQFIIs presumably have lower turnovers and focus more on long-term returns than HKC investors. In addition, there are investment quotas on individual QFII/RQFII/HKC investors and certain aggregate restrictions across all program participants. To lower the regulation costs on foreign investors, the quotas are generally set at relatively high numbers (and are often not binding).
Third, the eligible stocks differ across the QFII, RQFII, and HKC programs. QFIIs and RQFIIs can invest in all A-share stocks listed on exchanges, fixed-income securities, and other financial products. In contrast, HKC investors can only trade the constituent stocks of specific stock indices and the A shares with H shares listed on the Hong Kong Stock Exchange. The broad scope of financial instruments available for QFII and RQFII may attract large asset management companies with multi-asset investment demand and institutions that use derivatives to control risks or perform complex strategies. To ensure that foreigners do not own too large a share of A-share stocks, there is an upper limit in the sense that all three types of foreign investors combined cannot hold more than 30% of a firm’s total shares outstanding.
Because of these differences, foreign investors in the three programs may have different trading patterns and investment skills. Given the stricter eligibility requirements, tighter restrictions on capital flows, and broader investment scope, QFIIs are likely to be sophisticated investors, focusing on long-term performance and fundamentals. In comparison, given the capital controls, RQFIIs are also likely to be long-term investors. Still, they may be less sophisticated because many are Hong Kong subsidiaries whose primary goal is the absorption of offshore RMB. The HKC investors are not subject to strict capital controls and can trade more freely over short horizons, so their investment horizon could be shorter.
Figure 1 presents the regulation changes related to investment quotas, capital controls, and investment accessibility since 2002. Take QFII as an example. When the program was first introduced in 2002, the investment quota was less than $10 billion. It was progressively raised to $300 billion in 2019 and finally lifted. Regarding capital repatriation, in 2012, the total amount of funds a QFII remits monthly cannot be more than 20% of the investor’s total assets as of the preceding year’s end. In June 2018, the limitations were lifted. Additionally, QFII was required to allocate at least 50% of its portfolio into equities; however, in September 2016, that restriction was lifted. Overall, the market liberalization process offers us a unique opportunity to examine the impact of liberalization on the evolution of foreign investors’ behavior.
Figure 1 presents the key events during the development of QFII, RQFII, and HKC in the Chinese stock market. The first layer about investment quota is in black font, the second layer about capital control and local-up period is in green font, and the third layer about investment accessibility is in blue font.

B. Data
Our proprietary data set comes from a major Chinese stock exchange. It includes all foreign investors’ daily trading and holding from Jan. 1, 2016, to June 30, 2019, and is not publicly available. We obtain other stock trading data and financial accounting information from WIND, a widely used Chinese financial database. As in Liu, Stambaugh, and Yuan (Reference Liu, Stambaugh and Yuan2019), we exclude stocks with less than 15 nonzero volume trading days in the past month to eliminate the influence of long-trading suspensions. After merging investors’ trading information with the WIND data, we obtain a sample of approximately 1.1 million stock-day observations for over 1,200 stocks and 849 trading days.
For each stock each day, we collect buy and sell data for different groups of investors. Given that most foreign investors are institutional investors, we also collect information on local institutional investors to serve as a comparison benchmark. For our purposes, local institutional investors include mutual funds, hedge funds, insurance companies, security companies, trust companies, and other institutional investors. We rely on investor order imbalance data to measure their trading activities. Following Boehmer et al. (Reference Boehmer, Jones, Zhang and Zhang2021), we compute investor group G’s order imbalance for stock
 $ i $
on day
 $ d $
as follows:
 $$ Oib\left(i,d,G\right)=\frac{Buyvol\left(i,d,G\right)- Sellvol\left(i,d,G\right)}{Buyvol\left(i,d,G\right)+ Sellvol\left(i,d,G\right)}, $$
where
 $ Buyvol\left(i,d,G\right) $
and
 $ Sellvol\left(i,d,G\right) $
represent the total number of shares bought and sold by all investors within group
 $ G $
. The variable
 $ Oib\left(i,d,G\right) $
captures the trading direction of the investor group
 $ G $
for this stock, and its value varies between −1 and 1. A positive number means that a particular group of investors buy more than sell, and a negative number means that this group of investors sell more than buy. The order imbalance variable is set to missing when there is no stock trading on that day.
C. Summary Statistics
We present summary statistics in Table 2. Panel A reports foreign investors’ and local institutions’ trade and holding data. One special feature of the Chinese stock market is that retail investors contribute 80% of daily trading volumes over our sample period, so institutional investors, foreign and local, only account for about 20% of daily trading volumes. For average daily trading volumes, QFII, RQFII, and HKC investors account for 0.79%, 0.08%, and 2.24% of market daily volume, respectively, whereas local institutional investors account for 14.80%. These statistics indicate that QFII and HKC investors, as well as local investors, are relatively more active in trading, whereas RQFII investors tend to trade less frequently. The QFII, RQFII, and HKC investors trade 946, 174, and 561 stocks per day. Similar to trading, the holdings of the QFII, RQFII, and HKC investors account for 0.95%, 0.23%, and 1.20% of market floating capitalization, and the number of stocks held ranges between 744 for HKC and 1,261 for QFII.

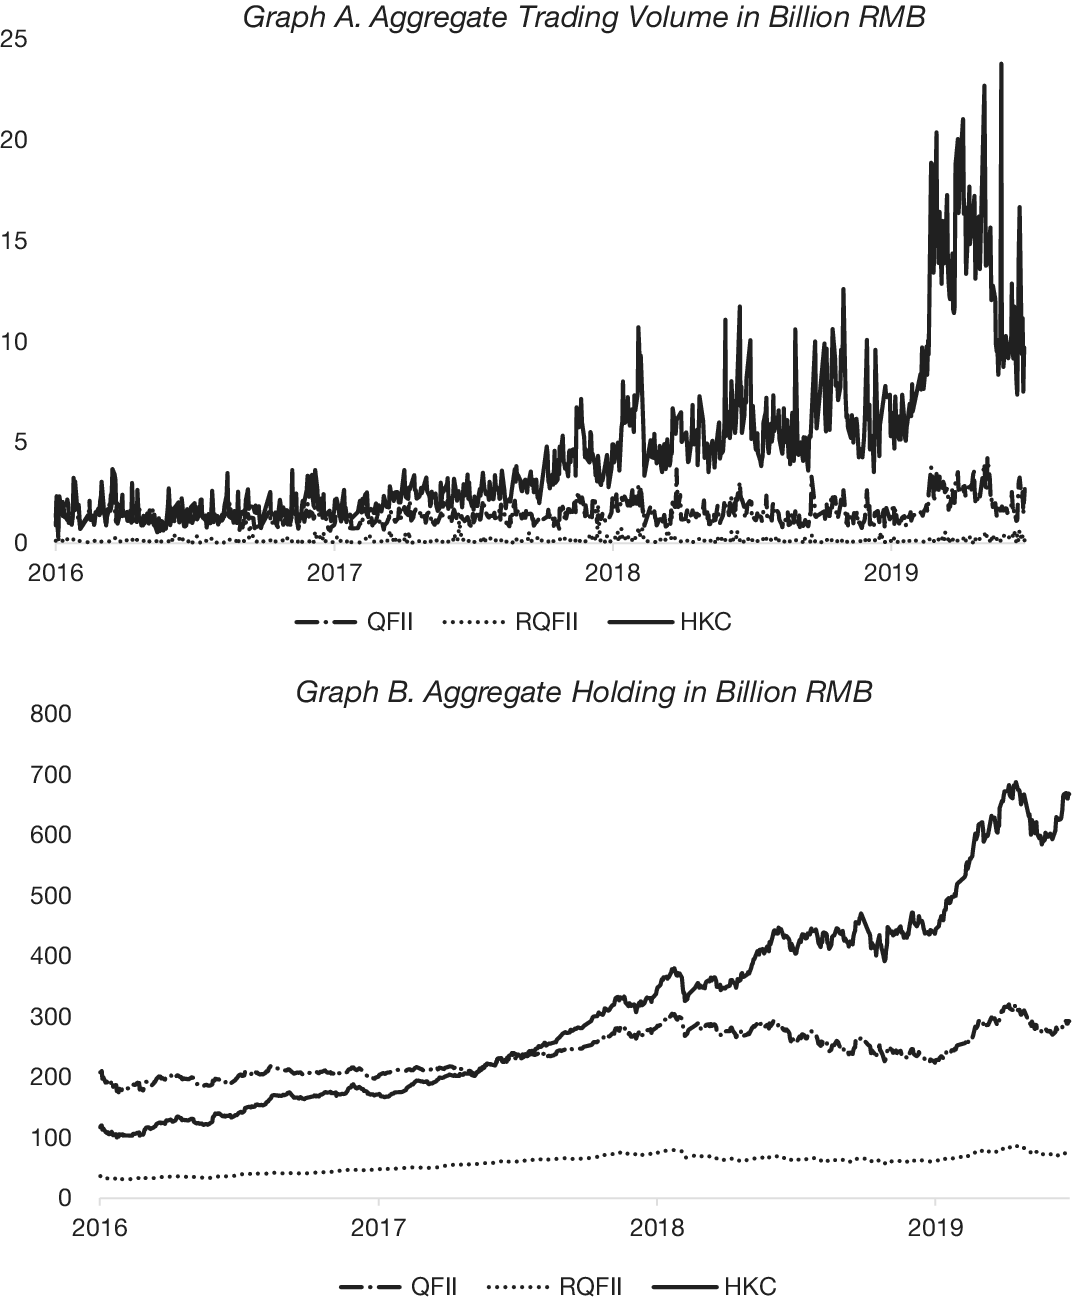
We report the time series of foreign investors’ aggregate trading and holding in Figure 2. The trading volume and holdings of QFIIs and RQFIIs are relatively stable. HKC becomes considerably more important over time, steadily increasing trading volume and holdings.
Figure 2 shows the time-series aggregate trading volume and holdings by QFII, RQFII, and HKC from Jan. 1, 2016, to June 30, 2019. Graph A shows the time-series aggregate trading volume in billion RMB. Graph B shows the time-series aggregate holdings in billion RMB.

Clearly, there are significant differences in the number of stocks traded and held by different groups of foreign investors. The low number of stocks for RQFII may result from their lower quotas and conservative strategies, whereas the lower number for HKC results from the scope of eligible stocks for investments. For our later empirical analysis, following Kelly and Tetlock (Reference Kelley and Tetlock2013), if for a particular stock, there is no trading from a particular group of investors on a particular day, then the observation is set to missing and is then dropped from our empirical estimation.Footnote 9 Given the nature of the raw data, we maximize the number of observations for our empirical analysis to best capture all nonmissing information in the raw data, and we always present the number of observations for each analysis. We also acknowledge the potential problem of comparability of coefficients across different groups, given the different number of observations, and therefore conduct robustness checks in Section V of this article, where we only include stocks with nonmissing data from all foreign investors, including QFII, RQFII, and HKC.
Since our study focuses on the cross-sectional trading behavior of foreign investors, Panel B of Table 2 reports the time-series average of cross-sectional statistics on the order imbalance measure. The means of order imbalance for QFII, RQFII, and HKC are, respectively, −0.01, 0.02, and 0.02, with standard deviations at 0.86, 0.82, and 0.58. For one individual stock, the trades may be concentrated in one direction, causing the order imbalance measure to take values close to 1 or −1, which leads to the relatively large cross-sectional variation in QFII and RQFII order flows. In comparison, the mean of the order imbalance for local institutions is −0.01 with a standard deviation of 0.47, indicating that domestic investors’ trading dispersion across stocks is smaller than that of foreign investors. The last column reports the cross-sectional mean of the first-order autocorrelation of the order imbalance measure. The coefficients are 0.09, 0.44, 0.12, and 0.18 for QFII, RQFII, HKC, and local institutions, respectively, which suggests that RQFIIs display a more persistent trading propensity than other investors. In the last 3 columns, we report the time-series average of the cross-sectional correlation coefficients for order imbalance measures across the four investor groups. The order imbalances of all investor groups are positively correlated, implying that trades from different types of investors may overlap to some extent. However, the correlations are generally lower than 0.14, indicating that investors’ trading behaviors differ across groups.
IV. Empirical Results
A. Understanding Foreign Investors’ Trading and Holding
We start our analysis by understanding foreign investors’ trading and holding dynamics. First, we link foreign order flows to firm-level variables, such as previous returns and firm characteristics. We adopt the 2-stage Fama–MacBeth (Reference Fama and MacBeth1973) regression method. For the first stage, for each day d, we estimate the following cross-sectional regression:
 $$ {\displaystyle \begin{array}{c} Oib\left(i,d,G\right)=a0\left(d,G\right)+a1\left(d,G\right) Ret\left(i,d-1\right)+a2\left(d,G\right) Ret\left(i,d-6,d-2\right)\\ {}\hskip5em +a3\left(d,G\right) Ret\left(i,d-27,d-7\right)+a4\left(d,G\right) Oib\left(i,d-1,G\right)\\ {}\hskip-5em +a5{\left(d,G\right)}^{\prime } Controls\left(i,d-1\right)+\epsilon \left(i,d,G\right).\end{array}} $$
The dependent variable
 $ Oib\left(i,d,G\right) $
is the order imbalance for stock
 $ i $
on day
 $ d $
for investor group
 $ G $
. To understand whether the foreign investors follow a momentum trading pattern or a contrarian pattern, we first include the previous stock returns over different horizons, where
 $ Ret\left(i,d-1\right) $
represents the previous day return,
 $ Ret\left(i,d-6,d-2\right) $
represents the previous week’s return, and
 $ Ret\left(i,d-27,d-7\right) $
represents the previous month’s return. Positive coefficients on past return variables indicate that foreign capital flows increase if previous returns are high and is typically referred to as a “momentum” trading strategy, potentially demanding liquidity. Negative coefficients on previous returns indicate that foreign capital flows decrease if previous returns are high and are referred to as “contrarian” trading, which potentially provides liquidity and is presumably rewarded. We also estimate the persistence of the foreign capital flows by including its own lag,
 $ Oib\left(i,d-1,G\right) $
. If the order flow is persistent, the coefficient would be positive and vice versa. For the control variables, we include the usual suspects: log firm size (
 $ Lnsize $
) from the previous month end, the firm’s earnings to price ratio (
 $ EP $
) as the ratio of most recently reported quarterly earnings to the market capitalization from the previous month end, and turnover (
 $ Turnover $
) as the ratio of monthly trading volume to floating A shares from the previous month end. From the first stage estimation, we obtain a time series of the cross-sectional coefficients
 $ \left\{\hat{a0}\left(d,G\right),\hat{a1}\left(d,G\right),\dots, \hat{a5}^{\prime}\left(d,G\right)\right\} $
. In the second stage, we compute the time series averages as
 $ \left\{\hat{a0}(G),\hat{a1}(G),\dots, \hat{a5}^{\prime }(G)\right\} $
, and conduct inference using the time series of these coefficients. The standard errors are calculated using the Newey and West (Reference Newey and West1987) methodology with 5 lags, the optimal lag number under the Bayesian information criterion.
The results are reported in Panel A of Table 3. We first focus on the coefficients on past returns. The coefficients on
 $ Ret\left(d-1\right) $
are −4.6313, −0.7709, −2.1991, and −1.8838 for QFII, RQFII, HKC, and local institutions, respectively, which means that over the 1-day horizon, all foreign investor groups and local institutions are, on average, contrarian. Interestingly, coefficients on
 $ Ret\left(d-6,d-2\right) $
and
 $ Ret\left(d-27,d-7\right) $
are significantly negative for QFII, but significantly positive for RQFII and HKC. That is, QFII investors constantly pursue a contrarian strategy, whereas RQFII and HKC investors follow momentum over longer horizons. Local institutions’ order flows are not significantly related to past returns over longer horizons. These findings share some commonality with earlier studies. For instance, Richards (Reference Richards2005) shows that foreign investors tend to be positive feedback traders in Asian emerging markets at the market level. Boehmer et al. (Reference Boehmer, Jones, Zhang and Zhang2021) find that marketable retail order flows in the United States follow contrarian strategies. We also find positive and significant coefficients on the lagged order flow variables for foreign investors and local institutions, implying that foreign investors’ trading is persistent and potentially generates price pressures, as in Richards (Reference Richards2005).

From the coefficients on control variables, we find that QFII, HKC, and local institutional investors prefer to trade stocks with higher EP ratios and lower turnover. The time-series averages of adjusted R 2 in the first-stage cross-sectional regressions are 8.67%, 17.88%, 7.15%, and 6.82% for QFII, RQFII, HKC, and local institutions, respectively, suggesting that past returns, past flows, and firm-level characteristics explain a significant portion of foreign investors’ trading in the cross section.
We estimate a parallel specification to understand the holding preferences of foreign investors, where we link foreign investors’ monthly holdings to 10 firm-level characteristics. Similar to equation (2), we first include past monthly returns, size, EP ratio, and turnover. In addition, following previous studies, such as Gompers and Metrick (Reference Gompers and Metrick2001) and Ferreira and Matos (Reference Ferreira and Matos2008), we include important firm characteristics related to their risk and profitability profiles, such as firm age (computed as the number of months since the stock was publicly listed), stock price level, dividend (computed as the cash dividends per share divided by stock prices at the end of the fiscal year), ROE (computed as the return on firm equity), volatility (computed as the variance of monthly returns over the previous 24 months), and leverage (computed as the total liability divided by total assets). Estimation results are reported in Panel B of Table 3. Consistent with the trading dynamics, foreign investors prefer to hold stocks with good past returns, large market capitalizations, and low turnover. In addition, they prefer stocks with low earnings-to-price ratios, high prices, long histories, high dividends, high profitability, low volatility, and low leverage. These findings are generally consistent with findings from previous studies.Footnote 10
B. Predicting Stock Returns Using Foreign Order Flows
To investigate the return predictive power of foreign order flows in the cross section as in Hypothesis 1, we also adopt the 2-stage Fama–MacBeth (Reference Fama and MacBeth1973) regression method. We use the daily horizon as an example and extend it to longer horizons. In the first stage, we estimate the following specification for each group G on each day d:
 $$ {\displaystyle \begin{array}{c} Ret\left(i,d\right)=c0\left(d,G\right)+c1\left(d,G\right) Oib\left(i,d-1,G\right)\\ {}\hskip10em +c2{\left(d,G\right)}^{\prime } Controls\left(i,d-1\right)+\epsilon \left(i,d,G\right).\end{array}} $$
The dependent variable
 $ Ret\left(i,d\right) $
is the dividend and split-adjusted daily return for stock
 $ i $
on day
 $ d $
, which is expressed as a percentage. The primary independent variable is investor type
 $ G $
’s order imbalance from the previous day,
 $ Oib\left(i,d-1,G\right) $
. For control variables, we follow the previous literature and include past stock returns and firm characteristics identical to those in equation (2). If a particular group G of foreign investors’ order flow correctly predicts future stock returns, we expect a significantly positive
 $ c1 $
. An insignificant
 $ c1 $
indicates no predictive power, and a significant and negative
 $ c1 $
implies that the foreign investors’ trades are, on average, opposite to future stock price movements.
1. Predicting Next-Day Return in the Cross Section
Panel A of Table 4 presents the estimation results of equation (3). For QFII, the coefficient on
 $ Oib $
is 0.0649 (t-stat = 17.03), implying that QFII’s order flow significantly and correctly predicts future stock returns. In terms of magnitude, given the interquartile of QFII order flow is 1.8295, when we move from the 25th to the 75th percentile, the next day’s return increases by 1.8295 × 0.0649 × 0.01 = 0.1188% (29.94% annualized).Footnote 11 In terms of RQFII and HKC, the coefficients on
 $ Oib $
are 0.0247 and 0.0783, both with significant t-statistics, corresponding to daily interquartile returns of 0.0305% and 0.0757% (7.69% and 19.08% annualized), respectively. These results support Hypothesis 1b or Hypothesis 1c, showing that, on average, all three types of foreign investors’ order flows correctly predict the next day’s stock returns with comparable interquartile returns.

We also examine whether the predictive power of foreign investors we document is comparable with that exhibited by local institutions. The coefficient on
 $ Oib $
for local institutions is 0.1330 (t-stat = 18.32), and the daily interquartile return is 0.0933% (23.51% annualized). Additionally, we compute the time series of the interquartile returns for each group of investors and compare whether their differences are significantly different from zero. That is, we multiply the time series of the estimated coefficients
 $ \hat{c1}\left(d,G\right) $
by investor G’s interquartile range of order flow and obtain the time series of interquartile returns. At the bottom of Panel A of Table 4, we report the average of the time-series interquartile return differences between different foreign investors and local institutions (the benchmark), with the t-statistics adjusted following Newey and West (Reference Newey and West1987) with 5 lags. The time-series average of the interquartile return difference between QFII and local institutions is 0.0255% per day (or 0.0255% × 252 day = 6.43% per year), with a t-statistic of 3.29. That is, the predictive power of the QFII order flows seems to be higher than that of the local institutions in terms of interquartile returns. The predictive power of RQFII and HKC order flows is significantly lower than that of local institutions, with daily differences in interquartile returns being −0.0626% and −0.0184%, respectively. This simple comparison shows that QFII has the highest interquartile returns, local institutions are second, HKC is third, and RQFII is the lowest.
For the control variables, we find significantly negative coefficients on
 $ Ret\left(d-6,d-2\right) $
and
 $ Ret\left(d-27,d-7\right) $
in most specifications, suggesting strong reversal patterns in stock returns over the weekly and monthly horizons. In our sample period, while the size effect is insignificant, we find that stocks with high earnings-to-price ratios exhibit larger future returns, consistent with the value effect. The coefficients on turnover are most negative, consistent with the hypothesis that high trading volume might be driven by speculation and lower future lower returns. The average adjusted R 2’s from the first-stage OLS regressions ranges from 8.83% to 14.75%.Footnote 12
2. Predicting Stock Returns over Longer Horizons
Given the strong 1-day prediction for stock returns, we examine whether the predictive power remains over longer horizons. We modify the benchmark regression in equation (3) by using weekly returns,
 $ Ret\left(i,w\right) $
, as the dependent variable, with
 $ w $
ranging from 1 to 12. For instance, when
 $ w $
equals 1,
 $ Ret\left(i,w\right) $
represents the cumulative stock return from
 $ d+1 $
to
 $ d+5 $
; when
 $ w $
equals 2,
 $ Ret\left(i,w\right) $
represents the cumulative return from
 $ d+1 $
to
 $ d+10 $
, and so on. The independent variable and the control variables are the same as those in equation (3). Standard errors are adjusted following Newey and West (Reference Newey and West1987), with lag numbers equal to 2 times the cumulative return days.Footnote 13 If foreign investors’ predictive power extends to longer horizons, a positive and significant
 $ c1 $
is expected.
Panel B of Table 4 presents the estimation results. To save space, we only report the coefficients on
 $ Oib $
and the implied interquartile cumulative returns. The statistical significance levels are denoted by asterisks, with ***, **, and * indicating significance at 1%, 5%, and 10%, respectively. Take QFII as an example; the coefficient for
 $ Oib $
is 0.1123 at week 1, and gradually increases to 0.2507 at week 12, with no sign of reversal. All coefficients differ from 0 at the 1% significance level, indicating that order flows from QFIIs significantly predict returns over longer horizons, and possibly their return predictive power is related to long-term information, such as firm fundamentals, rather than short-term information, such as temporary price pressure. The patterns are similar for RQFII and local institutions. For HKC, the coefficient climbs from 0.0985 in week 1 to 0.1874 in week 8, then declines to 0.1677 in week 12, indicating a slight price reversal. Furthermore, from week 9 to week 12, the coefficients become insignificant, indicating that information in HKC order flows might not be as long term as for QFII.
To compare the economic magnitude of the predictive power of various investors over longer horizons, we present the cumulative interquartile returns over the next 12 weeks at the bottom of Panel B of Table 4. For a heuristic understanding of the magnitudes and trends, we also directly plot the interquartile return differences predicted by the order flows from different investors in Figure 3. We observe the following three patterns. First, all 4 lines generally trend up and do not present major reversals over 12 weeks (except for a slight flattening pattern for HKC order flows), suggesting that the predictive power of foreign and local institutions’ order flows is lasting rather than transient. Second, the interquartile returns for QFII and local institutions are quite close to each other throughout the 12 weeks, and both are larger than those of RQFII and HKC. Our daily results in Panel A of Table 4 show that QFII seems to have greater interquartile returns than local institutions over the next day. From the bottom of Panel B of Table 4, this advantage of QFII over local institutions remains over week 1 but becomes statistically insignificant. For the next 11 weeks, the performances of QFII and local institutions are similar and do not exhibit differences with statistical significance. That is, the predictive power of QFII and local institutions is comparable over the 12-week horizon. Third, RQFII and HKC have lower predictive power than QFII, and between the two, HKC has stronger predictive power than RQFII over week 1; however, starting from week 2, RQFII performs better than HKC over the next 11 weeks. If we look across all three foreign capital channels, foreign investors’ performance differences are related to their institutional background. As QFII has the strictest eligibility requirements, the tightest restrictions on capital flows over longer periods, and the widest investment scope, they may disproportionately be large international institutions focusing on long-term investments. RQFIIs face similar regulation settings to QFIIs, suggesting that they may, too, largely be long-term investment institutions. However, RQFIIs may be somewhat less sophisticated because many are local institutions’ Hong Kong subsidiaries whose primary goal is to absorb offshore RMB. For HKC, cross-border flows are much easier and less restricted, which may attract more short-term investors and lead to lower long-term return predictive power of order flows.
In Figure 3, we present the cumulative interquartile returns and the two standard-deviation bands for foreign investors and local institutions over the subsequent 12 weeks. The cumulative interquartile returns are calculated as the interquartile of order imbalance multiplied by the coefficients of order imbalance in Panel B of Table 4. The standard errors are calculated following Newey and West (Reference Newey and West1987) with lag numbers of 2 times the cumulative return days. Panels A, B, and C represent QFII, RQFII, and HKC foreign investors, respectively. Panel D represents local institutional investors.

3. The Diversification and Liquidity Hypotheses
This section discusses the three alternative hypotheses regarding foreign investors’ return predictability. The diversification hypothesis (Hypothesis 1a) indicates that if foreign investors mainly pursue diversification strategies, then foreign capital flows should not predict local returns. Our finding that foreign investors strongly predict cross-sectional stock returns does not support Hypothesis 1a. In this section, we further examine whether foreign investors’ predictive power is related to the stock’s diversification benefit in the cross section. Everything else equal, the foreign capital’s predictive power might be weaker for firms with more diversification benefits because it is likely that foreign investors choose to invest in them for diversification benefits rather than other reasons.
Using monthly returns, we proxy the potential diversification benefits by the correlations between local stocks and the S&P 500 stock market index. Specifically, we compute the return correlations between stock
 $ i $
and the S&P 500 index using a rolling window of the previous 36 months with at least 24 nonmissing observations. We define a dummy variable
 $ HighDiv $
, which is set to 1 if the correlation for stock
 $ i $
in month
 $ m $
is below the cross-sectional median, and 0 otherwise. Finally, we interact our order flow variable on day
 $ d-1 $
with the dummy variable in the previous month
 $ m-1 $
and estimate daily Fama–MacBeth regressions as shown in equation (4):
 $$ {\displaystyle \begin{array}{c}Ret(i,d)=e0(d,G)+e1(d,G)Oib(i,d-1,G)+e2(d,G)Oib(i,d-1,G)\\ {}\hskip3.5pc \times HighDiv(i,m-1)+e3{(d,G)}^{\mathrm{\prime}}Controls(i,d-1)+\epsilon (i,d,G).\end{array}} $$
If foreign investors have less predictive power for stocks with more diversification benefits, we expect
 $ \hat{e2} $
to be negative. Panel A of Table 5 presents the results. We find that the estimated coefficients
 $ \hat{e2} $
are 0.0065, −0.0120, 0.0182, and 0.0046 for QFII, RQFII, HKC, and local institutions, respectively. These coefficients have mixed signs but are all insignificant, which does not support the diversification hypothesis.

Both the information hypothesis (Hypothesis 1b) and liquidity hypothesis (Hypothesis 1c) can be consistent with the strong and positive predictive power of foreign capital flows for future returns. Since our later discussions look further into the information hypothesis, we focus on the liquidity hypothesis in this section. The liquidity hypothesis has two parts. First, price pressure generated from persistent buy or sell orders can lead to positive predictive relations between order flows and future returns. Second, foreign investors’ contrarian trading strategies provide liquidity to the market, and they might be rewarded for liquidity provision, which also implies a positive predictive relation. Both parts are consistent with our empirical findings earlier in Sections IV.A and IV.B.
We rely on equation (2) to examine the liquidity hypothesis and follow Boehmer et al. (Reference Boehmer, Jones, Zhang and Zhang2021). We decompose the foreign order flows into multiple components related to contrarian, persistence, and others. The contrarian component is calculated as the estimated coefficient
 $ \hat{a1}\left(d,G\right) $
times
 $ Ret\left(i,d-1\right) $
,Footnote 14 the persistence component is calculated as the estimated coefficient
 $ \hat{a4}\left(d,G\right) $
times
 $ Oib\left(i,d-1,G\right) $
, and the residual component is the intercept plus the regression residual
 $ \hat{\epsilon}\left(i,d,G\right) $
. Then, we re-estimate equation (3) to assess the return predictive power of each of the above components. If foreign investors’ return predictive power comes from contrarian trading (liquidity provision), we expect significantly positive coefficients on the order flow components related to the contrarian component. Similarly, if foreign investors’ return predictive power comes from order persistence, we expect significantly positive coefficients on the order flow components related to the persistence component.
Panel B of Table 5 presents the decomposition results. The coefficient on the order flow variables related to contrarian trading for QFII is 0.3367, significantly different from 0, and the daily interquartile return for contrarian trading is 0.0475%, suggesting that liquidity provision contributes to the positive predictive relation between QFII flow and future return. However, the coefficients on contrarian components are −1.3243, −0.9796, and 0.0184 for RQFII, HKC, and local institutions, and none is statistically significant, implying that liquidity provision might not be important for their return predictability. For the price pressure hypothesis, we find that the persistence component has positive and significant coefficients for QFII and local institutions with daily interquartile returns of 0.1286% and 0.0861%, respectively, but it is not significant for RQFII or HKC. That is, we find mixed evidence for the liquidity provision and price pressure story.Footnote 15 Finally, the residual order flow component always positively and significantly predicts future stock returns, with daily interquartile returns of 0.1048%, 0.0271%, 0.0726%, and 0.0780% for QFII, RQFII, HKC, and local institutions, respectively, implying that a significant portion of foreign investors’ return predictive power might not be related to price pressure or liquidity provision.
Overall, our results suggest that price pressure and contrarian trading from foreign investors might not be the main reasons for foreign investors’ return prediction capacity. Our Hypothesis 1b suggests that information might be behind the positive predictive relation between foreign order flows and local returns, which we investigate in Section IV.C.
4. Foreign Order Flows Versus Local Order Flows
Our results thus far show that foreign investors, such as QFII, perform similarly to local institutions. Foreign and local investors may share overlapping information so that they trade similarly, leading to similar predictive patterns. They may also possess different information and display similar magnitudes of predictive power by coincidence. To find out whether the information is mostly overlapping or largely unique among different groups of investors, we orthogonalize each group’s order flow with respect to another group’s order flow and examine the residual’s predictive power for future returns. For instance, for each day d, we project foreign investors’ order flows onto local institutions’ order flows as follows:
 $$ Oib(i,d,{G}_{Foreign})=f0(d,G)+f1(d,G)Oib(i,d,{G}_{Local})+\epsilon (i,d,G). $$
We follow the previous literature (e.g., Kelly and Tetlock (Reference Kelley and Tetlock2013)) and drop missing observations in equation (5) in the regressions. After we obtain the time series of
 $ \hat{f1}(d,G) $
, we decompose the foreign order flow into two parts,
 $$ {\displaystyle \begin{array}{c}Oi{b}_{i,d,{G}_{Foreign}}^{overlap}=\hat{f1}(d,G)Oib(i,d,{G}_{Local}),\\ {}\hskip-3em Oi{b}_{i,d,{G}_{Foreign}}^{specific}=\hat{f0}(d,G)+\hat{\epsilon}(i,d,G),\end{array}} $$
with the first term being the overlapping component with local institutions and the second term being the foreign-specific component. After the decomposition, we re-estimate equation (3) by including both components. Similar procedures are followed to decompose local institutions’ order imbalance with respect to order flows from all three foreign investor groups.
Panel A of Table 6 reports the estimation results. For QFII, the coefficients on
 $ Oi{b}_{Foreign}^{overlap} $
and
 $ Oi{b}_{Foreign}^{specific} $
are 0.3553 and 0.0593, with t-statistics of 0.18 and 15.67, respectively, indicating that QFII’s predictive power primarily stems from foreign-specific information rather than from the overlapping component with the local institutional order flows. In terms of economic magnitude, the daily interquartile returns for overlapping and foreign-specific order flows are 0.0399% and 0.1034%, respectively, indicating that the foreign-specific information in order flow contributes more to QFII’s predictive power. Similar patterns are observed for RQFII and HKC, in that only the foreign-specific order imbalance displays significant return predictive power. In contrast, the pattern differs for local institutions, where the overlapping and local-specific components of order flows significantly predict future stock returns. In terms of economic magnitude, the interquartile return for the overlapping component is 0.0769%, somewhat smaller than the interquartile return of 0.1205% driven by the local-specific order flows.Footnote 16 If we combine these two components, the overall interquartile return is 0.1433% = (0.0399% + 0.1034%).

Alternatively, we also directly include both foreign capital flow and local foreign capital flow together, without orthogonalization, to assess the “incremental” predictive power of foreign capital flows in the existence of local flows. The results are reported in Panel B of Table 6. All coefficients—foreign or local—are positive and significant, suggesting strong predictive power for return from all foreign and local capital flows. Compared with those in Panel A of Table 4, the magnitudes of the coefficients are slightly smaller. For instance, the coefficient for QFII is 0.0649 in Table 4 and 0.0593 in Panel B of Table 6, both highly significant. These results suggest that all foreign capital flow variables have significant “incremental” predictive power for future returns, in the presence of a local capital flow variable.
Our finding that foreign-specific order flows contribute more to foreign investors’ return predictive power, especially for QFII, implies that foreign investors may possess unique informational advantages or have superior information-processing abilities in the local market. The results are also consistent with our previous findings that information may be a major reason for the return predictive power of foreign order flows. Next, we examine the information contained in the foreign order flows.
C. Firm-Level Information and Return Predictive Power
1. Foreign Order Flows and Earnings Announcements
In this section, we formally test Hypothesis 2 by examining whether foreign investors can predict firm-level news, using stock returns around these days. We separate firm-level news into pre-scheduled and unscheduled events. Our study includes firms’ earnings announcements as pre-scheduled events because publicly listed firms in China must disclose the earnings announcement dates on official websites designated by the regulator (CSRC). In contrast, analyst-related announcements and media news are considered unscheduled events.
We obtain earnings announcement data from WIND. Our sample includes 15,477 earnings announcements, accounting for 1.52% of all stock days in our sample. To investigate whether foreign investors process information on earnings announcements, we examine whether the order imbalance of foreign investors from the previous trading day predicts earnings news on the next day. The earnings news is computed using CARs over different horizons, by subtracting the same period market returns. Given that earnings are announced quarterly, and earnings news is not evenly distributed over calendar days, we modify the daily Fama–MacBeth setup to a quarterly horizon, where we first estimate the cross-sectional regression for each quarter q:
 $$ {\displaystyle \begin{array}{c}CAR(i,d,d+k)=h0(q,G)+h1(q,G)Oib(i,d-1,G)\\ {}\hskip15em +h2{(q,G)}^{\mathrm{\prime}}Controls(i,d-1)+\epsilon (i,d,G).\end{array}} $$
All controls are the same as in equation (3). After we obtain the quarterly coefficients, we calculate the time-series average and conduct inferences accordingly. If coefficient
 $ h1 $
is significantly positive, it implies that the previous day’s order imbalance predicts the future earnings news correctly, which would support Hypothesis 2.
Panel A of Table 7 presents the estimation results for equation (7). For the abnormal return on the event day 0, AR[0], the coefficient for QFII
 $ Oib $
is 0.0947, with a significant t-statistic of 2.61, suggesting that the previous day’s QFII order flows predict earnings news positively and significantly. When we extend the horizon to 2 days using CAR[0, 1], one quarter using CAR[0, 61], and 1 year CAR[0, 251], the corresponding coefficients are all significantly positive and the interquartile returns gradually increase to 0.5430%. We find similar but weaker results for RQFIIs and HKC investors. These results provide direct evidence that order flows from foreign investors contain information about firm earnings, which support Hypothesis 2. The local institutions in the last column display similar predictive patterns to those of QFIIs, but with larger magnitudes for longer horizons, indicating that local institutions might be better informed of local firms’ earnings news in the long run.

2. Foreign Order Flows, Analyst-Related Events, and Financial Media News
Besides scheduled earnings announcements, we examine whether foreign investors have an informational advantage for unscheduled news, such as analyst-related events and media reports. For analyst data, though CSMAR is a widely used analyst database (Dong, Fisman, Wang, and Xu (Reference Dong, Fisman, Wang and Xu2021), Chen, Ma, Martin, and Michaely (Reference Chen, Ma, Martin and Michaely2022)), its coverage is incomplete, particularly in earlier periods. Following the literature (e.g., Jia et al. (Reference Jia, Wang and Xiong2017), Li, Wong, and Yu (Reference Li, Wong and Yu2020)), we construct a comprehensive analyst sample from four major data providers: CSMAR, WIND, RESSET, and SUNTIME, focusing on forecast revisions and recommendation changes. Our sample includes 41,722 analyst-related events, accounting for 4.09% of all stock days in our sample.Footnote 17 For financial media news, which is shown to be important in previous literature such as Tetlock, Saar-Tsechansky, and Macskassy (Reference Tetlock, Saar‐Tsechansky and Macskassy2008), we collect financial media news data from the Chinese Research Data Service Platform’s Financial News Database (CFND), following Ge and Zhang (Reference Ge and Zhang2022). CFND gathers financial news from over 400 websites and 600 newspapers, including reports from the largest mainstream online financial media outlets, all written in Chinese. Our sample contains 353,551 media news days, accounting for 34.69% of total observations.
To investigate how foreign investors’ return predictive power relates to analyst-related and financial media news, we re-estimate the quarterly Fama–MacBeth regression as in equation (7) but use the cumulative abnormal returns around analyst reports or financial media news release dates. If foreign investors are informed, we expect significant and positive coefficients on the previous day’s order flow.
Panel B of Table 7 presents the results for analyst-related events. Take QFII as an example. We find that foreign investors can predict abnormal returns on analyst report release days, with a coefficient of 0.0746 and a t-statistic of 3.33. The significant return predictive power can extend to 1 year CAR[0, 251], with a coefficient on order flows of 0.5705 and a t-statistic of 2.59. Panel C presents the estimation results for media news. Similarly, the coefficients on order flows are 0.0789 and 0.5475 for AR[0] and CAR[0, 251], with t-statistics of 5.83 and 6.30. Similar patterns hold for RQFII and HKC investors. Overall, these results imply that foreign investors’ order flows contain information about analyst-related activities and media news, which also supports Hypothesis 2.Footnote 18, Footnote 19
We are curious about how foreign investors overcome potential informational disadvantages and present strong predictive power for future firm-level news. From anecdotal evidence, we find that many foreign institutions establish offices near Mainland China, like Hong Kong, to narrow information asymmetry induced by geographical distance. In fact, according to the State Administration of Foreign Exchange, around 25% of QFIIs and 43% of RQFIIs are located in Hong Kong. Meanwhile, many foreign institutions hire managers of Chinese ethnicity or with significant Chinese working experience to overcome cultural and regulatory barriers. For instance, J. P. Morgan asks research associates for China-related roles to obtain “all necessary CSRC licenses”; BlackRock searches for VPs for equity research with “5–10-year China equity market experience, preferably in leading financial institutions”; and Goldman Sachs directly asks for “strong communication skills in Chinese (written and verbal).”
D. Information Environment
In this section, we investigate whether improvements in the information environment contributes to foreign investors’ return predictive power, as suggested by Hypothesis 3. When information becomes more accessible to foreign investors, foreign investors with skills and resources may face lower information barriers, and they may be able to better predict future stock returns.
Chinese firms are important participants in the global supply chain as suppliers. Further, consumers and foreign investors may be more familiar with the fundamentals of firms that conduct significant cross-border business activities. Comparatively speaking, the information environment is better, from the perspective of foreign investors, for firms with more overseas activities. We define the variable
 $ Overseas $
as the absolute value of the ratio of overseas income to overall revenue. We then investigate the relation between foreign investors and firms engaged in cross-border business in 2 steps. First, we use Fama–MacBeth regressions, similar to equation (2), to investigate how foreign investors’ stock holdings relates to firms’ exposure to overseas business, with foreign holding in month m is the dependent variable and
 $ Overseas $
is the key independent variable. A positive coefficient on
 $ Overseas $
suggests that firms with higher overseas revenue attract more foreign investors. Second, we use daily Fama–MacBeth regressions as shown in equation (4) to investigate how overseas business relates to foreign investors’ return predictive power, replacing
 $ HighDiv $
with
 $ Overseas $
. A positive coefficient on the interaction term indicates that foreign investors better predict stock returns for firms with a higher proportion of overseas income.
Panel A of Table 8 presents the estimation results for firms with overseas business. For foreign holdings, we find that the coefficients of
 $ Overseas $
are 0.0015, −0.0005, 0.0007, and 0.0107 for QFII, RQFII, HKC, and local institutions, respectively. Only the coefficients for QFII and local institutions are statistically positive, indicating that enterprises with an intense exposure to international business have a high level of ownership by QFII. In terms of the return prediction, the coefficients on the interaction are positive, ranging between 0.0261 and 0.0690, with statistical significance for QFII and HKC at the 95% confidence level. The results show that the predictive power of foreign order flows is stronger for firms with greater levels of overseas activities. Our results are also consistent with findings in Wang, Yu, and Zhang (Reference Wang, Yu and Zhang2023), which show that the presence of foreign investors with informational advantages significantly reduces the firms’ information management behavior related to overseas operation events, which become much difficult to access by domestic investors following Google’s unexpected withdrawal from mainland China in 2010.

Bae, Bailey, and Mao (Reference Bae, Bailey and Mao2006) and Harford et al. (Reference Harford, Jiang, Wang and Xie2019) demonstrate that analysts make efforts to produce information, and high analyst coverage should improve the transparency of corporate information. Following the literature, we use analyst coverage to assess the information environment, where
 $ Coverag $
e is the logarithm of 1 plus the number of analysts. We repeat the 2-step analysis and present the results in Panel B of Table 8. For foreign holdings, we find positive and significant coefficients on
 $ Coverage $
for both foreign investors and local institutions, meaning that firms with high analyst coverage have high foreign ownership. In terms of return prediction, the coefficients on the interaction between
 $ Oib $
and
 $ Coverage $
are all positive, implying that investors’ return predictive power is higher for stocks with higher analyst coverage or a better information environment. However, the coefficients on the interaction terms are significant for HKC and local institutions but not for QFII or RQFII. Our findings suggest that improvement in the information environment might contribute to foreign investors’ predictive power on cross-sectional stock returns, supporting Hypothesis 3.
Finally, we consider the top shareholder holdings as another candidate metric of the information environment. Fan and Wong (Reference Fan and Wong2002) demonstrate that concentrated ownership imply poor minority shareholder protection, resulting in agency conflicts between major shareholders and outside investors, low trust in earnings information, and severe information asymmetry. We define
 $ TopHolding $
as the top shareholder’s holding shares divided by the total outstanding, with lower top shareholder ownership indicating better firm-level information. Panel C of Table 8 shows the results. For foreign holdings, the coefficients on
 $ TopHolding $
are negative for all foreign investors, but significant for QFII, HKC, and domestic institutions. This indicates that firms with lower ownership from the top shareholder attract higher foreign investors’ holdings. In terms of return prediction, for QFII, the coefficient on the interaction between
 $ TopHolding $
and the previous day’s order flow is −0.0422, with a t-statistic of −2.31, meaning that foreign investors exhibit stronger return predictive power on stocks with lower ownership from the top shareholder. The pattern does not hold for RQFII and HKC. Our findings support Hypothesis 3 that foreign investors, QFII in particular, exhibit elevated return predictive power under a better information environment.
Overall, we provide suggestive evidence that improvements in the information environment may compensate for foreign investors’ disadvantages in the local market and lead to comparable performance between foreign and local institutions regarding firm-level return prediction.Footnote 20
V. Further Discussion and Robustness
A. The China Setting
In this section, we turn to the question of what specific factors contribute to foreign investors’ return predictive power in China instead of other emerging markets. Extant research indicates that information asymmetry may explain the performance differences of foreign investors across markets. Classic theory (Grossman and Stiglitz (Reference Grossman and Stiglitz1980)) suggests that investors expend resources to become informed only when the expected benefits outweigh these costs. The ingredients describing this tradeoff vary significantly across both markets and time; hence, the mixed outcomes across the academic literature may underscore the fact that the benefits of costly information acquisition hinge on market conditions.
In the spirit, China’s market evolution has likely altered the cost–benefit tradeoff of gathering firm-specific information for foreign investors. In earlier decades, foreign institutions often faced prohibitively high information costs, from language barriers and scarce, reliable data to limited on-the-ground research access, potentially deterring deep firm-level analysis. More recently, the growth of financial databases, improved analyst coverage of Chinese firms, and better corporate governance have lowered information-gathering costs. In essence, the Chinese market may now offer an environment where the expected cost of being informed is low relative to the expected benefit, potentially incentivizing global investors to establish local research teams, invest in data analytics, and develop expertise on Chinese stocks.
To gauge this possibility, we rely on the existing literature for proxies of the information environment. Bae et al. (Reference Bae, Bailey and Mao2006) demonstrate that a high degree of market openness to foreign equity investors is associated with transparency. Ferreira et al. (Reference Ferreira, Matos, Pereira and Pires2017) suggest that foreign investors have low predictive powers in markets characterized by weak shareholder protection and opaque financial disclosure. Therefore, we collect the prevalence of foreign ownership index from the World Economic Forum, the shareholder rights index from the World Bank, and the strength of auditing and accounting standards index as three market-level proxies.Footnote 21 We present the time series of these variables for China and the average of emerging markets in Figure 4.
Figure 4 shows a time series of market-level indicators for China and developing markets. Graph A plots the World Economic Forum’s prevalence of foreign ownership index, with 1 representing highly rare foreign ownership in local firms and 7 indicating extremely prevalent foreign ownership. Graph B plots the extent of shareholder rights index from the World Bank, which evaluates shareholders’ roles in critical corporate decisions (0 = less rights; 6 = more rights). Graph C shows the World Economic Forum’s auditing and accounting standards index, with 1 representing extremely weak financial auditing and reporting standards and 7 indicating exceptionally good standards.

The figure clearly shows two patterns. First, the overall quality of the Chinese information environment is below the average emerging market. Second, there is a gradual improvement in these proxies over the years. In fact, we conduct a time-series trend test in Panel A of Table 9, and document significant and positive trends in the prevalence of foreign ownership and shareholder rights. Given these positive trends in improvements of the information environment, the cost–benefit tradeoff may now tilt toward foreign institutional investors acquiring and trading on cost information in China. As discussed above, we provide firm-level evidence within China in Section IV.D. The results suggest that an improved information environment, using several proxies, is associated with increased foreign ownership and greater return predictive power from foreign investors.

While exploratory, our analysis suggests that the informed returns of foreign investors in China that we document may be rooted in traditional economic mechanisms—lower information costs, better governance, and liberalized access, consistent with information-theoretic expectations. We do not assert that foreigners will consistently outperform locals; instead, we highlight how changes in the informational landscape have empowered foreign investors in the recent period examined. Looking ahead, this advantage may evolve as market conditions change. As more foreign and domestic institutions become informed and competition intensifies, the excess returns to any one group’s information advantage should diminish.
B. Regulation Changes
China gradually relaxed regulations on foreign investors during our sample period. These reforms mainly focus on three aspects: extending access to international investors, boosting quotas or removing position limitations for foreign investments, and relaxing the requirements of lock-up periods. On the one hand, fewer restrictions on foreign capital may lower the potential cost of foreign investment and attract more sophisticated overseas investors, thereby enhancing foreign investors’ overall return prediction capacity. On the other hand, it is also likely that when a quota increases, foreign investors’ portfolios may become less profitable as they turn to less compelling strategies, lowering their overall predictive power. According to Bae et al. (Reference Bae, Bailey and Mao2006), increased market liberalization is associated with a better information environment; we expect that foreign capital flows’ predictive power for returns is higher when regulation is friendlier toward foreign investors.Footnote 22
To examine the hypothesis, we regress the time series of estimated coefficients
 $ \hat{c1}\left(d,G\right) $
from equation (3) on a series of regulation dummies as in equation (8):
 $$ \hat{c1}(d,G)=j0(G)+j1{(G)}^{\mathrm{\prime}}Regulations(d-1)+\epsilon (d,G). $$
If the hypothesis is true, foreign investors’ predictive power increases after a particular regulation change, implying positive values of the coefficient vector
 $ j1(G{)}^{\mathrm{\prime}} $
. In Panel B of Table 9, we find no significant relation between policy relaxation and QFII/RQFII return predictive power. Interestingly, the coefficients on regulation dummies for HKC are positive and significant, indicating that HKC has more cross-sectional predictive power following investment quota extension. These results indicate that quota relaxation effectively boosts foreign capital flows’ predictive power. However, we acknowledge that it is quite difficult to convincingly link return predictability in one time period to the degree of market liberalization, especially when a host of things can change over time.
C. Counterparties
China remains a retail-dominated market, and it is important to understand against whom foreign investors trade in China: local retail investors or local institutions. Given the findings in Jones et al. (Reference Jones, Shi, Zhang and Zhang2025) that smaller retail investors’ trading activity negatively predicts future stock returns, it is interesting to examine whether foreign investors disproportionately trade against local retail investors. To answer this question, we separate counterparties into foreign investors, local institutions, and retail investors (RT). Next, based on the daily order imbalance measure, we separate investor groups’ daily trade directions into buy (B) and sell (S). With the three groups of investors and the two sides of each trade, all stock-day observations are separated into six bins: BBS, SSB, BSS, SBB, BSB, and SBS, with the first letter indicating the trade direction of foreign investors, the second for local institutions, and the third for retail investors. Take QFII as an example. QFII trades mostly line up with the local institutions (53% of the time), and mostly against local retail investors (61% of the time). Similar patterns hold for RQFII and HKC.
To examine whether foreign investors’ return predictive patterns change with different counterparties, we estimate daily Fama–MacBeth regressions as shown in equation (9):
 $$ {\displaystyle {\displaystyle \begin{array}{c}Ret(i,d)=l0(d,G)+\left[{\sum}_{k=1}^6l1(k,d,G)\ast I(k,d,G)\right]Oib(i,d-1,G)\\ {}\hskip-3.3em +l2{(d,G)}^{\mathrm{\prime}}Controls(i,d-1)+\epsilon (i,d,G).\end{array}}} $$
The indicator variable
 $ I\left(k,d,G\right) $
is equal to 1 if trading from foreign investor group G for stock i on day d – 1 falls in the kth counterparty bin, and 0 otherwise. Panel C of Table 9 presents the estimation results. Take QFII as an example. When they trade on the same side with local institutions and on the opposite side of local retail investors, as in the bins of BBS and SSB, the coefficients are positive and significant, indicating that both foreign and local institutions have an informational advantage over local retail investors. There are also cases when foreign investors trade differently from local institutions, but they still significantly and positively predict future returns, as in SBB and SBS. The results are consistent with our main findings that foreign investors may possess specific informational advantages in the local market relative to local institutions. Similar patterns also hold for RQFII and HKC.
D. Account Performance of Foreign Investors
Does the significant predictive power of foreign order flows lead to strong investment performances? We define the total cash flows for foreign investor groups as the sum of the capital gain from holdings plus trading proceeds minus transaction costs. Following Barber, Lee, Liu, and Odean (Reference Barber, Lee, Liu and Odean2009), we further decompose the total cash flow into stock selection, market timing, and transaction costs. Intuitively, the stock selection component captures whether investors can perform better by actively selecting stocks that outperform the stock market. The market timing component captures whether the investors can strategically make investment decisions based on the relative performance between the stock market portfolio and the risk-free asset, and, thus, time the market. Finally, we add all the daily gains from the sample and compute the annual performance. To understand the return percentage of investment, we divide the account gains by the aggregate holding values from the previous period and compute the annualized statistics. To save space, we present the details in Supplementary Material Appendix IA.IV.
Panel D of Table 9 presents the results. The annual gains for QFII, RQFII, HKC, and local institutions are 40.48, 11.97, 60.62, and 376.58 billion RMB, respectively. The annual returns for QFII, RQFII, HKC, and local institutions are 17.79%, 20.81%, 17.73%, and 10.22%, respectively, suggesting notable return performance in each case. In terms of the decomposition, the stock selection component accounts for the majority of realized investor performance. In contrast, the market timing performance component is all negative, suggesting that all these investors might have better skills in stock selection than market timing. These findings are consistent with earlier studies, such as Barber et al. (Reference Barber, Lee, Liu and Odean2009) and Jones et al. (Reference Jones, Shi, Zhang and Zhang2025).Footnote 23
E. Robustness Checks
We perform multiple robustness tests to ensure that our results are not sensitive to data treatments. In the main results, we do not include observations in the regressions with missing order flow values. In this case, one may be concerned about comparability issues if the number of observations differs across investor groups. Here, we consider several alternatives. First, we require nonmissing order flows from foreign and local investors at the stock-day level, leaving us with 104,111 observations. Then, we estimate 1-day and long-term return prediction regressions as in equation (3) and present the results in Panels A and B of Table 10, respectively. We find that foreign order flows still significantly predict local stock returns over short and long periods, consistent with the findings in Table 4.

Second, we replace missing order flow variables with zeros and estimate 1-day return prediction regressions. In Panel C of Table 10, we find positive and significant coefficients on order flows for foreign and local investors, meaning that foreign investors predict local stock returns. However, owing to smaller interquartile ranges with zero order flows, the interquartile returns are lower than the figures in Panel A of Table 4.
One concern regarding Chinese trading data is that price limits are constantly met, accounting for 1.71% of total observations in the sample. To ensure that our results are robust, we remove all stock-day observations when price limits are hit on d – 1 and re-estimate the daily return predictive regressions. The results in Panel D of Table 10 show that foreign order flows still have significant return predictive power for stock daily returns when stock prices do not hit price limits. For instance, the coefficient on
 $ Oib $
for QFII is 0.0707 with a t-statistic of 18.88.
To test the robustness of our results for an alternative estimation timeline, we skip day d and examine whether foreign investors’ order flows on day d – 1 predict stock returns on day d + 1. From the results in Panel E of Table 10, the coefficients on order flows are 0.0399, 0.0181, 0.0414, and 0.1043 for QFII, RQFII, HKC, and local institutions, respectively, and all are statistically significant.
In Table 6, we compare the prediction of foreign and local investors by orthogonalization and by including local capital flows as control. Here, we conduct a horse race estimation by including order imbalances from all four investor groups in one regression to predict the next day’s return. One caveat of this approach is that all order flow variables need to have a nonmissing value for the stock on that day, a restriction that then excludes more than 90% of our sample. The results in Panel F of Table 10 show positive and significant coefficients on order flows from QFII, RQFII, and HKC investors, implying that foreign investors have “incremental” return predictive power relative to local institutions. Overall, we still find that foreign investors have significant return predictive power on local stocks across these four robustness tests.
VI. Conclusion
Using a comprehensive proprietary data set, we investigate whether foreign order flows predict cross-sectional stock returns. We find that foreign investors predict future stock price movements over both short and longer horizons, and the magnitude is comparable across foreign and local institutions. When relating their predictive power to firm-level information, foreign investors successfully predict firm-level earnings, analyst, and media news. Contrary to most previous studies, the evidence suggests that foreign investors are not at an informational disadvantage and have some ability to process firm-level information. Finally, to explain how foreign investors process local firm-level news, we show that improvements in the information environment, investment in firms with cross-border business activities, and stock market liberalizations can facilitate foreign investors’ return predictability in the cross section.
These findings have important implications for policymakers and researchers. Regulators should promote the development of price discovery and financial market efficiency by examining how to take advantage of foreign investors’ relative abilities.
Supplementary Material
To view supplementary material for this article, please visit http://doi.org/10.1017/S0022109025102081.
Funding Statement
We acknowledge financial support from the National Natural Science Foundation of China (Grants 72350710220, 71790605) and Beijing Natural Science Foundation (Grant IS23127).