


1 Introduction
The successful control of vortex structures is critical in the field of modern aerodynamics, with automotive and aerospace applications becoming increasingly reliant on vortices to improve aerodynamic efficiency. Knowledge of how streamwise vortex interactions behave as they propagate downstream is essential to designing systems to control these flow structures. Turbomachinery blade interactions, aircraft taking off in succession, wind turbines and vortex generators can all produce multiple streamwise vortices in close proximity to each other (Hummel Reference Hummel1995; Pereira, Hirata & Filho Reference Pereira, Hirata and Filho2004; Forster & White Reference Forster and White2014; Manolesos & Voutsinas Reference Manolesos and Voutsinas2015; Toloui, Chamorro & Hong Reference Toloui, Chamorro and Hong2015). These vortices may be desirable (flow control, heat transfer) or undesirable (aircraft wake vortices). Streamwise vortex/structure interactions have been studied considerably less than either parallel or normal vortex/structure interactions (Garmann & Visbal Reference Garmann and Visbal2015), particularly relating to the effects of the upstream vortex migration. In previous work both vortices of a vortex pair have been typically deployed from the same streamwise location (Devenport, Zsoldos & Vogel Reference Devenport, Zsoldos and Vogel1997; Rokhsaz & Kliment Reference Rokhsaz and Kliment2002), limiting the study of their interactions at extremely close core spacings. These close interactions are important conditions to understand in order to provide a knowledge base for practical vortex applications, where upstream vortices may move in locations on either side of a vortex producing obstacle, such as a wing or vane.
Interacting pairs of streamwise vortices can be classified into either counter-rotating or co-rotating configurations. Both co-rotating and counter-rotating vortex pairs exhibit instabilities when placed in close proximity including long wavelength (Crow Reference Crow1970) for counter-rotating pairs, short wavelength (elliptic, Leweke, Le Dizès & Williamson (Reference Leweke, Le Dizès and Williamson2016)) for counter-rotating and co-rotating pairs and spiral (Gordnier & Visbal Reference Gordnier and Visbal1999; Forster et al. Reference Forster, Barber, Diasinos and Doig2015) for singular vortices. The Crow instability is described through a solution to a linear wave system, which describes the deviations of counter-rotating vortex pairs (Crow Reference Crow1970). Once the vortex cores reach a certain proximity or cutoff distance the two wakes unify into vortex rings and rapidly breakdown. Vortices that break down or dissipate in short distances and timeframes do not have a long enough duration for waves to form, and as such are not subject to the Crow instability. Using these models, it has been found that all counter-rotating pairs are inherently unstable regarding the long wave Crow instability (Widnall Reference Widnall1975; Klein Reference Klein1995; Fabre, Jacquin & Loof Reference Fabre, Jacquin and Loof2002). For vortices of unequal strength, the Crow instability can manifest itself at much shorter wavelengths than for an equal strength case. This has been simulated numerically using computational fluid dynamics (CFD), and it has been found that a medium length instability is present where the weaker vortex is drawn around the primary vortex in four vortex systems (Chatelain et al. Reference Chatelain, Curioni, Bergdorf, Rossinelli, Andreoni and Koumoutsakos2008). However, the mechanisms behind the downstream instabilities of a close proximity, two vortex system are still poorly understood.
The short wave (elliptic) instability is identified in counter and co-rotating pairs by a streamtube in the core of the vortex with a diameter approximately half that of the instability’s wavelength. This instability is caused fundamentally by a resonance of two Kelvin waves (a sinusoidal deformation) within the vortex core as driven by the strain field induced by the other vortex (Tsai & Widnall Reference Tsai and Widnall1976). Like the Crow instability, it is modified by differing axial velocity components and vortex strengths. Meunier & Leweke (Reference Meunier and Leweke2005) found that this elliptic instability is stationary with respect to the rotating frame of reference in co-rotating vortex pairs, being antisymmetric with respect to the vortex pair centre for most wavelengths. They also suggested that merging of co-rotating vortices could occur once the elliptic instability had reached a sufficiently large magnitude, forming a single, turbulent vortex core. This core then relaxes to a laminar vortex with the progression of time.
A pair of co-rotating vortices will merge in any viscous flow (Roberts & Christiansen Reference Roberts and Christiansen1972; Overman Reference Overman1982; Dritschel Reference Dritschel1985), however the majority of experimentation and analysis surrounding this subject has used equal strength and size vortex cores, with two-dimensional flow fields and no velocity deficit through the core, limiting their applicability to real world interaction scenarios. In the case of vortices of unequal strength the mechanism of merging is notably different if the circulation differential is large. In these cases, the weaker vortex has insufficient circulation to support the strain field induced by the stronger vortex, and as such is strained into a spiral tail structure (Leweke et al. Reference Leweke, Le Dizès and Williamson2016). Using inviscid contour method calculations, Dritschel & Waugh (Reference Dritschel and Waugh1992) found that the interaction between two vortices with a large difference in size results in the smaller vortex being torn away, with little increase in size of the larger vortex. This was identified as a regime of either partial or complete straining out. This is in contrast with more closely sized vortices, which often result in total core growth, under a regime they identified as complete merger or partial merger. In addition to this, equal or similar strength vortex interactions typically produce single vortices, while unequal strength interactions may produce two vortex systems. Numerical studies of such scenarios have also been performed (Brandt & Nomura Reference Brandt and Nomura2010), finding similar structures and regimes. The mechanism behind these straining actions is a combination of two causes. Firstly, the weaker vortex is stretched and drawn into the stronger vortex by a process of elongation (Trieling & Heijst Reference Trieling and Van Heijst1998). Secondly, a continuous erosion of vorticity into the primary vortex is caused by the strong strain field and high shear, in a mechanism analytically observed by Legras & Dritschel (Reference Legras and Dritschel1993).
The two-dimensional (2-D) interactions of unequal vortices have further been characterised by the two-dimensional numerical simulations of Folz & Nomura (Reference Folz and Nomura2017), who classified the nature of the vortex interactions by critical strain rate. By introducing a mutuality parameter (MP) of the ratio between the vortices of the strain rate divided by the peak vorticity, they determined that if MP is greater than 1, the stronger vortex dominates, while if the MP is less than one but above a critical MP, the weaker vortex dominates and will be enhanced. This critical MP was found to vary with Reynolds number. The authors (Forster et al. Reference Forster, Barber, Diasinos and Doig2017b ) have previously experimentally investigated these interactions in upstream/downstream scenarios with unequal strength cores, however the transient mechanisms behind these unstable interactions still require investigation. The merging distance for an upstream/downstream close proximity vortex interaction has been found to be statistical rather than deterministic, and while the mechanism behind this has been proposed (Forster et al. Reference Forster, Barber, Diasinos and Doig2017b ), further investigation and confirmation is yet to be performed.
The interactions of a streamwise vortex with a wingtip at close range have also been computationally investigated (Forster et al.
Reference Forster, Barber, Diasinos and Doig2015; Garmann & Visbal Reference Garmann and Visbal2015). By aligning an incident vortex with the tip of a downstream vane, the energy of the vortex system is increased in the near range, however more rapid energy attenuation occurs downstream. When the vortex is positioned inboard of the tip, it reduces the tip vortex size and strength, while placing it outboard of the wingtip enhances the wingtip vortex (Garmann & Visbal Reference Garmann and Visbal2015). Reducing the distance of the incident vortex to the wingtip has been found to increase the magnitude of the turbulence production from the resultant vortex interaction (Forster et al.
Reference Forster, Barber, Diasinos and Doig2015). It has experimentally been found that a counter-rotating wing configuration with a 2.5 chord length (
 $C$
) streamwise wing spacing can substantially improve rear wing lift to drag ratio (
 $L/D$
) by up to 24 % at an overlap of 5 % of the wingspan (Inasawa, Mori & Asai Reference Inasawa, Mori and Asai2012). Such a configuration causes migration of the rear vortex towards the root of the rear wing, however the downstream consequences of these interactions have not been characterised for more than one chord length downstream.
In this work, experimentally validated, large eddy simulations (LES) have been used to investigate the close proximity interactions of two streamwise vortices. Previous experimental work (Forster et al. Reference Forster, Barber, Diasinos and Doig2017b ,Reference Forster, Barber, Diasinos and Doig c ) identified that in far offset cases, few notable features were present. Circulation rates remained near constant through the domain, with minimal migration and rotation, and vortex meandering was found to be minimal. As such, they were not considered as cases of interest for the LES investigations. In the nearer field the interactions were far more significant, with large changes in rotation rates, meandering and circulation transfer, resulting in their selection for investigation. An upstream vane is used to produce a realistic vortex that is allowed to travel downstream and interact with a downstream vane, with the downstream vane’s lateral offset modified to pass the vortex on either the pressure or suction side, as well as investigate the results of direct vortex impingement. The resulting flow field has then been analysed in both a time averaged and transient sense to observe the instabilities and flow features present. The focus has been limited to the results of a vane configuration at low Reynolds number and intermediate swirl number, allowing a strong vortex interaction. Through this, a better understanding of the mechanisms behind experimentally observed vortex characteristics can be achieved.
2 Geometry and cases considered
The present study considers the interaction of two streamwise vortices produced by two NACA 0012 vanes, with a similar set-up to that used in previous experiments by the authors (Forster et al.
Reference Forster, Barber, Diasinos and Doig2017b
,Reference Forster, Barber, Diasinos and Doig
c
). One vane was located 10 chord lengths (
 $C$
) downstream of the other, as can be seen in figure 1. This configuration was chosen as it allows interactions between vortices to occur at close proximities that cannot be observed if the vortices are deployed at the same location. This is also representative of the effects of a pre-existing vortex in a flow interacting with a vortex producing device. An angle of attack of
 $8^{\circ }$
on each vane has been used for all cases, with a square-edged tip. As identified previously, higher angles of attack decreased the vortex stability, with unsteady breakdown becoming observable for a single vortex case at
 $12^{\circ }$
. The analysis was performed at a Reynolds number of approximately
 $7\times 10^{4}$
based on chord length, within the supercritical region (Huang & Lin Reference Huang and Lin1995) at this angle of attack. This is also consistent with the previous experimental Reynolds number tested by the authors (Forster et al.
Reference Forster, Barber, Diasinos and Doig2017b
,Reference Forster, Barber, Diasinos and Doig
c
). This gives an approximate Reynolds number based off vortex circulation of 8000.
Schematic of vane layout.

While point monitors can be used to monitor frequencies and amplitudes in transient flows, their usefulness in unsteady vortex fields is limited. This is primarily due to the meandering motions of vortices, as any point monitor placed within the core of the vortex shifts from monitoring the core to the periphery as a result of the vortex motion. The result of this is erratic tangential velocities and pressure readings that are not indicative of the vortex core instantaneous properties. As such, planar data are needed for each timestep to calculate the characteristics of the vortex. The computational storage expense of such data is very significant, consequently this transient behaviour was only recorded for three cases where it was expected the transient quantities would be of interest. The properties of the vortex cores present on planes spaced
 $0.5C$
apart were extracted for each timestep, applying the previous experimental methodology of the authors (Forster et al.
Reference Forster, Barber, Diasinos and Doig2017b
,Reference Forster, Barber, Diasinos and Doig
c
). It should be noted that the criterion of the transient tracking is used primarily to track the individual vortex core locations, circulations and transient responses, and is not used to evaluate the merging mechanisms.
For the counter-rotating case three conditions of the near field interactions were considered for investigation, the first being vortex impact on the front of the vane. This was expected to be at
 $-0.2C$
offset as identified by prior work (Forster et al.
Reference Forster, Barber, Diasinos and Doig2017b
,Reference Forster, Barber, Diasinos and Doig
c
) The second case was a near pass of the upstream vortex, with the complete vortex radius being outside of contact with the downstream vane, this occurred at
 $0.2C$
offset. The final case chosen was an intermediate between these two, with partial impingement of the vortex on the downstream vane, at
 $0C$
offset. It was known from previous studies that the transient migrations of both vortices in the near pass condition was significant, so transient vortex tracking was applied to the
 $0.2C$
offset case. It was also expected that the impingement and resultant destruction of the upstream vortex on the rear vane would have significant consequences for the meandering and circulation of the downstream vortex, as such transient vortex tracking was also applied to the
 $-0.2C$
offset condition.
Three more conditions of interest were identified for the co-rotating case. Previous experimental work (Forster et al.
Reference Forster, Barber, Diasinos and Doig2017b
) had shown a difference in vortex merging rates depending on which side of the vane the vortex was passed on. As such, two near field passes of the vortex on the vane were desired, one on each side of the vane. This occurred at
 $-0.2C$
and
 $0C$
offset. It was also desired to investigate the mechanisms present in a longer merging distance case, and for this purpose the
 $0.2C$
offset case offered the longest merging length still within the CFD domain. It was not anticipated for the nearer offset, short merging length cases to yield interesting transient meandering data, so only the
 $0.2C$
offset was monitored with transient vortex tracking.
3 Numerical model
A consequence of the original Smagorinsky–Lilly model defining the eddy viscosity proportional to the subgrid characteristic length scale and turbulent velocity is that the local strain rate defines the velocity scale (Nicoud & Ducros Reference Nicoud and Ducros1999). This inherently relates the subgrid dissipation to the rates of strain at the smallest resolved scale, ineffectively resolving regions where the vorticity field is more significant than the strain field. The assumption of fully isotropic turbulence in the inertial subrange also creates issues with wall bounded flows, where the Smagorinsky constant must be reduced and additional damping at the wall must be applied to ensure the eddy viscosity approaches zero at the wall (Van Driest Reference Van Driest1956). This causes difficulties with complex geometries, which can be solved by the application of the wall adapting local eddy viscosity (WALE) model. This model relates the modelling of the eddy viscosity to the square of the velocity gradient tensor, ensuring the correct asymptotic wall bounded behaviour of
 $y^{3}$
instead of
 $y^{2}$
in the van Driest modified Smagorinsky–Lilly model. This model has been shown to have effective modelling of boundary layer transition and free vortex problems (Ma, Wang & Tang Reference Ma, Wang and Tang2009), with superior performance to the standard and dynamic Smagorinsky–Lilly models for free vortex performance (Yilmaz & Davidson Reference Yilmaz and Davidson2015). The formulation for the eddy viscosity in the WALE model is
 $$\begin{eqnarray}v_{t}=(C_{w}\unicode[STIX]{x1D6E5})^{2}\frac{(\unicode[STIX]{x1D61A}_{ij}^{d}\unicode[STIX]{x1D61A}_{ij}^{d})^{3/2}}{(\overline{\unicode[STIX]{x1D61A}}_{ij}\overline{\unicode[STIX]{x1D61A}}_{ij})^{5/2}+(\unicode[STIX]{x1D61A}_{ij}^{d}\unicode[STIX]{x1D61A}_{ij}^{d})^{5/4}},\end{eqnarray}$$
where
 $C_{w}$
is the WALE constant,
 $\overline{\unicode[STIX]{x1D61A}}_{ij}$
is the symmetric component of the velocity gradient tensor (also the strain, or deformation tensor of the resolved velocity field),
 $\unicode[STIX]{x1D6E5}$
is the characteristic subgrid length scale and
 $\unicode[STIX]{x1D61A}_{ij}^{d}$
is the traceless symmetric part of the square of the velocity gradient tensor.
Both the Smagorinsky–Lilly and WALE models were tested against a reference experimental case for co-rotation at
 $0.2C$
offset. It was found that the increased dissipation of the Smagorinsky–Lilly model compared to WALE on the grid tested resulted in the upstream vortex having 8.3 % lower peak azimuthal velocity at the point of the rear vane, consequently shifting the merging mechanism from the upstream being the stronger vortex into the downstream being significantly stronger. This produced poor validation results, discussed in the next section, in comparison to the WALE modelling, and as such WALE was selected for further evaluations.
The most commonly used WALE constant of 0.325 (Lehmkuhl et al.
Reference Lehmkuhl, Rodríguez, Baez, Oliva and Pérez-Segarra2013; Probst & Reuß Reference Probst and Reuß2015; Safdari & Kim Reference Safdari and Kim2015) and the value originally recommended by Nicoud and Ducros of 0.5 (Nicoud & Ducros Reference Nicoud and Ducros1999) were tested to observe the effects of varying the constant on the vortex dissipation and merging length. It was found that the change in vortex merging distance and vortex paths was negligible between these tests. However, the dissipation rate did change with the varying values, with higher vortex dissipation observed at higher
 $C_{w}$
. Experimental validation as discussed later confirmed that lower numerical dissipation was required. As such,
 $C_{w}=0.325$
was used for the remainder of testing.
An implicit pressure-based solver was used, with segregated pressure/velocity coupling and a semi-implicit method for pressure linked equations-consistent (SIMPLEC) algorithm (Patankar Reference Patankar1971). To successfully resolve the dominantly swirling vortex flow with steep pressure gradients, a second-order pressure staggering options (PRESTO) algorithm was selected for pressure discretization. This scheme has previously proved successful for flows with high swirl number (Peyret Reference Peyret1996; Kaya & Karagoz Reference Kaya and Karagoz2008). Second-order central differencing was used for all other quantities, with bounded second-order implicit time stepping. A convection boundness criterion was enforced to maintain solution stability. A time step of
 $3\times 10^{-5}~\text{s}$
was used, resulting in the maximum Courant–Friedrichs–Lewy (CFL) number being maintained at below 1 for all simulations, ensuring proper temporal resolution (Courant, Friedrichs & Lewy Reference Courant, Friedrichs and Lewy1967).
A fully structured multi-block meshing strategy was employed. The final grid consisted of 58 elements along the chord of each vane, with 400 elements along the length of the wake behind the rear vane, and 200 between the vanes. Fifty cells were used along the height of the vane, with the majority concentrated at the tip as the base area was of little interest. All elements were generated as hexahedral, with a
 $Y$
-grid strategy employed at the trailing edge of each vane and a double
 $Y$
-grid at the leading edge. Mesh density was progressively increased at the leading edge of the rear vane to resolve the near-field vortex interaction, particularly in the case of impact. The elements were stretched in the far regions of the domain where predominantly free-stream flow was expected. The final mesh maintained between 25–30 elements across the viscous vortex core behind the vane, notably above the 15–20 elements for correct core capturing recommended by Dacles-Mariani et al. (Reference Dacles-Mariani, Zilliac, Chow and Bradshaw1995). The significant bias of the mesh to the wake regions resulted in a comparatively coarse mesh on the vanes, reflective of the key focus of the study on the vortices, vortex formation and vortex interaction rather than the vane surface characteristics. For validation runs mesh density was increased at the vane root to model the boundary layer and horseshoe vortices associated with the ground plane more effectively.
A constant velocity inlet with no boundary layer placed six chord lengths upstream of the upstream vane. Elimination of floor boundary layer influence on the vortices was performed with symmetry (free-slip) conditions were used for all domain walls, with a no-slip wall being employed on the vanes themselves. For the outlet a zero normal diffusion flux condition was placed 30 chord lengths downstream of the rear vane, with behaviour found to be consistent with an outlet length of 56 chord lengths downstream.
The grid was evaluated at resolutions of
 $1.2\times 10^{7}$
,
 $1.6\times 10^{7}$
and
 $2.6\times 10^{7}$
, with
 $2.6\times 10^{7}$
considered the practical grid limit for the computational resources available. Refinement between these cases was performed through the increasing the density along the
 $x$
-axis in the region from the rear vane’s trailing edge to
 $15C$
aft of the trailing edge. Spanwise refinement was kept constant at between 25 and 30 elements across the viscous vortex core. These runs were performed on the co-rotating
 $0.2C$
offset case, as mesh density variance within the wake region was expected to modify the elliptic instability within the vortices, with subsequent effects on merging length and energy. The mesh density modification for these runs was entirely in the wake region, increasing the mesh density in the streamwise direction and thus improving cell aspect ratio. All meshes were run at a constant time step of
 $3\times 10^{-5}~\text{s}$
, with maximum CFL number being maintained below 1.
Initial inspection of the forces on the front vane showed a very close correlation for all cases with the forces expected from theory. From Prandtl’s lifting line theory, the 3-D lift coefficient on the wing was calculated to be 0.54. It was found that the LES solutions predicted averages of 0.5508, 0.556 and 0.546 on the front vane for the increasing mesh densities respectively. All of these forces were within 3 % of the theoretical force calculation, with the finest mesh within 1 %. Tracing the forces on the rear vane as seen in figure 2 found again that all three mesh configurations showed similar trends for force values and frequencies, and as such any of them would be suitable for resolving the region in between the vortex generators. As such, further inspection of the far-field vortex properties was desired.
Isosurfaces of
 $x$
-vorticity (a) and force values for rear vane (b) for different mesh resolutions.

As can be seen in figure 2, while the structures near the vane remained similar irrespective of mesh density, the higher energy vortex structures in the far field dissipated faster under the lower resolution meshes. This was particularly evident in the manifestation of the pressure variances in the vortex core, with more significant fluctuations visible in the densest mesh. The net result of these mesh changes was a faster dissipation in the high energy vortical structures, with an associated loss in high frequency flow features further in the wake. The lower energy, larger radius vorticity levels remained far less affected by the mesh density, with similar diameters and vortex lengths seen for the majority of the domain in all cases.
Isosurfaces of
 $x$
-vorticity coloured by
 $x$
-velocity for multiple LES mesh densities at
 $T\ast U_{\infty }=6.039$
(a) and
 $T\ast U_{\infty }=6.777$
(b).

Whilst the flow structures were conceptually similar between the meshes, with a helical pattern and the downstream vortex merging into the upstream vortex, the transient fluctuation rates varied, as can be seen in figure 3. In the first state the vortex cross-over points are near identical between the cases, with
 $0.06C$
variance in the rear of the upstream cross-over and
 $0.12C$
in the front upstream cross-over. In the second state the front upstream cross-over point varies by
 $1.28C$
between the three conditions, with the downstream cross-over remaining near constant. This is due to the increasing instabilities with the higher mesh resolutions forcing a higher meandering magnitude on the upstream vortex, resulting in a larger shift in the instantaneous cross-over point. The differential in far-field dissipation rates can also be observed here, with the
 $2.6\times 10^{7}$
cell mesh showing a far longer continuation of the vorticity isosurface than the
 $1.2\times 10^{7}$
cell mesh. However, the long range dissipation difference is far less significant between the
 $1.7\times 10^{7}$
and
 $2.6\times 10^{7}$
cell grids. All three meshes produced an uneven vortex merger, with the downstream vortex merging into the upstream vortex, which was identical to that achieved with experimental results as will be discussed later in the validation section. The
 $2.6\times 10^{7}$
cell mesh successfully converged on the vane force and frequency characteristics, and downstream kinetic energy properties, demonstrating its suitability for the analysis of this flow field. While all meshes successfully resolved the global flow structure and large-scale instabilities, the
 $2.6\times 10^{7}$
cell mesh showed the best resolution of transient elliptic instabilities and the least dissipation at high vorticity levels, and therefore was used for the LES analysis.
4 Model validation
As previously discussed, good correlation between the model and lifting line theory on the single frontal vane was observed, however the successful prediction of a multiple vortex interaction is far more complex than predicting lift on a common wing profile. As such, the entire double vane system was evaluated against the previous wind tunnel particle image velocimetry (PIV) experimental results of the authors (Forster et al.
Reference Forster, Barber, Diasinos and Doig2017b
,Reference Forster, Barber, Diasinos and Doig
c
). For these purposes the LES modelling previously described was applied to a representation of the test section used for wind tunnel testing. No-slip smooth walls were used on all faces, with a specified inlet velocity profile as measured from experimental characterisation of conditions at the tunnel inlet. All mesh densities around and in between the vanes were maintained as per the previous meshing strategy, with additional elements used to resolve the walls of the wind tunnel and splitter. Results were initialised and time averaged using the previously discussed strategy. As there are two fundamental conditions being evaluated, with two unique vortex interactions, it was necessary to validate the modelling against both the co-rotating and counter-rotating experimental results. For the counter-rotating condition the
 $0.5C$
offset was used as it maintained the highest vortex energy throughout the domain. In the co-rotating condition, the
 $0.2C$
offset was evaluated as it demonstrated multiple stages of merger and had a long merging distance that was still within the tunnel test section.
4.1 Co-rotating
The primary intent of the co-rotating validation was to determine the accuracy of the modelling of the vortex attraction and merger. Testing with Reynolds-averaged Navier–Stokes (RANS) shear-stress transport (SST) and Reynolds stress model (RSM) modelling, as well as to a lesser extent Smagorinsky–Lilly large eddy simulation (LES), allowed identification of issues with high vortex dissipation causing incorrect measurement of the vortex interaction (Forster et al. Reference Forster, Barber, Diasinos and Doig2015). Specifically, these earlier simulations had shown that the upstream vortex had dissipated sufficiently by the point of the rear vane to become the weaker of the two, and the resultant interaction caused the downstream vortex to absorb the upstream vortex. The WALE modelling disagreed with this, showing less dissipation and the downstream vortex being weakened by the upstream, resulting in it merging into the stronger upstream vortex. As such it was deemed critical to validate the accuracy of the modelling strategy in this condition.
 $x$
-vorticity results for LES (a) and experimental (b,c) results for co-rotating condition. The diamonds on the plots indicate outliers in the experimental data.

Initial validation of the co-rotating condition proved difficult, as correlation with the
 $0.2C$
offset case remained purely qualitative. After finding the upstream vortex had migrated towards a more negative
 $y$
value, the
 $0.3C$
offset experimental case was also investigated to determine the correlation properties, as can be seen in figure 4. Very close correlation was observed to the
 $0.3C$
offset case on rotation, separation and vorticity levels, with the marginally increased dissipation observed in the LES. The average rotational rate in the CFD was
 $27.088^{\circ }/C$
, compared to
 $26.464^{\circ }/C$
in the
 $0.3C$
offset experimental condition. This indicated that the model was over-predicting the total downwash from the vanes, forcing the initial vortex
 $-0.05C$
to the left in the counter-rotating condition and
 $-0.1C$
in the co-rotating condition. The presence of the rear vane produces a downwash in the
 $+y$
direction for the counter-rotating case, shifting the vortex
 $0.025C$
from an unobstructed
 $-0.075C$
location to
 $-0.05C$
from the expected location. In the co-rotating condition the downwash from the rear vane is in the same direction as the initial vane downwash, causing the vortex to shift
 $-0.025C$
to
 $-0.1C$
from the expected position, resulting in the correlation with the greater offset case observed. This is consistent with the observation of both vortices being skewed to the
 $-y$
in the CFD when compared to either experimental case.
More important than the specifics of the vortex positions was the accurate prediction of the merging mechanism. Three distinct stages of merger were visible in both the far downstream LES results and the
 $0.2C$
experimental results, with the vortices initially near symmetric, before reaching a critical proximity at a non-dimensionalised separation distance of approximately
 $B_{v}/r_{v}=2$
, where
 $B_{v}$
is the separation between the vortices and
 $r_{v}$
is the average vortex radius. At this critical proximity, an asymmetry develops in the vortex shape with a rapid transfer of vorticity between the vortices. This is followed by the formation of a spiral tail from the remnants of the second vortex. More details of this merging mechanism present in the experimental results can be found in Forster et al. (Reference Forster, Barber, Diasinos and Doig2017b
). The most important characteristic compared between the experimental and numerical results is that the downstream vortex is absorbed into the upstream vortex, as this validates the selection of the WALE model over the Smagorinsky–Lilly LES model.
4.2 Counter-rotating
Inspection of the velocity fields in figure 5 showed good qualitative agreement between the experimental and numerical flow fields. As indicated by the purple arrows, all dominant flow structures maintained the same paths between the two, with a continuous downwards movement of the vortex pair. The lower energy structures showed migration in the same direction, however due to the error limitations of the PIV system at lower velocity magnitudes the velocity field is more poorly resolved and becomes dominated by noise. This can be seen in the top left kink in the velocity field, which has a very clear migration in the CFD case, however is seen as more of an increasing dent in the flow field in the PIV. Between
 $x/C=13$
and
 $x/C=17$
the expansion of the low swirl velocity region at the bottom left is also clearly matched in both conditions.
In-plane velocity fields for LES (a) and experimental (b) counter-rotating cases at
 $0.5C$
offset.

The higher strength downstream vortices both follow the same pattern of rotation counter-clockwise from the point of formation, however the LES predicts the initial velocity horseshoe at
 $x/C=12$
to be located higher than the horizontally centred location in the experiment. This is reflected in the final location of the horseshoe, with LES being slightly below horizontal and the experiment being significantly lower at
 $x/C=17$
. The subsequent rotational rate for the two cases for the single vortex formation was near identical, with
 $0.744^{\circ }/C$
for the LES and
 $0.268^{\circ }/C$
for the experiment. Total movement of the vortices in the CFD was
 $-0.293C$
and
 $-0.332C$
for the upstream and downstream vortices respectively, with
 $-0.260C$
and
 $-0.293C$
for the experimental condition. Vortex separation was
 $0.612C$
in the CFD and
 $0.666C$
in the experiment, leading to a difference of
 $0.054C$
.
The initial peak velocity at the point of vortex generation is higher in the computational model, with a 87.5 % larger area at 0.4
 $U_{ip}/U_{\infty }$
at
 $x/C=12$
. However, the computational model displays a higher level of dissipation than the experiments, with the stronger downstream vortex core dissipating to a peak velocity 10 % lower than the experimental by
 $x/C=17$
. The upstream vortex maintains a lower peak velocity in the CFD for the entire length of the observation window, with it showing a lower peak and average velocity at the start of the domain. This is consistent with the higher dissipation rates observed in the downstream vortex, as these are likely also increasing the dissipation of the upstream vortex prior to interaction.
The most significant difference between the two models is the location of the upstream vortex, with the
 $Z$
value at
 $x/C=12$
being
 $0.065C$
lower in the CFD modelling, inverting the slope of the line between the two vortex cores. This is accompanied by a
 $0.05C$
lateral shift in the
 $y$
direction, indicating that the model has over-predicted the migration of the upstream vortex both laterally and vertically. This is further evidenced by the higher vertical rate of migration of the vortices observed when compared to the experiment. While these changes are small, they have a more significant effect in the closer interaction cases, where the effective offset is altered. This will be discussed in more detail in the following subsection. However, the over-prediction of this migration is unlikely to affect the key mechanisms behind the vortex interaction.
5 Results
5.1 Co-rotating condition
The presence of the upstream vortex caused significant changes in the formation mechanism of the downstream vortex. In the case of the single upstream vane, two separate vortices are initially formed, as can be seen in figure 6. This vortex production is due to the squared-off tip geometry, with one formed from the flow between the pressure surface and tip, and one from the flow from tip to the suction surface. This vortex structure is consistent with that observed at
 $12^{\circ }$
angle of attack by Uzun & Hussaini (Reference Uzun and Hussaini2010), with the surface trajectories following a similar path. These two vortices both have their own distinct regions of concentrated vorticity, as well as a low pressure core. The merger of these vortices occurs just prior to the trailing edge of the vane, forming a slightly non-uniform vortex core shape that rapidly relaxes into a circular profile by a chord length downstream. The asymmetric shape of the vortex during roll up immediately after the vane also agrees with the PIV results of Giuni & Green (Reference Giuni and Green2013), with a clear vorticity tail. Introducing a vortex near to the suction side of the vane significantly modifies this formation process, as seen in the
 $-0.2C$
offset condition presented in figure 6. The upstream vortex is seen to merge with the tip/suction surface vortex, producing a distinct vortex that is separate from the vortex produced from the pressure surface/tip bleed. The initially merged vortex has a larger core of both vorticity and pressure deficit than the tip/suction surface vortex in the front vane only case, however the pressure reaches a lower peak, with no
 $-0.4C_{p}$
isosurface seen. When the vorticity downstream of the vane is inspected, only two vortices are distinguishable, the partially merged upstream vortex and the pressure surface/tip vortex. This would appear as a weaker vortex produced by the downstream vane if only the off vane vortices were observed, due to the re-energisation of the upstream vortex by the tip/suction surface vortex. As the flow moves further downstream these two vortices merge, eventually forming one coherent structure which relaxes into a uniform vortex. The relaxation to circular takes considerably longer than the single vane case, with significant non-uniformities present at
 $1.5C$
downstream. The resultant low pressure core of the merged vortices is larger at
 $-0.16C_{p}$
, however the low pressure peaks have been reduced, with the
 $-0.4C_{p}$
isosurface being considerably smaller in diameter. More interesting is the disappearance of the
 $-0.4C_{p}$
isosurface while the two vortices are in the merging process, however after merging and during the relaxation stage it returns. This indicates that the relaxation back to vortex circularity also coincides with an increase in peak pressure drop within the vortex.
Time-averaged contours of
 $x$
-vorticity, with isosurfaces of pressure at
 $C_{p}=-0.4$
and
 $C_{p}=-0.16$
for front vane (a) and rear vane at
 $-0.2C$
offset (b). Zoomed views are presented in the inset on the left of each panel

Pressure coefficient on vane surfaces (a) with wall shear (b) for various offsets.

Inspecting the on-surface pressures and wall shears presented in figure 7 can further highlight the differences in vortex suppression and enhancement between the offsets. As previously discussed, passing the vortex on the suction side of the vane suppressed the tip/suction vortex, pulling the vortex off the surface. This caused the pressure of the core to be indistinguishable on the surface in the
 $-0.2C$
offset condition, whilst the upstream vortex showed a clear enhancement of the suction peak at the tip. The pressure surface/tip vortex also produced a more significant low pressure region than in the front vane, with a clear enhancement despite the downstream vane producing less lift than the upstream due to downwash and unfavourable vortex interactions. This was also reflected in the wall shear, with the 275 % of the peak cross-plane shear, indicating the vortex generated on the tip surface of the vane was both stronger and forced closer to the surface than in the single vane condition. With the offset modified to positive
 $0.2C$
and the upstream vortex passing on the pressure side, the enhancement and suppression of the two tip vortices was effectively reversed. Through the presence of the low pressure core on the suction side of the vane reducing the magnitude of the local pressure differential, in addition to the downwards flow induced by the swirling vortex core, the pressure surface/tip vortex is suppressed. This can be seen in the nearly non-existent tip pressure reduction and low wall shear. Passing the vortex on the pressure side also enhanced the tip/suction surface vortex, with an increase in peak suction of 0.16 against the single vane case clearly visible.
Time-averaged contours of
 $x$
-vorticity, with isosurfaces of pressure at
 $C_{p}=-0.4$
and
 $C_{p}=-0.16$
at
 $0.2C$
offset.

The results of the vortex suppression on the positive offset case can be seen in figure 8. Suppression of the pressure surface/tip vortex results in only a small tail of vorticity forming on the end of the dominant tip/suction vortex, resulting in rapid vortex relaxation. This causes the low pressure
 $-0.4C_{p}$
isosurface to extend for a longer distance and at a larger diameter than in the
 $-0.2C$
offset. Despite the lower pressure core than the upstream vortex, the dissipation rate of the vorticity and the pressure is larger for the downstream vortex, resulting in its eventual merger into the upstream vortex. The suppressing effect of the upstream vortex on the pressure surface/tip vortex weakens the strength and radius of vorticity of the final downstream vortex, making it the weaker vortex, thus resulting in its merger with the upstream vortex through the asymmetric merger process previously identified in the experimental work of the authors (Forster et al.
Reference Forster, Barber, Diasinos and Doig2017b
).
Time-averaged (a) and instantaneous (b) contours of
 $x$
-vorticity, with isosurfaces of pressure at
 $C_{p}=-0.4$
and
 $C_{p}=-0.16$
at
 $0C$
offset.

When the upstream vortex was kept on the pressure side of the vane, but the offset reduced, the same pressure surface/tip vortex suppression was observed, seen in figure 9. However, the contact between the upstream vortex and the surface resulted in the flattening of the vorticity profile on the vane. This caused a loss in total vortex circulation, making the upstream vortex the weaker of the two. Consequently, it was found to merge into the downstream vortex, an effect not seen in the experimental results (Forster et al.
Reference Forster, Barber, Diasinos and Doig2017b
) as the near offset cases were all merged through the observation domain. This merger did however produce the asymmetric merger and vorticity tail observed in the experimental merging mechanism. When the instantaneous results were analysed it was found the merger was a highly unsteady process, with significant fluctuations of 14.2 % in core radius at
 $C_{p}=-0.16$
, and peak vorticity reaching 61 % more than time averaged at
 $x/C=13$
. In the instantaneous condition the upstream vortex became more strained by the downstream vortex, forming an elongated structure that split into two separate structures further downstream. Due to the presence of both bifurcated and singular upstream vortices it could be seen that this was a transient fluctuation between the bifurcated and singular state. This flow structure can be seen in figure 9, where the upstream vortex splits into two distinct, concentrated vortex cores at the second last vorticity plane.
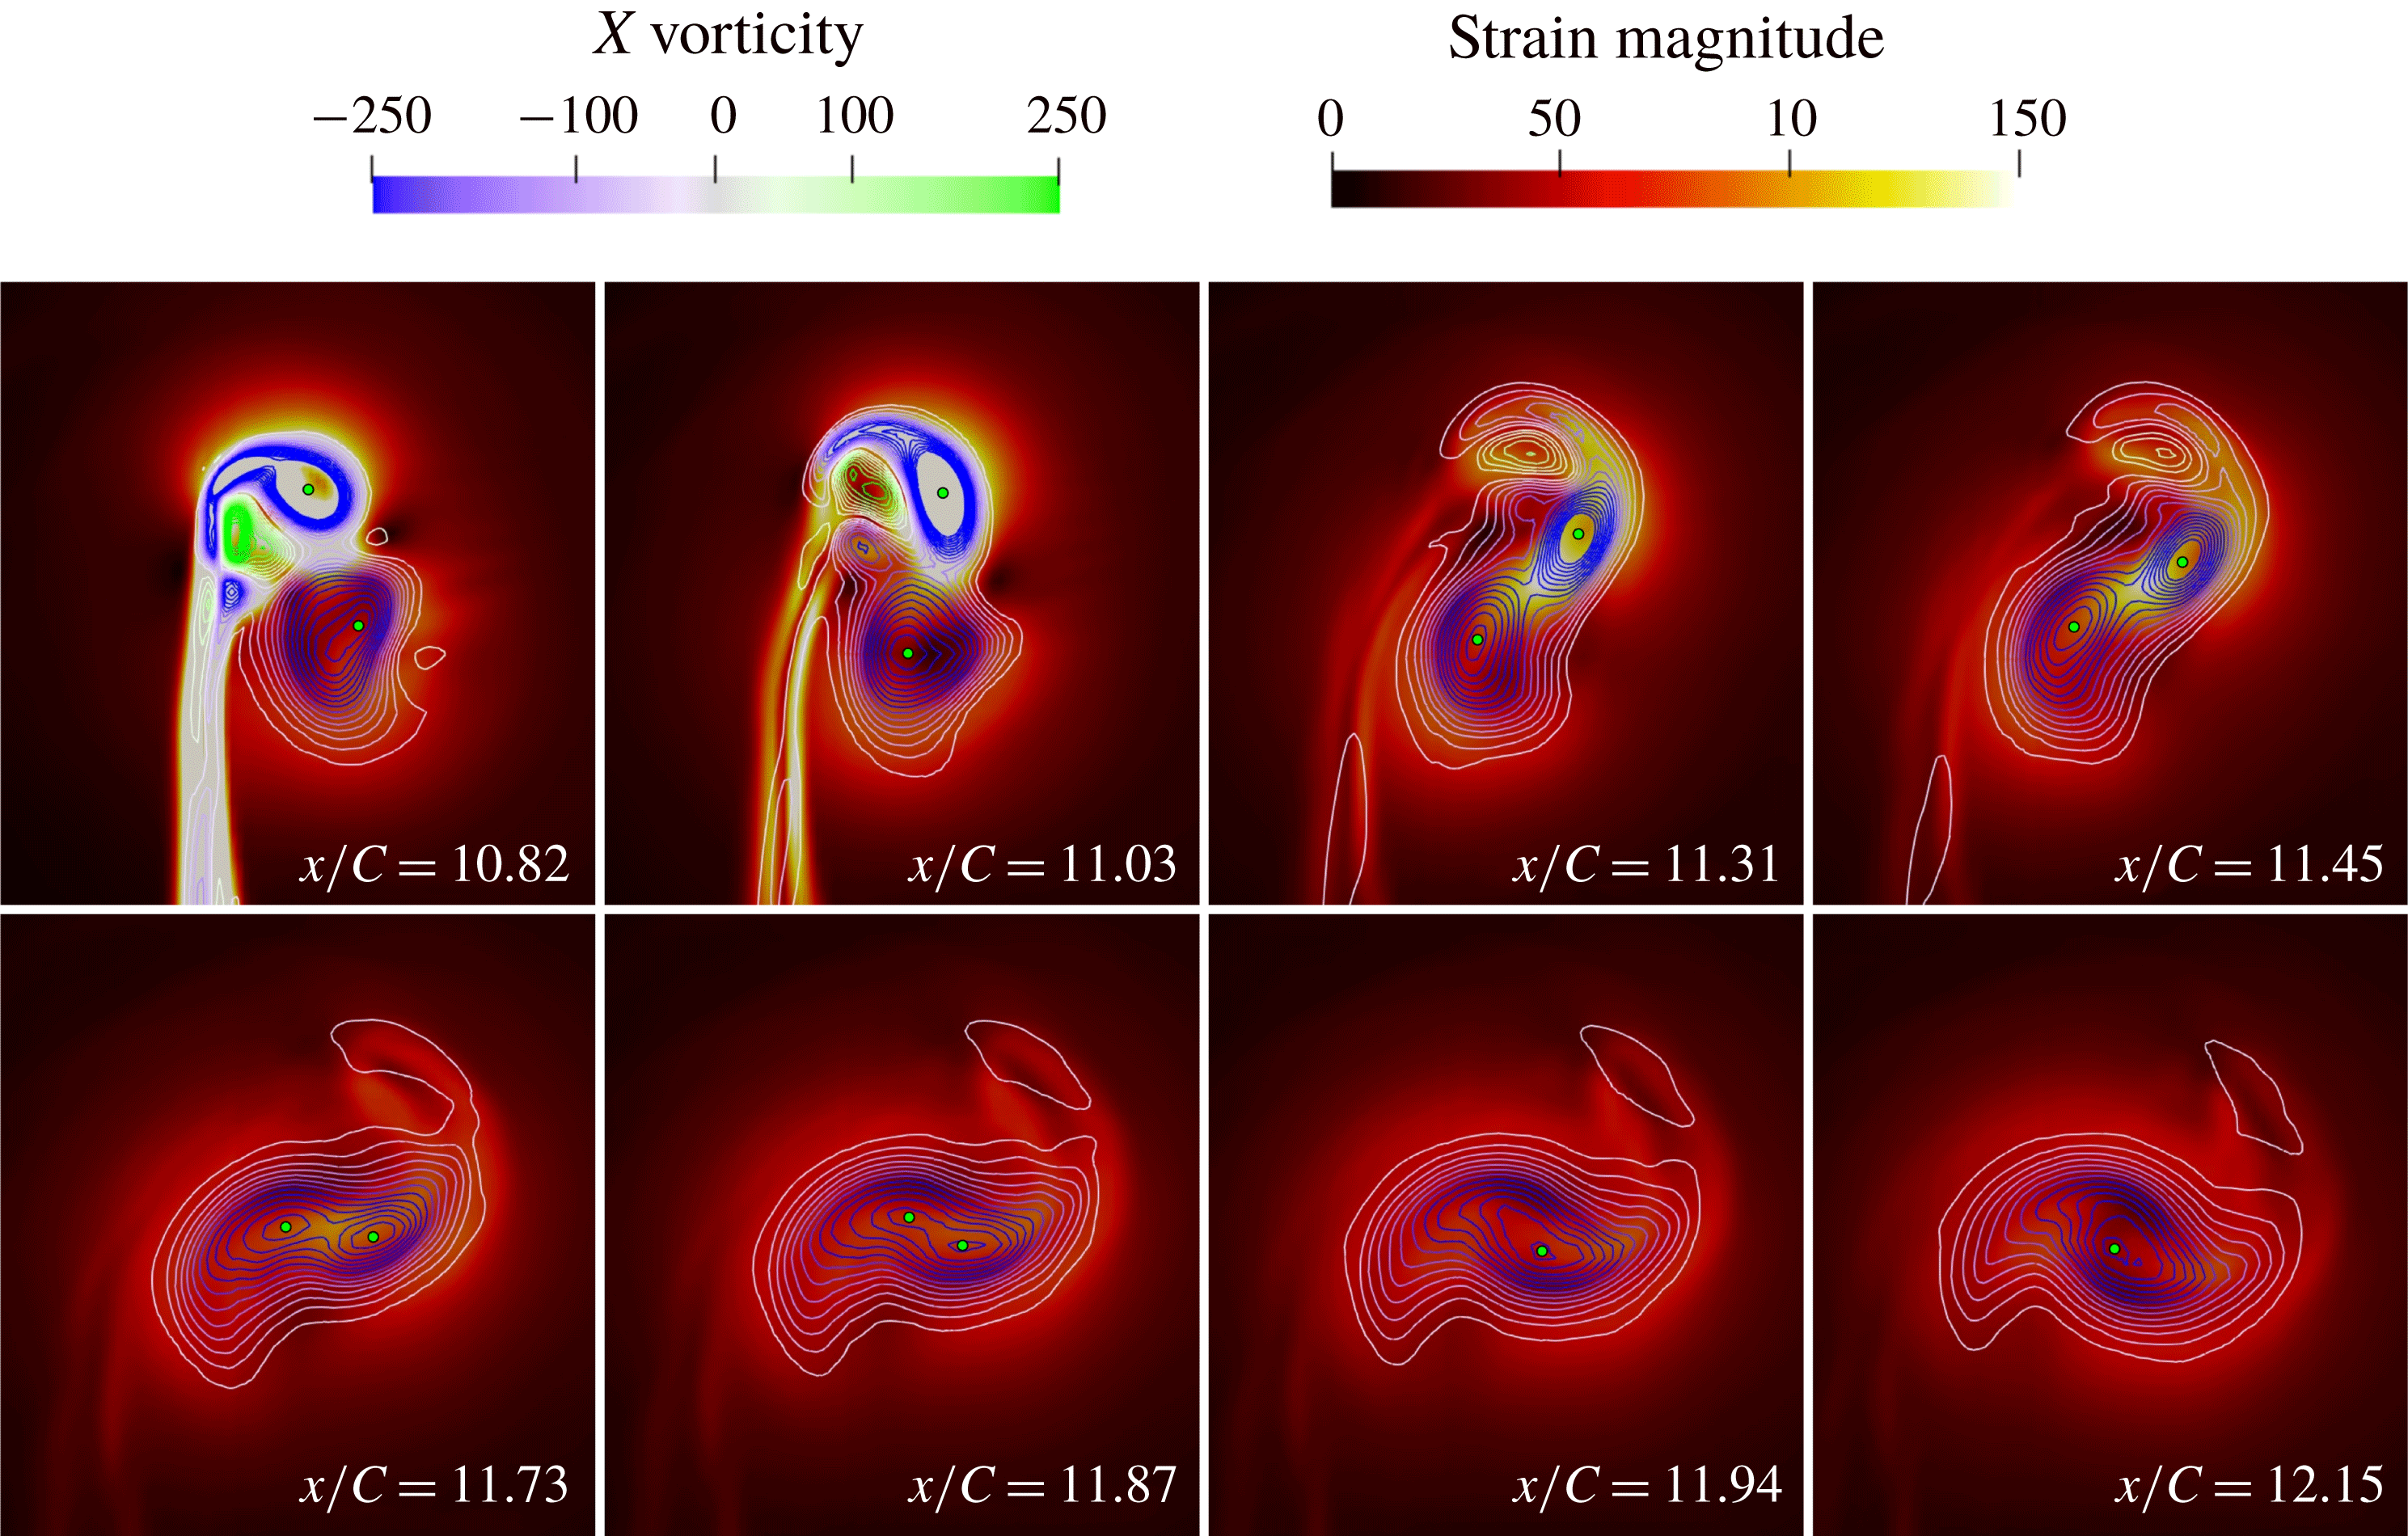
Further analysis of the strain and vorticity fields as they progress downstream allows the merging physics to be more effectively visualised, as can be seen in figures 10 and 11. The initial near-field interactions of the
 $-0.2C$
offset case result in the roll up of a counter-rotating structure off the end of the suction surface. This structure encounters an initial period of high strain, during which it sits between the tip vortex and the sheet vorticity which is rolled up just below the tip. This can be seen at
 $x/C=11.03$
. Following this, the structures rise and form a counter-rotating pair above the main co-rotating vortex pair, visible at
 $x/C=11.31$
. While the primary downstream vortex is initially highly strained through its formation, this quickly relaxes downstream of the vane by
 $x/C=11.31$
as the vortex normalises into a more axisymmetric structure. The comparatively larger upstream vortex becomes more strained and elliptical as it travels downstream. In some transient instances the previously mentioned bifurcation of the upstream vortex occurs, visible in the multiple vorticity peaks identified at
 $x/C=11.45$
. While there is a high level of strain in the upstream vortex during this process, this vortex does not necessarily encounter full straining out. As can be seen in figure 10 the peak strain from the upstream vortex can spread across the centre of the two-vortex system, particularly visible at
 $x/C=11.73$
and
 $x/C=11.87$
. This results in the eventual homogenisation of the two vortices of the system, and a merger which fluctuates between being strongly or weakly asymmetric in the final stages. Following this process, the merged vortex becomes more uniform and relaxes. Many of these features are smeared by the time-averaged result of figure 11, with much of the straining effects of the secondary vortex being damped out. In the time-averaged analysis, after the tip vortex roll-up strain has weakened, the strain is predominantly concentrated between the two vortices, most clearly visible from
 $x/C=11.73$
onwards. This shows little indication of a bias of strain to the upstream vortex during the merging process. From this result, the merger also appears far more symmetric, as opposed to the clear fluctuating asymmetry of the transient analysis.
Instantaneous contours of
 $X$
vorticity laid over contours of in-plane strain magnitude as vortices progress downstream for the co-rotating
 $-0.2C$
offset case. The location of peak vorticity for each vortex is indicated by a green circle.

Time-averaged contours of
 $X$
vorticity laid over contours of in-plane strain magnitude as vortices progress downstream for the co-rotating
 $-0.2C$
offset case. The location of peak vorticity for each vortex is indicated by a green circle. Note contour scales are different to previous figure to correct for time-averaging smearing.
In the
 $0.2C$
offset case, the larger spacing between the vortices resulted in a far more stable merging mechanism. Consequently, the time-averaged and instantaneous results were in reasonably close agreement for this condition. Initially, a small amount of counter-rotating vorticity is rolled up off the tip of the downstream vane, however this quickly dissipates leaving the two primary vortices remaining and little in the way of secondary structures. These vortices then travel downstream for at least 15 chord lengths before exhibiting significant merging phenomena in either a time-averaged or transient sense. As will be discussed in detail later in this section, oscillations in the position of each vortex core resulted in a variance in separation distance downstream both spatially and temporally. This caused the vortices to effectively merge and unmerge at a given plane. When inspected through the instantaneous planes of figure 12, it could be seen that the vortices draw slowly together between
 $x/C=25$
and
 $x/C=27.5$
, as expected, before encountering merging of the downstream vortex into the upstream vortex. Through the initial stages of this process the strain of the vortex pair is concentrated between the two vortices. However, the unequal strengths of the vortices typically result in the weaker of the two being strained out as they progress downstream. This forms a tail-like structure on the upstream vortex visible from
 $x/C=28$
onwards, eventually relaxing into a round, uniform vortex further downstream. These effects are largely the same in the time-averaged condition (figure 13). The exception to this is the straining of the secondary vortex being far less pronounced, with a more steady transfer of vorticity from one vortex to another rather than a rapid elongation and straining out of one vortex.
Whilst the local strain influences of the vane in the near offset
 $-0.2C$
case makes it difficult to obtain an accurate assessment of the vortex interaction using the strain rate parameter, in the
 $0.2C$
offset case the significant distance to the vane allows this parameter to be considered. The mutuality parameter (Folz & Nomura Reference Folz and Nomura2017) can be calculated as the ratio of the strain rate parameter at one vortex core to the other, defined as follows, calculated at the location of peak vorticity:
 $$\begin{eqnarray}MP=(S/\unicode[STIX]{x1D714})_{1}/(S/\unicode[STIX]{x1D714})_{2}.\end{eqnarray}$$
In the case of the
 $0.2C$
offset case, the MP is observed to vary during the downstream travel of the vortex interaction. Within the
 $x$
-slices observed in figure 12 and using the stronger (upstream) vortex as the primary vortex, the MP is observed to be 1.22 at
 $x/C=25$
, before rising to 1.57 at
 $x/C=26.5$
. It then steadily decreases to 0.26 by
 $x/C=29.5$
, following which the two vortices merge. This is consistent with the findings of Folz & Nomura (Reference Folz and Nomura2017) in that the mutuality parameter being above 1 resulted in the upstream vortex dominating the interaction and merger.
Instantaneous contours of
 $X$
vorticity laid over contours of in-plane strain magnitude as vortices progress downstream for the co-rotating
 $0.2C$
offset case. The location of peak vorticity for each vortex is indicated by a green circle.

Time-averaged contours of
 $X$
vorticity laid over contours of in-plane strain magnitude as vortices progress downstream for the co-rotating
 $0.2C$
offset case. The location of peak vorticity for each vortex is indicated by a green circle. Note contour scales are different to previous figure to correct for time-averaging smearing.

Interpretation guide for distance–time contour plots.

As discussed previously, only the far offset
 $0.2C$
co-rotating condition was evaluated with the transient vortex tracking methodology, over a time period of
 $T\ast U_{\infty }/C=12$
. The key properties tracked by this process were vortex position and circulation, with vortex separation and circulation differential calculated from these parameters. To interpret the following contour plots, one can think of a horizontal line drawn through the domain indicating the state of the vortices at any given time, while a vertical line gives a time history of the vortices on a given plane. A graphical indication of the method of interpretation can be seen in figure 14.
 $Y$
and
 $Z$
positions of upstream (a,b) and downstream (c,d) vortices with respect to time (vertical axis) and distance travelled downstream (horizontal axis) for the
 $0.2C$
offset condition. Rapid changes in position from
 $x/C=20$
onwards caused by detection of a merged state.

The positions of the upstream and downstream vortices in the horizontal
 $(y)$
and vertical
 $(z)$
directions can be seen in figure 15. As the vortices travel through the domain they rotate in a helical manner, resulting in a long duration spatial fluctuation. An example of this can be seen in the transition of the upstream
 $Z$
position from an average value around
 $-0.05C$
at
 $x/C=15$
to
 $-0.45C$
at
 $x/C=23$
. What is more interesting from these graphs is the nature of the fluctuations in position and their propagation downstream. A clear periodicity can be seen in all of the position traces, visible from the start of the domain in the upstream vortex and developing more towards the end of the downstream vortex domain. Approximately two and a half primary fluctuation periods can be seen within the domain, indicating a dominant fluctuation frequency approaching
 $Str=25$
. This fluctuation frequency is similar between the two vortices, and will be discussed in more detail later in this section. It is also evident from the plots of the downstream vortex that the magnitude of the fluctuation increases significantly with motion downstream.
Deviation from average position of upstream (a) and downstream (b) vortices with respect to time (vertical axis) and distance travelled downstream (horizontal axis) for the
 $0.2C$
offset condition.

By inspecting the deviation from the averaged vortex location on a given plane the magnitude of the fluctuations could be more clearly analysed (figure 16). The near zero deviation in the downstream vortex just behind the rear vane is expected due to its proximity to its formation location, however as the vortex progresses downstream its amplitude of deviation grows to match that of the upstream vortex at
 $0.17C$
. The deviation of the upstream vortex is also seen to grow with distance downstream, peaking at
 $x/C=22$
. The peaks in deviation occur over a relatively short distance, and propagate downstream, however there is clear interaction between the peaks of the upstream and downstream vortex. By tracing along the diagonal peaks line starting at
 $x/C=16$
, it can be seen that this initially manifests as a peak in the downstream vortex before switching to the largest peak of the upstream vortex and then returning to the downstream vortex peaking. Whilst one vortex is at peak deviation, the other is closest to its average values, showing a clear in-phase motion.
Separation between vortices with respect to time (vertical axis) and distance travelled downstream (horizontal axis) for the
 $0.2C$
offset condition.

However, the separation changes are not directly reflective of these deviation changes, with results seen in figure 17. Following the same diagonal fluctuation as previously discussed from
 $x/C=16$
it can be seen that the vortex separation remains within
 $0.02C$
consistency until
 $x/C=22$
, at which point it starts to rapidly increase by
 $0.06C$
to
 $0.4C$
by
 $x/C=24$
. This pattern is similarly reflected in the cycle starting at
 $x/C=12$
, which encounters a similar step at
 $x/C=20$
, indicating that despite significant cycle to cycle variance there is still a fundamental pattern in the vortex meandering which is followed. Another significant observation is that when the instantaneous results are considered the fluctuations can result in the downstream vortex separation being larger than the upstream separation, despite the tendencies of the vortices to migrate towards each other. From the fluctuations observed, it appears that a degree of separation trend reversal also occurs, causing the vortices to meander back together after an extended separation. In the bottom right corner (as well as further up the right side) a number of blanked out values can be seen, these correlate with locations of vortex merger. This merger in the instantaneous sense clearly happens when the separation distances fluctuate to a minima at the critical merging distance, as identified in experimental work (Forster et al.
Reference Forster, Barber, Diasinos and Doig2017b
). These fluctuations happen just before a point of local maxima, and produce a vortex merger which propagates downstream. This instantaneous vortex merger, which can form well upstream of the time-averaged merging location, propagates downstream. This explains the properties observed by Forster et al. (Reference Forster, Barber, Diasinos and Doig2017b
), namely the statistical variance in vortex merging position.
Non-dimensionalised circulation variation with respect to time (vertical axis) and distance travelled downstream (horizontal axis) for the
 $0.2C$
offset condition. Upstream vortex (a), downstream vortex (b), differential between vortices (c).

While contour plots can be used effectively for the separations and vortex core locations, this is primarily due to the dominant forcing of the low frequency fluctuations overwhelming the higher frequency, smaller amplitude oscillations in core location. In the case of circulation however, the fluctuations occur at a far higher frequency, and often with a less consistent direction than location, and as such contour plots, while clear for location, become very unclear for circulation. For the purposes of transient circulation tracking, the circulation was calculated as the area integral enclosed by the region up to 10 % of the peak vorticity of the vortex, non-dimensionalised against the speed and chord length of the vane. As such the circulation of the two vortices, as well as the circulation difference between the two, is represented in the contoured lines of figure 18. At the start of vortex interaction the fluctuations are small, random and high frequency, however, as the vortices progress through the domain they become more coherent and traceable changes. In the bottom right corner the high upstream circulation, low downstream circulation and large circulation difference can be seen at the point of vortex merger. In both the upstream vortex and the first
 $10C$
downstream of the downstream vortex there is very little variation in the average value of circulation. However after
 $x/C=20$
in the downstream vortex there is a significant drop-off in the circulation from
 $0.3$
to
 $0.25~\text{m}^{2}~\text{s}^{-1}$
as the asymmetric merging mechanism initiates. This is accompanied by a significant differential in circulation, as the variation in the upstream vortex circulation is comparatively small. The lowest circulation values in the upstream vortex correlate with the smallest separation values experienced by the vortex pairs, with larger circulation typically associated with larger separations. The smallest differential between circulations is also located along the lines of closest separations.
 $Z$
position
 $(C)$
evolution with time for downstream vortex at multiple downstream locations (black), with frequency spectra in red. Position signals are all plotted on axes with the same range magnitude.

 $Z$
position
 $(C)$
evolution with time for upstream vortex at multiple downstream locations (black), with frequency spectra in red. Position signals are all plotted on axes with the same range magnitude.

To gain a better understanding of the rate and growth of the transience of the vortex positions, the frequency spectra of the position signals at various locations downstream were analysed, with the downstream
 $Z$
variance presented in figure 19 and the upstream variance presented in figure 20. While the rotation of the vortex pair does modify the effective axis of the vortex oscillation with respect to the other vortex, the key trends identified in the
 $Z$
position were also present in the
 $Y$
position plots. As such, only the
 $Z$
position has been presented for clarity. The previously discussed growth in the downstream vortex signal can be clearly seen, with 22.9 % less fluctuation magnitude at
 $x/C=14$
than
 $x/C=19$
. For the downstream vortex at
 $x/C=14$
, the small-scale, high frequency fluctuations are still significant with respect to the larger fluctuations, as evidenced by the lack of a consistent low frequency response above
 $2\times 10^{-4}$
at frequencies below
 $Str=50$
. As the vortex progresses downstream the amplitude of oscillations increases by a factor of four, with a significant bias to increasing the lower frequency magnitudes. The range of frequencies above
 $10^{-4}~\text{C}$
magnitude increases from
 $Str=0{-}10$
to
 $Str=0{-}100$
by
 $x/C=18$
, with little consistent variation in the higher frequency magnitudes from
 $x/C=15$
onwards. As such the bias of the downstream vortex strongly shifts from high frequency, lower amplitude oscillations to a longer wavelength instability as the flow moves downstream. The low frequency of the fluctuations as the flow progresses downstream indicates a phenomenon somewhat similar to the long wave instability and vortex meandering, more so than the elliptic instability.
Inspecting the upstream vortex, it could be seen that the initial fluctuations were significantly higher, in the order of 2.5 times that of the downstream vortex at
 $x/C=14$
. Growth is also seen in the upstream vortex, although to a lesser extent, with the
 $x/C=19$
fluctuation magnitude being 217 % larger than the fluctuation at
 $x/C=14$
. The fluctuation magnitudes trend towards convergence between the upstream and downstream vortices, with a difference in magnitude by the
 $x/C=19$
of 23.7 % as opposed to 148 % at
 $x/C=14$
. Observing the frequency trends reveals that the upstream vortex behaves slightly differently to the downstream vortex with respect to the magnitude of its lower frequencies, with the
 $10^{-4}C$
intensity band stretching from
 $Str=0{-}50$
at
 $x/C=14$
, five times wider than the downstream vortex. However this band does not exhibit the same level of growth, with lesser intensities observed downstream at
 $Str=100$
, as well as a slightly faster frequency drop-off. However, it appears that the interaction of these vortices causes them to both equalise their instabilities to the same magnitudes and frequencies of oscillation.
5.2 Counter-rotating condition
The counter-rotating conditions had the highest dissipation rates and instabilities observed in the experimental results (Forster et al.
Reference Forster, Barber, Diasinos and Doig2017c
), and as such it was expected that the LES analysis would show very significant transience. This was particularly true for the
 $0.2C$
offset condition presented in figure 21, which showed a large difference between the time averaged and instantaneous results. Despite evidence of the long wave instability in the pressure contours,
 $x$
-vorticity was used at the location of the planar slices, since the dominant vorticity component of the vortex is aligned with the freestream flow direction at all slices taken. This provides the vorticity information from the vorticity magnitude, however with significantly reduced noise from vortex shedding. In addition to the small deviation waviness in both vortex cores there was a periodic shedding of a large deviation instability resembling a vortex ring. This was not the dominant flow feature, hence was not observed in the time averaged results, however animations of the solution output during the simulation were inspected and these confirmed this as a periodic feature with a shedding frequency of
 $Str=7$
. While the vorticity strength and pressure deficit within the core was reduced by this deviation, it still maintained a circular vortex profile. Within this kinked vortex segment the
 $-0.4C_{p}$
isosurface ended, indicating less pressure deficit, however this same isosurface also extended
 $0.75C$
longer in the upstream vortex in the instantaneous condition than the time averaged case. The large vortex deviation produced a region of pressure higher than
 $-0.4C_{p}$
that when averaged would have the effect of a lower average pressure deficit, highlighting the modification of the time-averaged results from the meandering based vortex smearing.
Contours of
 $x$
-vorticity, with isosurfaces of pressure at
 $C_{p}=-0.4$
,
 $C_{p}=-0.16$
and
 $C_{p}=-0.08$
for rear vane at
 $0.2C$
offset in instantaneous (a) and time averaged (b) conditions.

Circulation
 $(\text{m}^{2}~\text{s}^{-1})$
evolution with time for downstream vortex (a), upstream vortex (b) and differential between two vortices (c). All graphs presented on identical axes with scales of equal magnitude range.

Nondimensionalised circulation evolution with time for downstream vortex (a) over an extended downstream range, with vortex separation
 $(C)$
(b).

Closer inspection of the transience of the interaction showed a strong link between the magnitude of the vortex separation and circulation, seen in figure 23. A clear diagonal line of exceptionally high separation (greater than
 $0.5C$
) can be seen starting from
 $x/C=13.5$
, propagating through the domain. This is indicative of the wave instability seen in figure 21. It can be seen that this instability grows through the domain, reaching a peak value around
 $0.55C$
before tracking of the secondary vortex is lost (indicated by the yellowed-out areas after
 $x/C=18$
). This correlates directly with the circulation trends, with the circulation of the downstream vortex being up to
 $0.03~\text{m}^{2}~\text{s}^{-1}$
higher than average at peak separation, and dropping considerably once the separation is reduced. This correlated with the inverse of the upstream vortex circulation, with the upstream vortex having reduced circulation at higher offsets. As such, the coupling between the vortices resulted in the upstream vortex imparting its circulation to the downstream one whilst moving apart, while when the instability brought the vortices close together the energy was more evenly spread between the two.
 $Z$
position
 $(C)$
evolution with time for upstream vortex at multiple downstream locations (black), with frequency spectra in red. Position signals are all plotted on axes with the same range magnitude.

 $Y$
position
 $(C)$
evolution with time for upstream vortex at multiple downstream locations (black), with frequency spectra in red. Position signals are all plotted on axes with the same range magnitude.

The position signals and frequency spectra of the upstream vortex are presented in figures 24 and 25. Unlike the co-rotating case there is a monotonic increasing of the entire frequency range across the domain, with the entire frequency spectra translating upwards from
 $x/C=11$
to
 $x/C=16$
. This is due to the counter-rotating case being able to manifest both the elliptic and long wave instabilities, with a bias to the larger long wave/Crow instabilities. The fluctuation magnitudes of both the
 $y$
and
 $z$
position values increase substantially through the domain presented, with a starting magnitude of
 $1.75\times 10^{-3}$
and
 $2.60\times 10^{-3}$
at
 $x/C=11$
and finishing magnitude of
 $2.61\times 10^{-2}$
and
 $14.7\times 10^{-2}$
at
 $x/C=16$
. The respective gains in fluctuation magnitude are 14.9 and 5.65 times respectively, showing a far more significant fluctuation gain in
 $y$
than
 $z$
. These oscillation magnitudes at
 $x/C=16$
are over 77.5 % greater than for the co-rotating case at
 $x/C=19$
, showing a considerably higher magnitude of deviation. This is consistent with the presence of the wave instability noted in the visualisation, which contributes to the much faster dissipation of energy in the counter-rotating case than the co-rotating case noted in the previous experimental work of the authors (Forster et al.
Reference Forster, Barber, Diasinos and Doig2017c
).
 $Z$
position
 $(C)$
evolution with time for downstream vortex at multiple downstream locations (black), with frequency spectra in red. Position signals are all plotted on axes with the same range magnitude.

 $Y$
position
 $(C)$
evolution with time for downstream vortex at multiple downstream locations (black), with frequency spectra in red. Position signals are all plotted on axes with the same range magnitude.

Similar trends are seen in the oscillation of the downstream vortex, presented in figures 26 and 27. For this condition the fluctuation magnitudes of the
 $y$
and
 $z$
position values are
 $5.5\times 10^{-4}$
and
 $9.0\times 10^{-4}$
at
 $x/C=11$
and finishing magnitude of
 $2.61\times 10^{-2}$
and
 $4.96\times 10^{-3}$
at
 $x/C=16$
. Again this vortex exhibited a far higher grown in instability on the
 $y$
axis than the
 $z$
axis, showing that this was not just a simple consequence of vortex pair rotation of a
 $45^{\circ }$
crow instability, as this would cause one vortex to grow in
 $Y$
instability and the other to reduce. Peak
 $y$
value correlated approximately with minimum
 $z$
value by
 $x/C=16$
, however the correlation was far less defined prior to
 $x/C=14$
. As such, the instabilities could be seen to develop more clearly downstream into longer wavelengths, with larger oscillations at lower frequency, while closer to the vane they were being driven more by on-vane characteristics such as vortex shedding at the tip.
In the direct impingement condition (
 $-0.2C$
offset) far less unsteadiness and instability was seen, with a stable downstream vortex and largely destroyed upstream vortex. The impingement of the upstream vortex on the downstream vane did not cause breakdown of the upstream vortex, instead forcing the vortex to bifurcate. This is due to the pressure gradient on the front of the vane being of insufficient magnitude and distance to force a full vortex breakdown. The vortex segment on the pressure side of the downstream vane is drawn towards the tip by the spanwise movement of the flow. This process forces the direct interaction with the pressure surface/tip vortex and rapid dissipation of the vorticity from the upstream core, completely eliminating the vortex by the trailing edge of the vane. On the suction side of the vane the bifurcated vortex is forced downwards along the vane surface by the spanwise flow. This causes a significant increase in vortex spacing, similar to what was seen in earlier RANS studies and the experimental work by the authors (Forster et al.
Reference Forster, Barber, Diasinos and Doig2015, Reference Forster, Barber, Diasinos and Doig2017c
).
Contours of
 $x$
-vorticity, with isosurfaces of pressure at
 $C_{p}=-0.4$
and
 $C_{p}=-0.16$
for rear vane at
 $-0.2C$
offset (right).

The reduced strength of the upstream vortex in conjunction with the high separation results in the significantly reduced rotational rate of the vortex pair at this offset. By forcing the rotating vortex into such close proximity with the vane, the shear within the boundary layer is increased. This creates an enhanced region of positive vorticity on the surface of the vane, inboard of the tip. This region is of similar circulation magnitude to the remaining upstream vortex, however is highly strained, with little circularity. This causes it to break down into two separate vortices once off the vane body, with one interacting with the upstream vortex remnant forming a rotating vortex pair. The other vortex moves towards the downstream tip vortex, however dissipates rapidly. The drawn out tail structure of this upper vortex pair shows behaviour similar to that of the asymmetric co-rotating merging process, with a rapid transfer of vorticity into the primary vortex. At the same time, the lower counter-rotating pair then behaves like the counter-rotating
 $0.2C$
offset case, with a high rate of circulation dissipation and a high local rotation rate. The final outcome of these interactions in the far field is a singular downstream vortex, with minimal remnants of the upstream vortex.
 $Y$
position (a) and
 $Z$
position (b) for downstream vortex.

The evolution of the downstream vortex position with respect to time can be seen in figure 29. Similar to the downstream vortex in the co-rotating case, immediately behind the downstream vane the oscillations in position are small, with increased growth throughout the domain. However the fluctuation rates are far less significant than the other transient cases. The peak
 $y$
position amplitude of
 $0.06C$
at
 $x/C=16$
is less than half of the equivalent amplitude in the co-rotating
 $0.2C$
offset case, and 40 % of the counter-rotating
 $0.2C$
offset case. This is due to the lack of a strong secondary vortex structure, which cannot introduce elliptic or long-wavelength instabilities into the downstream vortex. As such the primary mechanism for fluctuation growth is the downstream amplification of instabilities caused by the initial vortex interaction and vortex shedding previously discussed. The progressive migration of the vortex towards
 $+y$
and
 $-z$
can also be seen, driven by the downwash of the vane.
A more complete picture of the instability growth can be seen when the individual position signals and frequency spectra in figures 30 and 31. The comparative lack of meandering growth to the other transient cases can be seen by the high starting and low finishing oscillation magnitudes, with
 $3.5\times 10^{-3}$
at
 $x/C=12$
being higher than either of the starting magnitudes for the counter-rotating
 $0.2C$
offset case. At
 $x/C=16$
the magnitude is
 $8.5\times 10^{-3}$
, which is significantly lower than the
 $1.18\times 10^{-2}$
seen in the counter-rotating
 $0.2C$
offset case, demonstrating this low instability growth rate. However, inspecting the frequency spectra shows that the majority of the oscillations in the
 $-0.2C$
offset case are higher frequency than the other cases, with significant fluctuations in the
 $Str=300{-}400$
frequency band above
 $10^{-6}$
up to
 $x/C=16$
. This is a direct result of the increased interactions on the vane body causing high frequency changes in on-vane characteristics, and subsequently minimal downstream vortex interaction due to the largely destroyed upstream vortex core.
 $Z$
position
 $(C)$
evolution with time for downstream vortex at multiple downstream locations (black), with frequency spectra in red. Position signals are all plotted on axes with the same range magnitude.

 $Y$
position
 $(C)$
evolution with time for downstream vortex at multiple downstream locations (black), with frequency spectra in red. Position signals are all plotted on axes with the same range magnitude.

Nondimensionalised circulation evolution with time for downstream vortex.

These fluctuations in position showed a far less clear correlation with circulation than in the other transient cases presented. The circulation values presented in figure 32 showed an average reduction in circulation throughout the domain, with an uneven periodicity with time. The fluctuations in circulation closer to the rear vane occurred with a significantly higher primary frequency, and less of a smooth periodicity. This was a result of the transience of the suction side bifurcated upstream vortex modifying the shear layer and consequently altering whether or not the secondary positive vortex had merged with the primary, as discussed earlier and seen in figure 28. As the flow progresses downstream these fluctuations diffuse and spread out in space, leading them to bleed into the surrounding time regions. These results in the smoother fluctuations in circulation seen by the end of the domain. While the correlation with position was generally weak as previously mentioned, trends could be seen when compared to
 $y$
position, with peaks in
 $y$
position fluctuation associated with higher circulation values. It is likely that this has resulted from the interactions on the vane producing varying levels of vane downwash, the higher this downwash the more kinetic energy available to be rolled into the vortex. Higher
 $y$
values result from a more significant downwash, hence the correlation between
 $y$
value and circulation is understandable.
6 Conclusions
LES was performed to characterise the mechanisms arising from the downstream interactions of the vortex pair produced by two offset vanes. NACA0012 wings of 1.5 aspect ratio, at
 $8^{\circ }$
angle of attack and a Reynolds number of 70 000 were used for this study, spaced
 $10C$
apart in the streamwise direction. Key cases in both the co-rotating and counter-rotating regimes were identified, and were analysed with both instantaneous and time averaged methods to ascertain the key flow mechanisms behind the effects observed in prior experiments (Forster et al.
Reference Forster, Barber, Diasinos and Doig2017a
,Reference Forster, Barber, Diasinos and Doig
b
,Reference Forster, Barber, Diasinos and Doig
c
).
It was found that the tendency of the downstream vortex to merge with the upstream in the co-rotating condition was driven by the suppression of one of the two tip vortices created at the downstream vane, resulting in a much weaker vane vortex than in either the freestream condition of the upstream vane or the counter rotating condition. This, in conjunction with a lift reduction from the presence of the upstream vortex, resulted in the merger trend observed. However, at extremely close proximities on the pressure side, the vane elongated the shape of the upstream vortex, ultimately resulting in it being the weaker of the two and merging into the downstream vortex. This produced a highly strained vortex, with transient production of bifurcated vortices in the wake region. The instabilities produced by interacting the vortices at far ranges were found to tend towards equalisation between the two vortices rather than one dominating over the other, despite the difference in vortex formation length. The instabilities and meandering between the two vortices was found to be responsible for the statistical merging phenomenon seen in prior work (Forster et al. Reference Forster, Barber, Diasinos and Doig2017b ), with the vortices merging once the meander caused the separation between the vortices to reach the critical spacing.
The counter-rotating far offset condition was found to produce instabilities of a greater magnitude than the co-rotating condition, with a periodic large sinusoidal deviation forming. However this deviation was very unsteady in its shedding, and did not form continuously. It was found that the circulation transfer between the vortices was linked to the magnitude of their separation, with high separation fluctuations weakening the upstream vortex and strengthening the downstream vortex. The magnitude of both the small scale, high frequency and large scale, low frequency oscillations was found to increase with distance downstream. In the case of upstream vortex impingement, the upstream vortex was found to bifurcate instead of break down, with the pressure side bifurcation rapidly dissipating. The tip/suction surface vortex was forced downwards, creating the vortex remnant identified in the prior experimental work (Forster et al. Reference Forster, Barber, Diasinos and Doig2017c ). A four vortex system was created in the process by the interactions with the shear layer, exhibiting all the interaction mechanisms previously investigated. The result of these interactions was a single dominant vortex, which did not magnify its amplitudes of oscillation significantly as it travelled downstream due to the destruction of all interacting vortices.



