1. INTRODUCTION
1.1. Applications of Mobility Models (MMs)
Research in Mobility Models (MMs) has mainly been applied to planning tasks; such as estimating pedestrian flows when planning a train station or an airport, or optimization of evacuation procedures and evacuation paths for a large shopping mall or a theatre (Helbing, Reference Helbing1992; Teknomo, Reference Teknomo2002; Okazakia and Matsushitaa, Reference Okazakia and Matsushitaa1993). Another application area which is becoming increasingly important is dynamic indoor positioning and navigation. The reason that a MM is needed in these cases lies in the dynamic nature of most pedestrian indoor navigation applications: The user's position will be estimated continuously so as to allow services such as personalized travel assistance or indoor navigation directions. In addition, it can be shown that a dynamic positioning system is more accurate than a ‘single-shot’ static estimator which essentially provides a position estimate based on positioning measurements of a single time instance. To implement mathematically fitting dynamic estimators, one needs an accurate and realistic MM (also known as the a priori state transition model) of the dynamic system. In dynamic estimators such as sequential Bayesian estimators, the more ‘predictable’ the system state transitions are, the more the measurements can be filtered over time. If measurements happen to be unavailable for one or more time steps, then the state transition (movement) model allows a prediction of the state estimate.
Another application of the MM presented here is in the validation of indoor positioning systems by simulating realistic pedestrian traces, and applying these traces as the controlling parameters of a system that simulates sensors such as GNSS receivers indoors.
A movement model that is useful for pedestrian navigation should fulfil the following requirements:
• It must be statistically accurate in describing the state transition probabilities Prob{x k|x k−1} and able to efficiently draw samples from it.
• It must incorporate at least position, speed and heading, taking into account individual variances among users.
• It must take into account the known building layout in Two Dimensions (2D) and Three Dimensions (3D).
1.2. Summary of Related Work
According to the application, the focus might vary among different forms of pedestrian MMs. For example, only statistical measures like means and densities might be of interest when modelling pedestrian groups. On the other hand, a detailed model of pedestrian behaviour is of interest for other applications such as navigation, which is the main application in this paper.
Models for pedestrian movement are developed at three different levels. They are the mezoscopic, the macroscopic and the microscopic levels (Helbing, Reference Helbing1992; Teknomo, Reference Teknomo2002). All levels of description of pedestrian MMs take into account pedestrian intentions and interactions. Geographical, spatial and geometrical environments are essential parameters that have to be considered in a reasonable pedestrian model. A microscopic description is more of interest in the navigation domain since pedestrian navigation is normally done on an individual basis. Accordingly, the microscopic description is the one considered in this paper.
Several microscopic pedestrian simulation models can be found in the literature. They include the Social Force Model (Helbing and Molnar, Reference Helbing and Molnar1995; Lakoba et al., Reference Lakoba, Kaup and Finkelstein2005), the Magnetic Force Model (Okazakia and Matsushitaa, Reference Okazakia and Matsushitaa1993), the Benefit Cost Model (Ressel, Reference Ressel2004; Teknomo, Reference Teknomo2002), the Cellular Automata Model (Yang et al., Reference Yang, Fang, Li, Huang and Fan2003; Weifang et al., Reference Weifang, Lizhong and Fan2003; Dijkstra et al., Reference Dijkstra, Jessurun and Timmermans2001), and the Queuing Network Model (MacGregor Smith, Reference MacGregor-Smith1998; Osorio and Bierlaire, Reference Osorio and Bierlaire1998).
The state of the art in navigation MMs are random walks, which belong to the microscopic level. Several versions of random walks can be found in the literature such as:
• State space based random walks, which assume that the pedestrian movement and its observation can be represented by a known mathematical representation. White Noise Acceleration model is an example of these models in which the pedestrian acceleration is modelled using an independent white noise process (Bar-Shalom, Reference Bar-Shalom, Rong Li and Kirubarajan2001).
• Random waypoint models, in which the pedestrian is following a uniform distribution to select a waypoint from a list of possible waypoints with a fixed speed (Hyytiä et al., Reference Hyytiä, Lassila and Virtamo2006). Some extensions are made in the literature to these models such as adding a pause time at each node and adding different velocities between the nodes.
• Brownian motion, which uses the model of random movement of particles suspended in a fluid (Banos and Charpentier, Reference Banos and Charpentier2007). It is sometimes referred to as particle theory.
• Drunkard's walk models, where a model for a drunken person walking down the street is used to model the pedestrian movement (Sharma and Vishwamittar, Reference Sharma and Vishwamittar2005).
• Lévy flight models, which use step-lengths that are distributed according to a heavy-tailed probability distribution and an angular direction that is uniformly distributed (Rhee, Reference Rhee2008).
1.2.1. Map Matching
In general, map matching is the concept in which tracking data and MMs are related to maps (Brakatsoulas et al., Reference Brakatsoulas, Pfoser, Wenk and Salas2005; Scott, Reference Scott1994). The overall objective is to increase the accuracy of positioning using the knowledge that the tracked object is restricted in movement or position according to the map. Map matching can occur in real-time or offline according to the application.
There are two different types of map matching; we will refer to them as classical map matching, and movement model based map matching. In classical map matching, the objective is to improve the location estimation by snapping the measurements to the nearest path (polyline) in the map (Brakatsoulas et al., Reference Brakatsoulas, Pfoser, Wenk and Salas2005; Tradišauskas et al., Reference Tradišauskas, Tiešytėdalia and Jensen2004). On the other hand, movement model based map matching uses the map to restrict the otherwise probabilistic movement of the tracked object. Accordingly, the tracked object will only move in allowed areas and with a speed that is affected by obstacles and steepness at the position of the tracked object in the map. Examples of such maps are roadmaps, topographical maps and floor plans.
1.2.2. Target Driven MMs
In (Kammann et al., Reference Kammann, Angermann and Lami2003), a diffusion based MM was introduced. This model is derived from the principle of gas diffusion in space studied in thermodynamics and is a standard solution for path finding of robots (Schmidt and Azam, Reference Schmidt and Azam1993). The idea is to model a source continuously effusing gas that disperses in free space and gets absorbed by walls and other obstacles. In (Kammann et al., Reference Kammann, Angermann and Lami2003) path finding with the diffusion model is compared to the Lee algorithm (Lee, Reference Lee1961). It is shown that the diffusion algorithm provides a more realistic path than the one generated by using Lee's algorithm, since the path maintains a distance from obstacles. The model computes a very realistic pedestrian path between two given locations. It was used to model two dimensional pedestrian movement in the context of positioning with sequential Bayesian estimators (Khider et al., Reference Khider, Kaiser, Robertson and Angermann2008). The two locations were interpreted as follows: one is the location of a particle in a particle filter realization of the estimator; the other is some destination point which comprises a part of the state space (of the particles). Naturally, the destination point is usually unknown and the state space dimension of possible destinations is practically infinite. However, realistic models are attainable by allowing the state space to include only destinations that are nearby, such as places in the building and some areas outside the building. In a particle filter implementation, particles are assumed to be directed towards a randomly chosen destination (that also changes according to a Markov process) and will be weighted by their compatibility to their target.
In summary, it is important to understand that we use the concept of “destination” to refer to one of the states of a particle filter, and we assume that it is unknown. Modelling the destination allows the MM to match the compatibility of a particle's current motion with a destination. We do this in order to have the two locations required by the diffusion algorithm.
In a practical implementation, the algorithm pre-computes and stores angles from all points in the area of interest to a sufficiently large number of destination points. This allows for an efficient implementation.
2. A COMBINED 3D-MM
In this paper, two MMs are combined: Diffusion Movement Model (DMM) and Stochastic Behavioural Movement Model (SBMM). The DMM is well suited for a goal-oriented movement, while the SBMM is adequate for a non-goal-oriented movement. Details of our work in both models and their combining approach to cover both types of movement will be given next.
2.1. Three Dimensional Diffusion Movement Model (3D-DMM)
As mentioned earlier, to take into account goal-oriented movement, the DMM is applied (Kammann et al., Reference Kammann, Angermann and Lami2003). This is now extended for using outdoor maps and for handling 3D, where an improved angle calculation approach is applied. The principle of the diffusion matrix calculation that incorporates outdoor maps is described in Section 2.1.1. The computation of the traces and angles is explained in Section 2.1.2.
2.1.1. A Diffusion Matrix Incorporating Outdoor Maps
To keep the model's complexity low, the DMM is confined to a rectangular area. The central assumption of our model is that a pedestrian will walk along a ‘sensible’ path from the current location to some destination that is changing randomly. The ‘sensible’ path is determined by using the information of maps and floor plans within the computation of the diffusion matrix in indoor as well as in outdoor environments. Maps and floor plans contain useful information that influences pedestrian movement such as the different types of areas which have different degrees of accessibility. Examples of these areas are forests, fields, streets, ways, meadows, coppices, flowerbeds, houses and walls.
The layout map matrix L which is used in the computation of the diffusion matrix (Kammann et al., Reference Kammann, Angermann and Lami2003) is modified in order to handle different degrees of accessibility based on maps and floor plans. The new layout map matrix L is defined as:

where N x×N y is the size of a rectangle covering the area of interest. This means that for inaccessible points (e.g., walls and closed areas) the values of the layout map matrix are set to zero while for the accessible areas the layout map matrix will have values between 1 and 255 depending on the accessibility. The most accessible areas will have a value v of 1, whereas the least accessible area will have a value v of 255. The range is between 0 and 255 due to our selected memory-efficient 8-bit PCM-representation. The diffusion matrix calculation steps are as follows:
• For the rectangular area a set
 of N w destination points has to be specified, where each destination point represents a source effusing gas.
• For each destination point
(2)a so called diffusion matrix Dm is pre-computed. The diffusion matrix for a particular destination point contains the values for the gas concentration at each possible waypoint when gas effuses from that destination point. For this, a filter F of size n×n is applied:(3)The diffusion is expressed by a convolution of the diffusion matrix Dm with the filter matrix F element-wise multiplied by the layout map matrix L. Accordingly, the diffusion matrix element at raw i, column j and at time k+1 is expressed as:(4)Here, the value l i,j represents a weighting of the diffusion value according to its accessibility at the location (i,j).• The source is refreshed constantly by forcing
(5)at the destination point.• Equation (4) is evaluated repeatedly until the entire matrix is filled with values that are greater than zero (except for walls and closed areas):
(6)Figure 1.Layout Map for our office environment.
 of N w destination points
 has to be specified, where each destination point represents a source effusing gas.
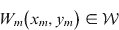





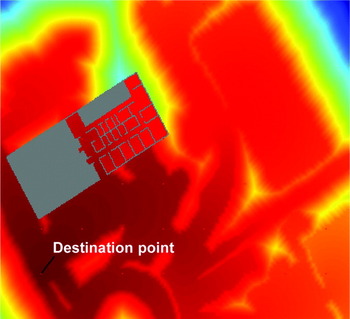
Figure 1 shows the layout map matrix adequate for our office environment. The walls are given in black, not-easily-reachable forest areas are marked with dark grey, and flowerbed areas are marked with light grey. The areas where people mostly walk are given in white. Additionally the stairs area is marked in blue, and red points are destination points that are not located in black or dark grey areas. The diffusion result for one layer is given in
A colour coded plot representing the diffusion matrix for our office environment. The red colour represents higher diffusion matrix values compared to the blue.

Figure 2. One can see from Figure 2 that gas coming from the source (destination point) near the left down corner effuses faster in the white areas (dark red colour) and slower in the dark grey areas.
Many of the indoor environments have more than one floor. In such cases, it is necessary to consider several floor plans for the different floors. The algorithm for calculating the diffusion matrix is extended to 3D taking into account the possible gas flow through stairs and elevators following the approach in (Khider et al., Reference Khider, Kaiser, Robertson and Angermann2009).
2.1.2. Tracing and Angle Calculation
The path that the pedestrian will follow is computed by tracking from the current location towards higher values of the diffusion matrix until the destination point W m is reached (Kammann et al., Reference Kammann, Angermann and Lami2003). In free space, this results in paths that are not straight lines from the current waypoint to the destinations. Therefore, we modified the path finding approach for obtaining more realistic angles in a straight direction to the destination point, as illustrated next.
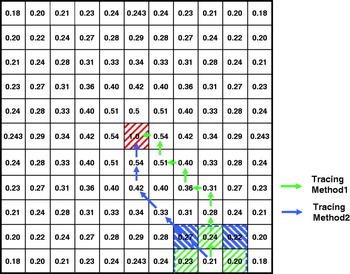
To demonstrate the problem, we simulated a square area with a destination point in the centre of this area. A part of the diffusion matrix is given in Figure 3. For instance, if we consider only the four neighbouring values of a starting point (the top, bottom, left and right values), we will obtain a path that starts and continues vertically or horizontally until the diagonal line leading to the destination in the diffusion matrix is reached, then it follows this diagonal line until the destination point is reached (see Figure 3, Tracing Method 1). On the other hand, if we consider all eight neighbouring values, the path will start diagonally and continues on the horizontal or vertical line until the destination point is reached (see Figure 3, Tracing Method 2). Both methods of tracing result in a path that has a ‘break’ in the path and that is not the straight line to the destination point as it would be expected by following the steepest gradient. Figure 4 shows the full colour coded diffusion matrix and the resulting paths of the square area with the centred destination point for Tracing Methods 1 and 2.
Two methods of path finding following (Kammann et al., Reference Kammann, Angermann and Lami2003).

Diffusion values and Tracing Method 1(a) and 2(b).

Hence, if we compute a histogram of the starting angles of the traces, we will observe peak values of either: 0°, 90°, 180° or 270° angles for the first Tracing Method and 45°, 135°, 225° or 315° angles for the second. Both Tracing Methods are not reasonable for Sequential Bayesian Positioning Estimators since in open areas, pedestrians tend to follow a straight line to the destination. In (Khider et al., Reference Khider, Kaiser, Robertson and Angermann2008) we didn't consider outdoor areas and we considered floor plans with no large free areas, so it was sufficient to take the angle from the first point of the trace to the fifth point of the trace in order to avoid starting angles of only four possible directions. There, we had many walls and accordingly there were no straight lines traces and with the fifth point of the trace we obtained many angles. But in a large open area – for us it was outside our office building – this behaviour of the algorithm resulting in horizontal, vertical or diagonal lines caused problems in our particle filter based positioning estimator since many of the realistic paths were penalized. Therefore, we derived a new approach for computing the angles of the trace that will result in more reasonable directions.
The problem of the standard tracer is that it takes discrete values to compute the trace; only 4 or 8 directions are possible in that grid of points. The following algorithm is developed to correct the angles:
• From the current waypoint we take under consideration the eight neighbouring diffusion values.
• First, we compute the main direction which is defined as the direction to the highest neighbouring value out of the eight neighbouring values.
• From the value of the main direction we compute the differences to its two neighbouring values. The two neighbouring values are selected as follows:
○ If the main direction is upwards (see Figure 5 left side) or downwards – in our case 0° (upwards) or 180° (downwards)-, the neighbouring values are left and right to the main direction.
○ If the main direction is to the right or to the left – in our case 90° (to the right) or 270° (to the left), the neighbouring values are above and below the main direction.
○ If the main direction is on the diagonal (for example see Figure 5 right side), the neighbouring values are the nearest two out of the four top, bottom, left and right values.
• The two differences to the main direction are calculated as follows:
(7)Two examples for the eight neighbouring values with a main direction and its two neighbouring values.
• The corrected angle for that waypoint is defined to be:
(8)where r is expressed as:(9)and α MD is main direction's angle.




With this, the angle of the main direction is corrected with a correcting term between −45° and +45°. More sophisticated angles are thus used in modelling the pedestrian behaviour with this algorithm. Figure 6 shows the diffusion matrix of the same previous square area and the results of the new tracing algorithm.
Diffusion values and result of the new tracing method.

In order to keep the computation effort low during the run of the MM we pre-computed the diffusion matrix Dm for each destination point. Additionally, an angle matrix Am is generated for each destination point where the angles of the direction of the paths from all possible locations to that destination point are stored. Using these angles for modelling the pedestrian's goal oriented movement does not necessarily result in staying exactly on the path since upon the speed of the pedestrian towards the destination; he/she will probably leave the path. At the next step a new angle is taken from the new position toward the destination and accordingly the deviation from the diffusion path is corrected again. For our MM this deviation is negligible, but still desired, since in reality the true destination points are not known and may change, and the direct path may also not be the one followed in reality (for instance to avoid bumping into someone else, or due to random or intentional deviations).
Since the destination point for the tracked pedestrian is not known, the destination points are chosen randomly (using a uniform distribution). The destination point is kept until the destination is reached, changed or the non-goal oriented movement model (detailed in Section 2.2) is used. The destination is changed with a pre-defined probability to take into account the individual variances of the user, such as changing his/her destination. The speed of the pedestrian is modelled using the SBMM.
2.2. Three Dimensional Stochastic Behavioural Movement Model (3D-SBMM)
A 3D-SBMM is designed to represent non-goal-oriented movement of the pedestrian. It is a random walk model but with a mechanism that models the relationships between the situation of the pedestrian and the movement change. Other random walk models might still be sufficient to represent the non-goal-oriented movement (Bar-Shalom, Reference Bar-Shalom, Rong Li and Kirubarajan2001; Hyytiä et al., Reference Hyytiä, Lassila and Virtamo2006; Banos and Charpentier, Reference Banos and Charpentier2007; Sharma and Vishwamittar, Reference Sharma and Vishwamittar2005; Rhee, Reference Rhee2008).
Human movement at the kinematical level is parameterized by physical parameters such as speed and direction of motion. However, speed and direction are affected by several ‘human’ states such as pursued activity, emotions, degree of disorientation, age, obstacles and weather. Some of these parameters affect the movement more than others. Building layouts are obviously among the main parameters that affect the movement of the pedestrian. For instance, the pedestrian cannot penetrate a wall under any normal circumstances. In the same way as we included the state space to include an unknown ‘destination’ location in the target driven model we include these ‘human’ states also. They are usually unknown (unless provided by an outside source) and only serve to allow particles to follow different configurations of the random walk. This flexibility allows particles to adapt to the individual motion of the pedestrian. By modelling these states by a Markov process we account for natural variability between these states. The idea of using Markov Chains for describing human behaviours can also be found in (Pentland and Liu, Reference Pentland and Liu1999; Zhao and Nevatia, Reference Zhao and Nevatia2002; Adam and Amershi, Reference Adam and Amershi2004).
Eleven parameters that affect the human movement are considered during this work. These parameters are categorized into two groups, where the first category includes parameters that can be determined accurately and the second category includes parameters that vary according to human behaviour. These parameters can be extended or modified according to the scenario and the application. Lookup tables, predefined user specific parameter and system time are used to specify the new states of the first category parameters such as time of day, weekday, age, obstacles, ground steepness and weather. Some of these parameters such as weather, obstacles and steepness depend on the pedestrian's current position. First order Markov processes are used to specify the new states of the second category parameters such as activity, emotions, disorientation, activeness and arousal. Statistical data, as well as common-sense assumptions, are used to probabilistically relate the state of our eleven parameters to the resulting change in speed and direction (Bekey, Reference Bekey1995; Green and Guan, Reference Green and Guan2004). Combined with the knowledge of the old speed and direction, the pedestrian position can be propagated. Details of this model can be found in (Khider et al., Reference Khider, Kaiser, Robertson and Angermann2008, Reference Khider, Kaiser, Robertson and Angermann2009; Wendlandt et al., Reference Wendlandt, Khider, Angermann and Robertson2006). To incorporate the a priori knowledge of floor plans in the SBMM a modified ‘wall bouncing’ approach is followed. The algorithm checks at every time step if the suggested movement will result in crossing any of the walls. If a wall cross results, then a movement that is parallel to the crossed wall in the same general direction of movement will be followed. If a wall is still crossed after this parallel movement, then this will mean that the pedestrian is at a corner and a movement that is perpendicular to the first crossed wall will be followed.
In this way, we have drawn a new value of the state x k from Prob {x k|x k−1} given the old state. The state x k comprises all above mentioned eleven parameters that are drawn according to their Markov processes or known a priori (e.g., age, weather), as well as the physical motion states (heading, speed, position).
2.3. Combined MM
Whereas the 3D-SBMM is capable of representing movement well in situations without external constraints, it is not suited for situations in which walls or roads have a strong influence on the movement. This will lead to situations where the pedestrian fails to enter/exit rooms. However, this will not happen with the 3D-DMM which additionally has the advantage of incorporating goal-oriented movement. But a disadvantage of the 3D-DMM is that it does not model local random motion well, such as when a person is not walking towards some target. Additionally, pedestrians do not always follow the shortest path.
Our approach was to combine both models intelligently, trying to obtain the advantages of both models and get rid of as many of the disadvantages as possible. They are combined via an extended Markov model. The combined model switches between motion that is more goal-oriented (3D-DMM) or stochastic (3D-SBMM) randomly with a small transition probability, where each model will be successively used for several time steps before switching to the other one (Khider et al., Reference Khider, Kaiser, Robertson and Angermann2009).
2.4. The 3D-MM as a Weighting Function in Particle Filters
Most of the standard particle filters use an importance density that is based on the prior and use likelihoods for weighting the particles. However, the Likelihood Particle Filter (LPF) does it vice versa. Actually, in the case that the likelihood is much tighter than the prior, the posterior will look more similar to the likelihood than to the prior. And since the importance density represents an approximation to the posterior; using a better approximation based on the likelihood, rather than the prior, is expected to improve performance (Arulampalam et al., Reference Arulampalam, Maskell, Gordon and Clapp2002). Accordingly, in the LPF the movement model should be able to assign probabilities for the particles movement proposed by the sensors.
In the case of applying the 3D-DMM, a Gaussian function is drawn around the proposed direction by the 3D-DMM at every time step and used to give a weight for the particle. Modelling the variance of the Gaussian function is based on the fact that it is more probable that a pedestrian will follow a specific path as more walls are in his/her vicinity. Accordingly, if a particle has many walls around it, then it is weighted with narrow direction likelihood around the direction of its destination. On the other hand, if the particle has no walls around it, then it is weighted with wider direction likelihood around the direction of its destination. This rewards higher particles that are in areas with more wall constraints if they make a consistent movement with these constraints.
In the case of applying the 3D-SBMM, the direction probabilistic representation is used to apply weights to the particles. The particles’ proposed direction by the sensor is used as an input for the direction probabilistic representation and a probability (weight) for the movement is assigned. Speed probabilistic representations can be used similarly.
In LPF implementations, walls can be used to apply additional weight to the one assigned by the MMs. A very low weight will be assigned to any particle that has a proposed sensor movement crossing a wall.
3. CAN MAPS AND FLOOR PLANS REPLACE A REALISTIC MM IN A SEQUENTIAL BAYESIAN POSITIONING ESTIMATOR?
The work of several authors in the navigation community has suggested that the knowledge of maps and floor plans might be enough to probabilistically weight the particles in a Sequential Bayesian Positioning Estimator based on LPFs (Beauregard et al., Reference Beauregard, Widyawan and Klepal2008; Woodman and Harle, Reference Woodman and Harle2008; Krach and Robertson, Reference Krach and Robertson2008). In such implementations, walls hinder the movement and floor plans determine the most probable paths. In such cases, the mathematical representation of the importance density function can be written as:

where r ki is the floor plan restriction at time k with a value of zero if a particle crosses a wall and one otherwise, and U ki is a uniformly distributed density function over the state space. Accordingly, the weight for the LPF at time k and for particle i can be written as: w ki=r ki.
Such implementation of the pedestrian MM will work only in special cases and will fail in many others. For example it might fail when the posterior is following a multimodal distribution which can commonly occur in multisensor fusion approaches with estimators such as particle filters. Reality has shown that a single particle entering a large open side of a floor plan for a pedestrian that walked into a side with smaller rooms will result in multimodality. The reason is that this particle will always get high weights and re-sampling will eventually bring the whole cloud to the wrong side of the floor plan. The same behaviour will be observed if a single particle remains outdoors for a pedestrian that walked into a building. Multimodality might also be observed when the particle cloud is split into two sub-clouds due to a wall – so they enter two different rooms with different sizes.
Noisy, erroneous and heterogeneous sensors, measurements are the main reason for such multimodal posterior distributions. The use of an unbalanced weighting function in a Sequential Bayesian Positioning System might also result in multimodality. Researchers in the navigation community tend to solve the multimodality problem in PF based positioning estimators in two ways:
• Cover the whole area with enough particles and as time elapses, the particles converge around the correct user position. Particles in the wrong position will get eliminated since they will cross walls (Krach and Robertson, Reference Krach and Robertson2008). However, this assumes that the cloud is spread only inside the building of interest and this building has small rooms, which might not be always the case.
• Assuming that at some point a more accurate absolute position sensor measurement (e.g., GNSS, wireless localization) will arrive and result in higher weighting for the correct part of the posterior distribution. However, receiving an accurate position measurement, if it happens, might already be late. The underlying problem with the aforementioned approaches is the fact that they do not correctly model human motion in buildings.
To illustrate the problem and show how the realistic movement model can prevent this failure, let us consider an indoor/outdoor scenario where at the beginning, particles were distributed equally inside and outside due to the unknown starting position of the pedestrian. Additionally, let us assume that the area outside the building is an open area where the pedestrian can walk freely.
First, we investigate the case of using only floor plans and maps for weighting; particles that are inside the building will get good weights only if they do not cross walls. Particles outside the building will always get good weights, as they do not cross walls. For the case where the tracked pedestrian is inside the building and walking in corridors, a certain proportion of the inside particles will be lost since many of them cross walls (i.e., get very low weights). Particles outside always survive with good weights. As time elapses, re-sampling will result in increasing the number of particles outside the building and decreasing the number of particles inside the building. This will eventually result in eliminating all the particles inside the building and a divergence of the estimator.
Second, we examine the case of using our new pedestrian MM that incorporates the knowledge of floor plans to weight the particles. Such model rewards particles that are in areas with more wall constraints if they make a consistent movement with these constraints. Particles inside the building will obtain high weights if they do not cross walls and follow the MM. Particles that are outside the building will obtain high weights if they follow the MM. For the case where the pedestrian is inside the building, we are still losing the same share due to walls, but we are rewarding the surviving particles if they are consistent with the limited movement possible inside constrained buildings. Particles outside the building are not so strongly rewarded, but none are killed by hitting walls. As time elapses, the new MM will compensate the loss due to walls and re-sampling will lead to the elimination of the particles outdoors.
Illustration of both scenarios with real time data is shown in Section 5.
4. EVALUATION PLATFORM
The developed model was tested and evaluated using an already available distributed simulation and demonstration indoor/outdoor environment for positioning. The environment is based on Sequential Bayesian Estimation techniques and allows plugging-in different types of sensors, Bayesian filters and transition models.
Several ground truth points were carefully measured to the sub-centimetre accuracy using a Total Station. The Total Station employs optical distance and angular measurements and uses differential GPS for initial positioning. The Leica Smart Station (TPS 1200) was used for this purpose. The Sequential Bayesian Positioning Estimator that was used to evaluate the performance of our MM was based on the following:
1. A particle filter (PF) fusion engine.
2. A 3D map and floor plans enhanced MM.
3. The following sensors: commercial GPS, electronic compass and a foot-mounted Inertial Measurement Unit (IMU) with Zero Velocity Updates (ZUPTs) (Krach and Robertson, Reference Krach and Robertson2008).
The test user was requested to walk through a predefined specific path that passed through several of our ground truth points and through many of the rooms in our office building. Whenever the test user passed across one of the ground truth points, the estimated position at that point was compared to the true position. Errors between the true and estimated pedestrian positions were recorded and visualized with and without the use of our developed MM. Some results will be given and discussed next.
5. PERFORMANCE ANALYSIS
Figure 7 shows the average position error of our Particle Filter (PF) based estimator for a shoe mounted IMU with an assumed odometry noise of 0·065 m and 1°. The red curve represents the average position error of the estimator when our 3D-MM is used, while the black curve shows the error when walls restrictions are used as a replacement for the MM. The average position error for the no MM case is 1·50 metres, while the average position error for the MM case is 1·62 metres.
Average Position Error for a shoe mounted IMU odometry noise of 0·065 m and 1·0°. Time stamps at the ground truth points are marked with circles.

One might be surprised at this implication that the supposedly more accurate MM worsened the estimator behaviour. To interpret this result we have to note the high degree of belief that we placed in the shoe odometry (0·065 m & 1·0°). Actually when the odometry is very accurate, then the randomness that is added by incorporating motion models in general worsens the accuracy. This result bring us back to the basic question: “In a Bayesian approach, when one has a very accurate measurement, is a transition model needed?” Of course the answer is “No”, but in reality, perfect measurements are never achievable. Accordingly, in the following evaluation, the degree of belief in the shoe odometry is decreased to 0·2 metres and 2·0° in order to account for possible degradation of the shoe mounted IMU performance. The average position error for this scenario is shown in Figure 8. The average position error for the no MM case is 1·74 metres, while the average position error for the MM case is 1·41 metres.
Average Position Error for a shoe mounted IMU odometry noise of 0·2 m and 2·0°. Time stamps at the ground truth points are marked with circles.

Here we can see that the use of MM improved the average performance of the estimator. However, the improvement happened between the first and the eighth ground truth points and, after that, both estimators show the same average performance. The explanation of this result is that between the first and the eighth ground truth points, the test user was walking from outdoors to wide corridors indoors, where our 3D-MM restricted the possible positions and directions to be explored by the particles to the most reasonable ones; that improved the estimator performance. After the eighth ground truth point, the test user started walking in a narrow corridor that is 1·7 metres in width. The corridor walls bounded the particle cloud and kept the average position error below 1·7 metres for both estimators. Hence, the average performance of both estimators in this region is equal.
Although the last three ground truth points are again in a wide corridor and then outside the building, the performance of both estimators remains equal. The 3D-MM enhanced estimator does not perform better than the other estimator at these points because the destination points are distributed equally outside the building and that makes the DMM gain not visible. Additionally the pedestrian was not doing a random walk and that makes the gain of the SBMM also not visible. But since the particle cloud before reaching these three points is bounded by the narrow corridor in both estimators, a good level of accuracy is kept when entering the wider corridor. However, if we perform a longer walk outdoors, the benefit of incorporating outdoor maps in the DMM will be more visible, and the MM enhanced estimator will also overtake the other estimator after leaving the building.
On the other hand, using floor plans as a replacement for the MM might totally fail in some cases as explained in Section 3. To illustrate both scenarios explained in Section 3 on real data, particles distribution plots of the PF based estimator were taken for the same data set that is used to generate Figure 7 and 8. However, in this case we added a second cloud of particles a few metres behind the correct cloud to provoke the inside-outside particles scenario discussed in Section 3. The same total number of particles is kept for fair performance comparison. In this case, when the pedestrian enters the building, the correct group of particles will follow him/her indoors while the added group will remain outside.
In each of the particles distribution plots the following is shown:
• The floor plan of our building environment.
• Particles are shown using a colour mapped cloud of dots where darker dots are particles with higher weights. The straight lines connected to the dots show the direction of particles.
• The red dots marked as GTRPs represent the ground truth points.
• The blue dot with a line connected to it represents the Minimum Mean Square Error (MMSE) estimated position and direction.
• The green dot shows the last received GPS and the arrow connected to it represents the compass measured direction.
The particles, distribution plots of the scenario where walls are used as a replacement for the realistic MM are shown in Figure 9. We can see from the figure that the lack of a realistic MM resulted in the wrong group of particles surviving. On the other hand, the particles, distribution plots of the scenario where the floor plans enhanced MM is used are shown in Figure 10. The realistic MM compensates the loss of particles due to walls punishment and results in the survival of the correct particles group.
Particles distribution plots of a two clouds scenario of our PF based estimator at different time instances when walls are used as a replacement for the realistic MM. The correct cloud is the one closer to the building. As time elapses, the correct cloud is punished more and more with walls while the wrong cloud remains unpunished and dominates at the end due to re-sampling.

Particles distribution plots of a two clouds scenario of our PF based estimator at different time instances when the realistic MM is used. The correct cloud is the one closer to the building. As time elapses, the realistic MM is compensating the wall punishment and results in the survival of the correct particle cloud.

6. CONCLUSION AND OUTLOOK
We have presented a pedestrian motion model that accounts for targeted and untargeted motion in 3D environments such as multi-floor buildings. Our model follows a combination between a diffusion process model to represent paths that humans typically take to reach a destination and a random walk model that incorporates the effect of the pedestrian situation on his movement. When our motion model is applied in a sequential non-linear (Bayesian) localization scheme such as particle filtering, the model is typically used in the ‘importance sampling step’ where we draw from a suitable proposal density (our model). However as in the Likelihood Particle Filter, the model is used in the ‘weighting step’, where we give appropriate weights to particles that are moved according to the measurements. The model could also be used to calculate shortest paths or to estimate pedestrian densities in buildings planning.
We have demonstrated that a particle filter that uses floor plans as a replacement for the MM can fail if the particle distribution is multimodal and the wrong group of particles is in areas with few limiting walls in their vicinity. This is due to the continuous loss of particles belonging to the correct group (mode) as they cross walls. Using the proposed motion model for weighting in an LPF alleviates this problem. Hence, floor plans can improve movement models but not replace them. Additionally, it has been shown that weighting with our developed floor plans enhanced motion model is better than using only floor plans in situations where the sensor measurements are not very accurate.
Future work will be in quantifying the added value of incorporating the knowledge of outdoor maps in the DMM on the overall positioning performance. Longer outdoor walks where outdoor maps will influence the pedestrian movement are needed in this case. Additionally, validating and improving the model through observing the true human motion (recorded from many test subjects over longer time) and comparing it with what our model would propose in the same conditions is left for future publications.