


1. Introduction
The grounding line constitutes a crucial zone in the coupled ice-sheet/ice-shelf system. In Antarctica, it separates over 60% of the perimeter of the grounded ice sheet from an adjacent floating ice shelf, across which virtually all of the ice transport towards the ocean takes place (Reference Drewry, Jordan. and Jankowski.Drewry and others, 1982). From an ice-dynamical point of view, across the grounding line a fundamental shift takes place in the flow regime. Conditions change from an ice-sheet situation, in which the flow is dominated by vertical shear, most of it near the base, to an ice-shelf situation, in which the flow is dominated by lateral shearing and longitudinal stretching, and in which vertical gradients are negligible. This fundamental difference between the two flow regimes suggests the existence of a transition zone, where all stress components are potentially important and none of the usual simplifications in the force balance can be made. It also raises the question of the width of such a transition zone.
When grounding zones are discussed, a distinction is usually made on the basis of the flow speed, the importance of basal sliding or the magnitude of basal traction (Reference Herterich, Van der Veen and Oerlemans.Herterich, 1987; Reference HindmarshHindmarsh, 1993). On the one hand, there are ice streams and outlet glaciers, which discharge most of the grounded ice but form only 13% of the Antarctic coastline (Reference Drewry, Jordan. and Jankowski.Drewry and others, 1982). These fast-flowing features have been studied most intensively, with the establishment in the 1980s of large-scale strain networks to address questions of force balance and spatial mobility of the grounding line (Reference Bindschadler, MacAyeal., Stephenson., Van der Veen and Oerlemans.Bindschadler and others, 1987; Reference Doake, Frolich., Mantripp., Smith. and Vaughan.Doake and others, 1987; Reference Thomas, Stephenson., Bindschadler., Shabtaie. and Bentley.Thomas and others, 1988). The distinction between ice streams and outlet glaciers is not always clear in practice (Reference BentleyBentley, 1987), but both are characterized by low surface slopes some distance inland and a deflection point in their surface profile coastward of which the profile is concave up rather than convex up. This is interpreted in terms of a decreasing driving stress towards the coast and low basal traction, tending to a dynamical state resembling ice shelves more than ice sheets, hence the notion of “shelfy streams” (Reference Muszynski and Birchfield.Muszynski and Birchfield, 1987; Reference MacAyealMacAyeal, 1989; Reference HindmarshHindmarsh, 1993). Studies indicate that the transition zone in these ice streams is greatly widened and that the ice-sheet/ice-shelf boundary may be effectively shifted a few hundred km inland (Reference McIntyreMcIntyre, 1985; Reference Van der VeenVan der Veen, 1985; Reference Herterich, Van der Veen and Oerlemans.Herterich, 1987; Reference PattynPattyn, 1996).
Grounding zones not characterized by ice streaming have received far less attention. Nevertheless, it is this type of grounding zone that forms by far the greater part of the Antarctic coastline, and may ultimately control its overall stability (Reference HindmarshHindmarsh, 1993). This paper investigates the dynamical regime of such a slower-moving grounding zone, where accelerated sheet flow rather than ice streaming is believed to dominate. The emphasis is on inferring the force-balance and velocity components with depth. For this purpose, we describe the results of a detailed study of ice dynamics we carried out in the grounding area south of Ekstromisen, East Antarctica, an area without visible characteristics of ice streaming. Most of the fieldwork, conducted during the 1993–94 and 1994–95 field seasons, consisted of surface-based measurements of topography, ice thickness, surface velocity, accumulation rate and ice deformation, with the aim of deriving the stress and strain-rate distribution with depth in a plane perpendicular to the grounding line. Of particular interest was the determination of the width of the transition region between grounded and floating ice flow. The numerical model employed for these ice-dynamical calculations was developed along the lines of Reference Van der Veen and Whillans.Van der Veen and Whillans (1989a).
2. Field Data
2.1. The ekström grounding line
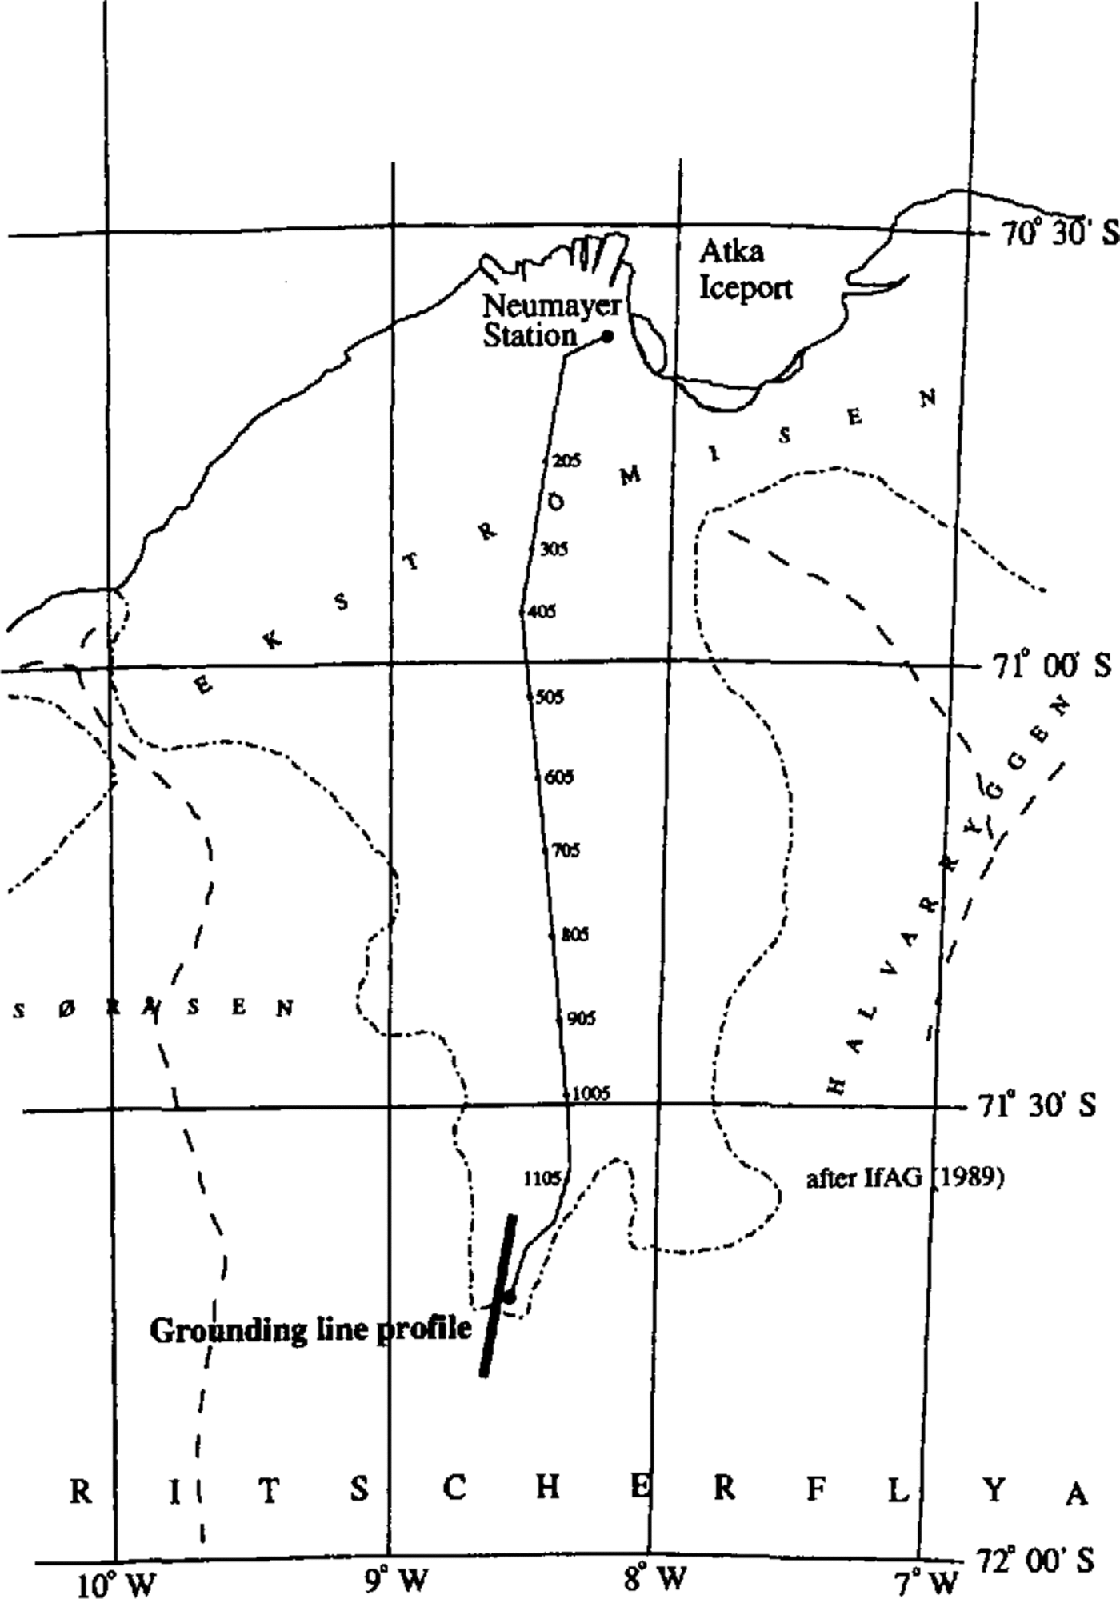
The area of investigation is situated about 120 km south of the German base, Neumayer, within the main feeding area of Ekstrbmiscn, a small ice shelf (8700 km2) in the Atlantic sector of the East Antarctic ice sheet (6–10° W; Fig. 1). At the outset of the field program, only one airborne radio-echo profile existed close to the investigated area (Reference Thyssen and Grosfeld.Thyssen and Grosfeld, 1988), as well as some accumulation-rate and surface-elevation measurements obtained during several overland crossings in the previous 10years (Reference FüttererFütterer, 1987, Reference Fütterer1988; Reference Miller and Oerter.Miller and Oerter, 1990). Together with a visible break of the surface slope at times of low-angle solar illumination, this allowed us to locate the approximate position of the grounding line during a first reconnaissance of the terrain.
Map of Ekströmisen displaying the traverse route and the location of the stake network in the southernmost part of the ice shelf (If AG, 1989).
2.2 Strain network
A stake network 20 km long and 1 km wide was set up perpendicular to the assumed position of the grounding line. It consisted of three parallel lines in the direction of the flow, with a bearing of 11° and a spacing of 500 m between individual stakes. The grounding line was located roughly half-way along the stake line. The relative stake positions were determined by common terrestrial geodetic methods. Horizontal and vertical angles were measured with a theodolite. Distances were determined with an electronic distance meter. Repeated differential global positioning system (GPS) measurements of four stakes along the central line provided the ellipsoidal elevation and the absolute ice velocity at the surface. The GPS reference station was situated at Neumayer station, resulting in a rather long baseline, but the accuracy obtained was generally acceptable.
From each stake along the central line, the angles and distances of II surrounding stakes were measured in a systematic way. This led to a four-fold overdetermination of all positions, and a subsequent minimization of errors. All angles and distances were measured twice within a time-span of 13–34 days during the first season. The GPS measurements were repeated the following year, and provided an additional control on the deformation rates obtained from the terrestrial measurements. We estimate the absolute accuracy of the measurements to be better than 2 cm horizontally, but only 20 cm vertically because of errors introduced by refraction effects. Comparing these values with the stake spacing and the time-span between subsequent measurements yields a relative error on the horizontal strain rates of generally better than 5%, which is considered sufficiently-accurate for the purpose of the model study further below.
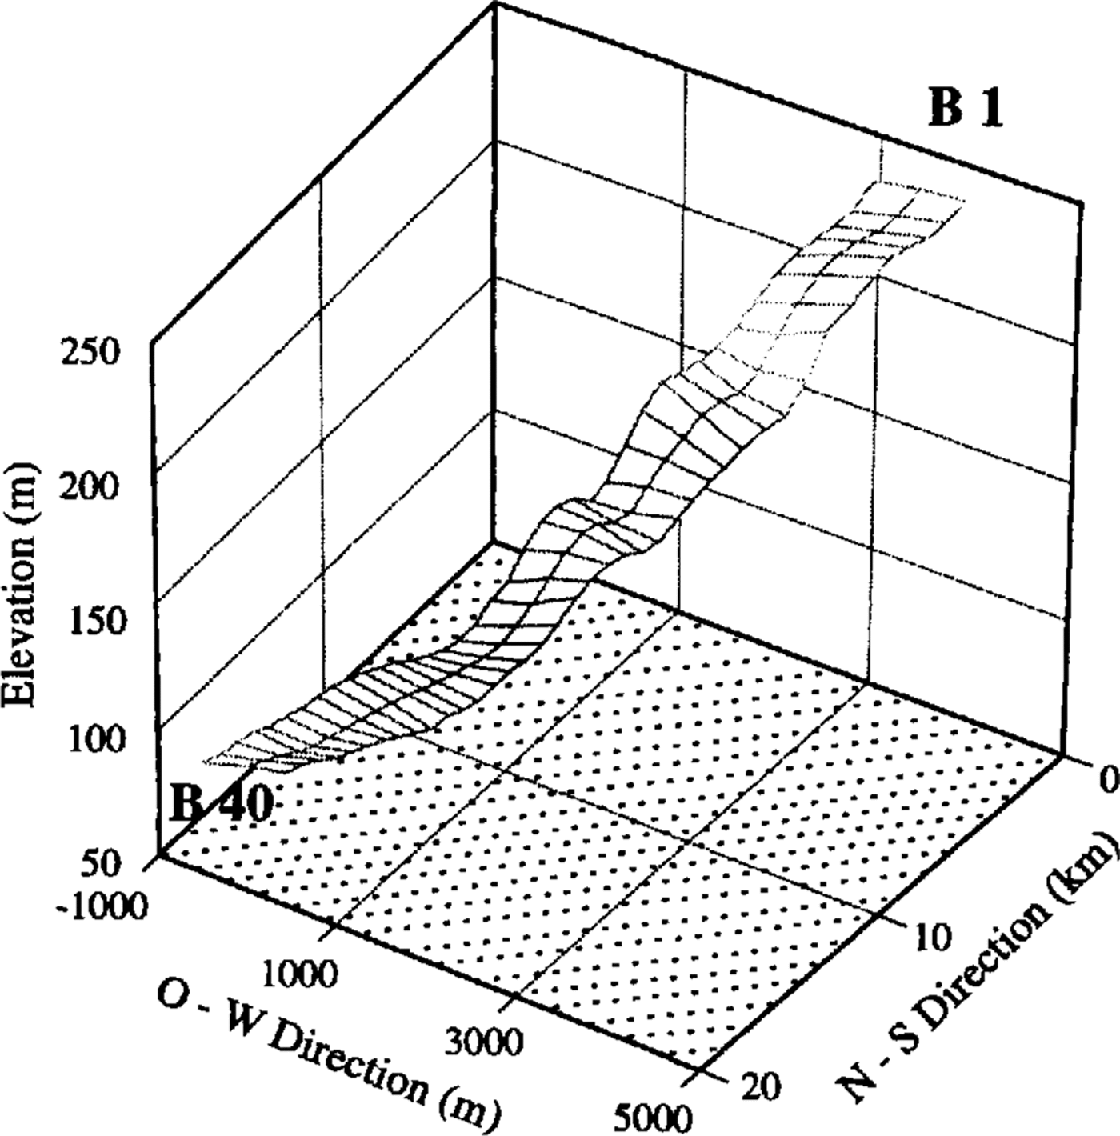
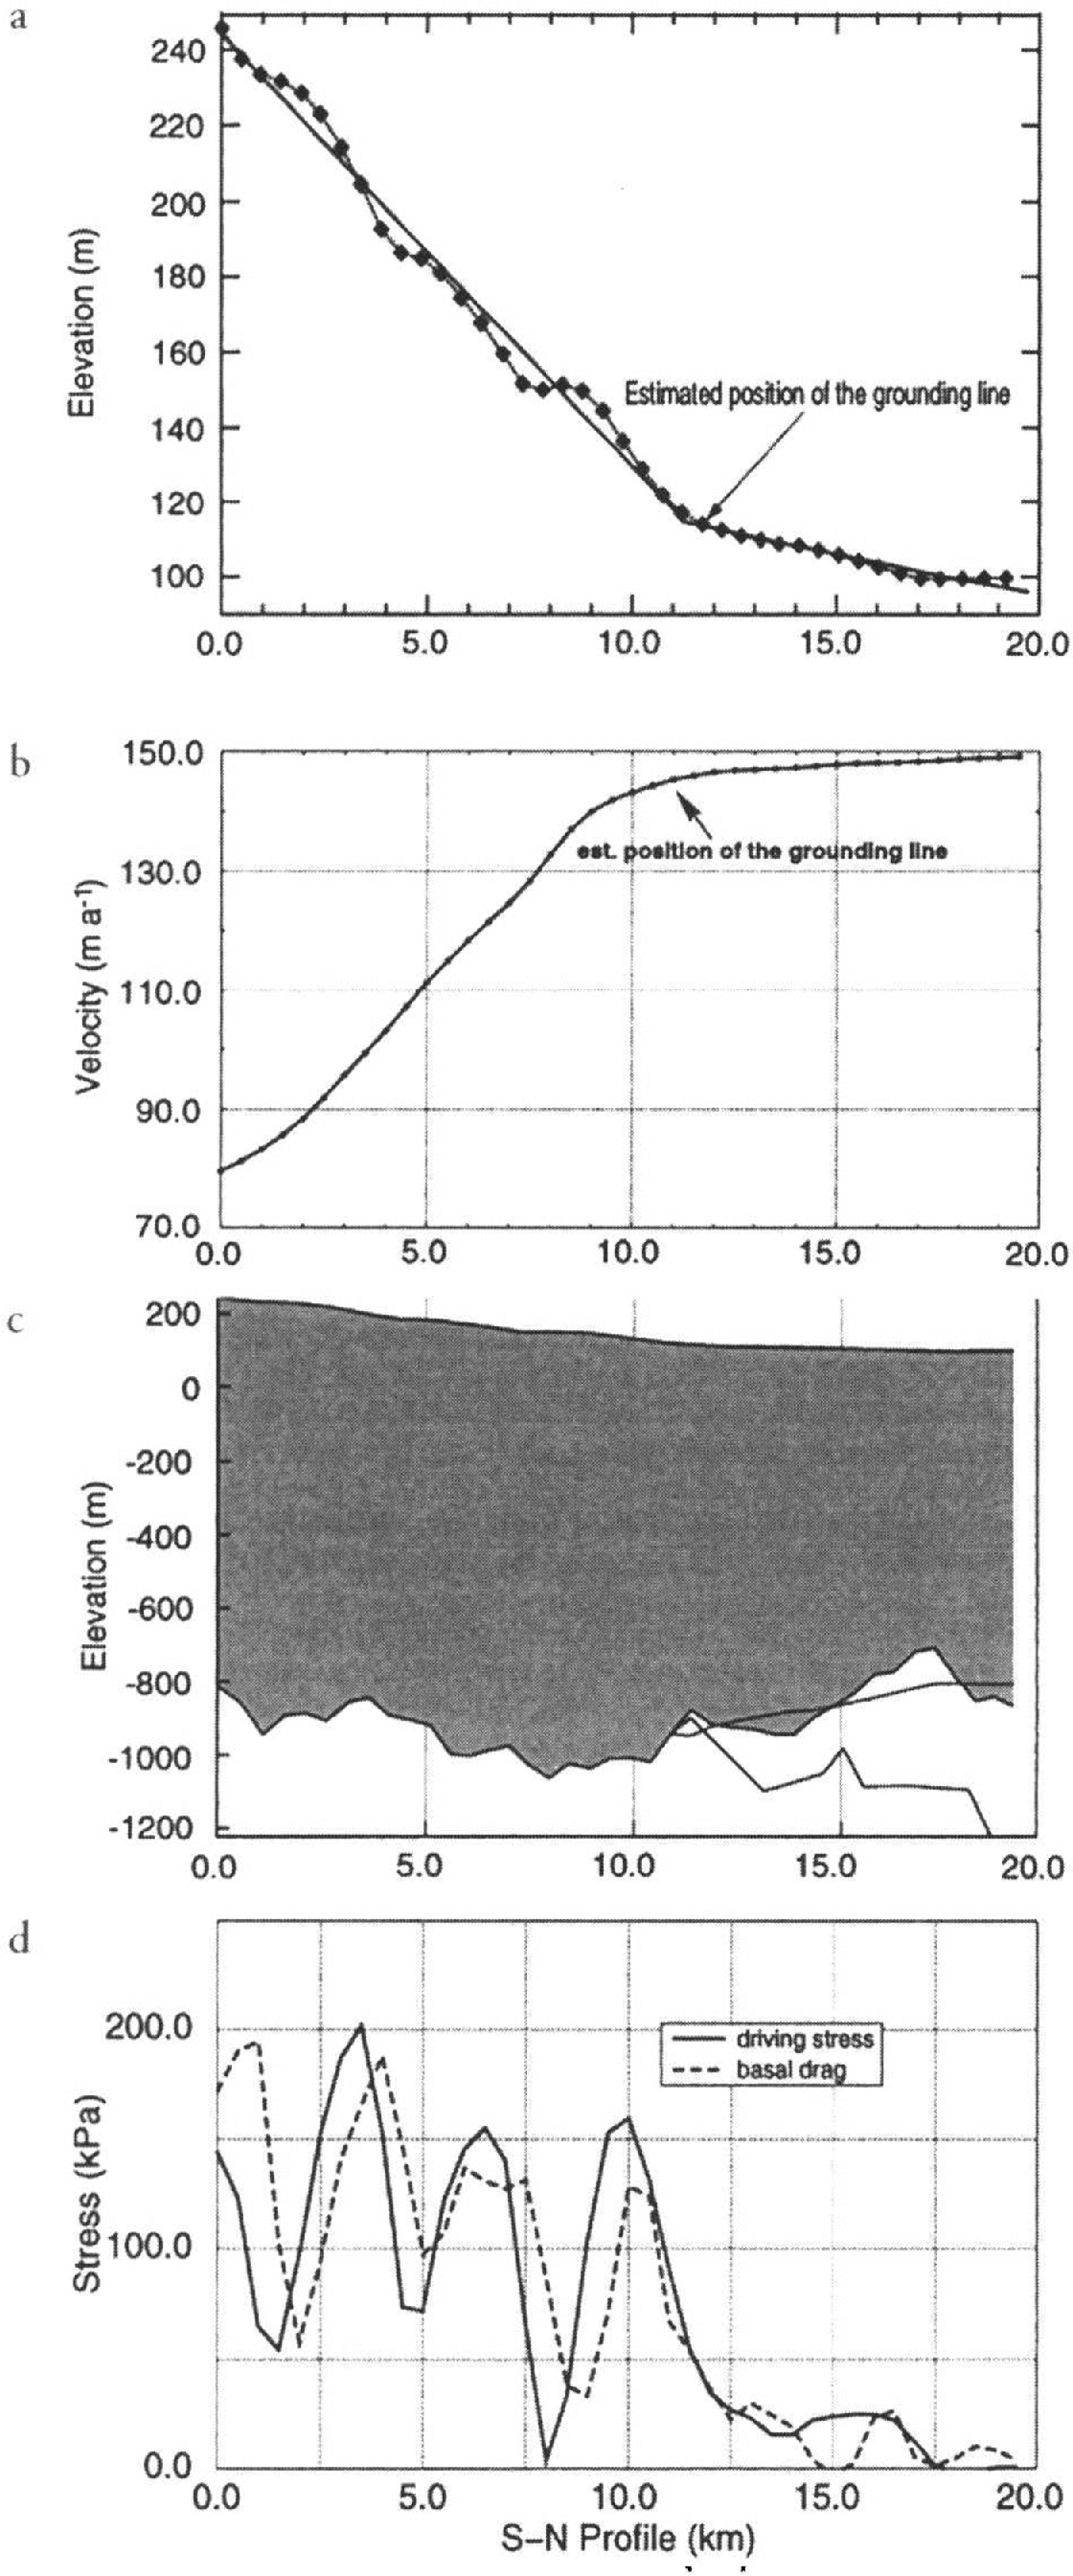
Figure 2 displays a three-dimensional projection of the stake network constructed from the topographic measurements. On the grounded part the surface is dominated by undulations with characteristic wavelengths of about 4 km in the flow direction. In the perpendicular direction the wavelength depends very much on the surrounding topography, which channels the flow in this area. A profile along the central stake line is shown in Figure 3a, indicating even more clearly the sinusoidal shape of the surface undulations, which gradually disappear in the floating part. The mean surface slope is about 1.2% in the grounded ice (km 0–12) and 0.3% in the floating part (km 12–20). The gradient change at the grounding line is relatively abrupt and indicates a sharp transition between the grounded and floating parts.
Terrain model of the surface topography in the area of investigation resulting from the geodetic survey. The cross-points of the lines represent the single stake positions. The numbering follows the flow direction from 1 to 40. The different profiles are additionally denoted A–C in the east–west direction.
(a) Surface elevation along the central line if the stake network resulting from the geodetic survey. The solid line shows the mean slope for grounded ice and ice shelf. Note the surface undulations in the grounded part, which have a characteristic wavelength of approximately 4 km. (b) Surface ice velocity along the central line if the profile. These velocities were mainly derived from the strain-rate measurements, and subsequently fixed to repeated GPS measurements during seasons 1993–94 and 1994–95. (c) Model of the ice-sheet geometry across the grounding line derived from seismic and geodetic measurements. The dashed line represents the ice subsurface, calculated from the surface elevation and the assumption of hydrostatic equilibrium, (d) Calculated driving stress and basal drag along the profile. The vertical axis shows the stress in k Pa. The horizontal axis displays the distance from the southernmost stake if the profile in a northerly direction in meters (azimuth: 11.7°).
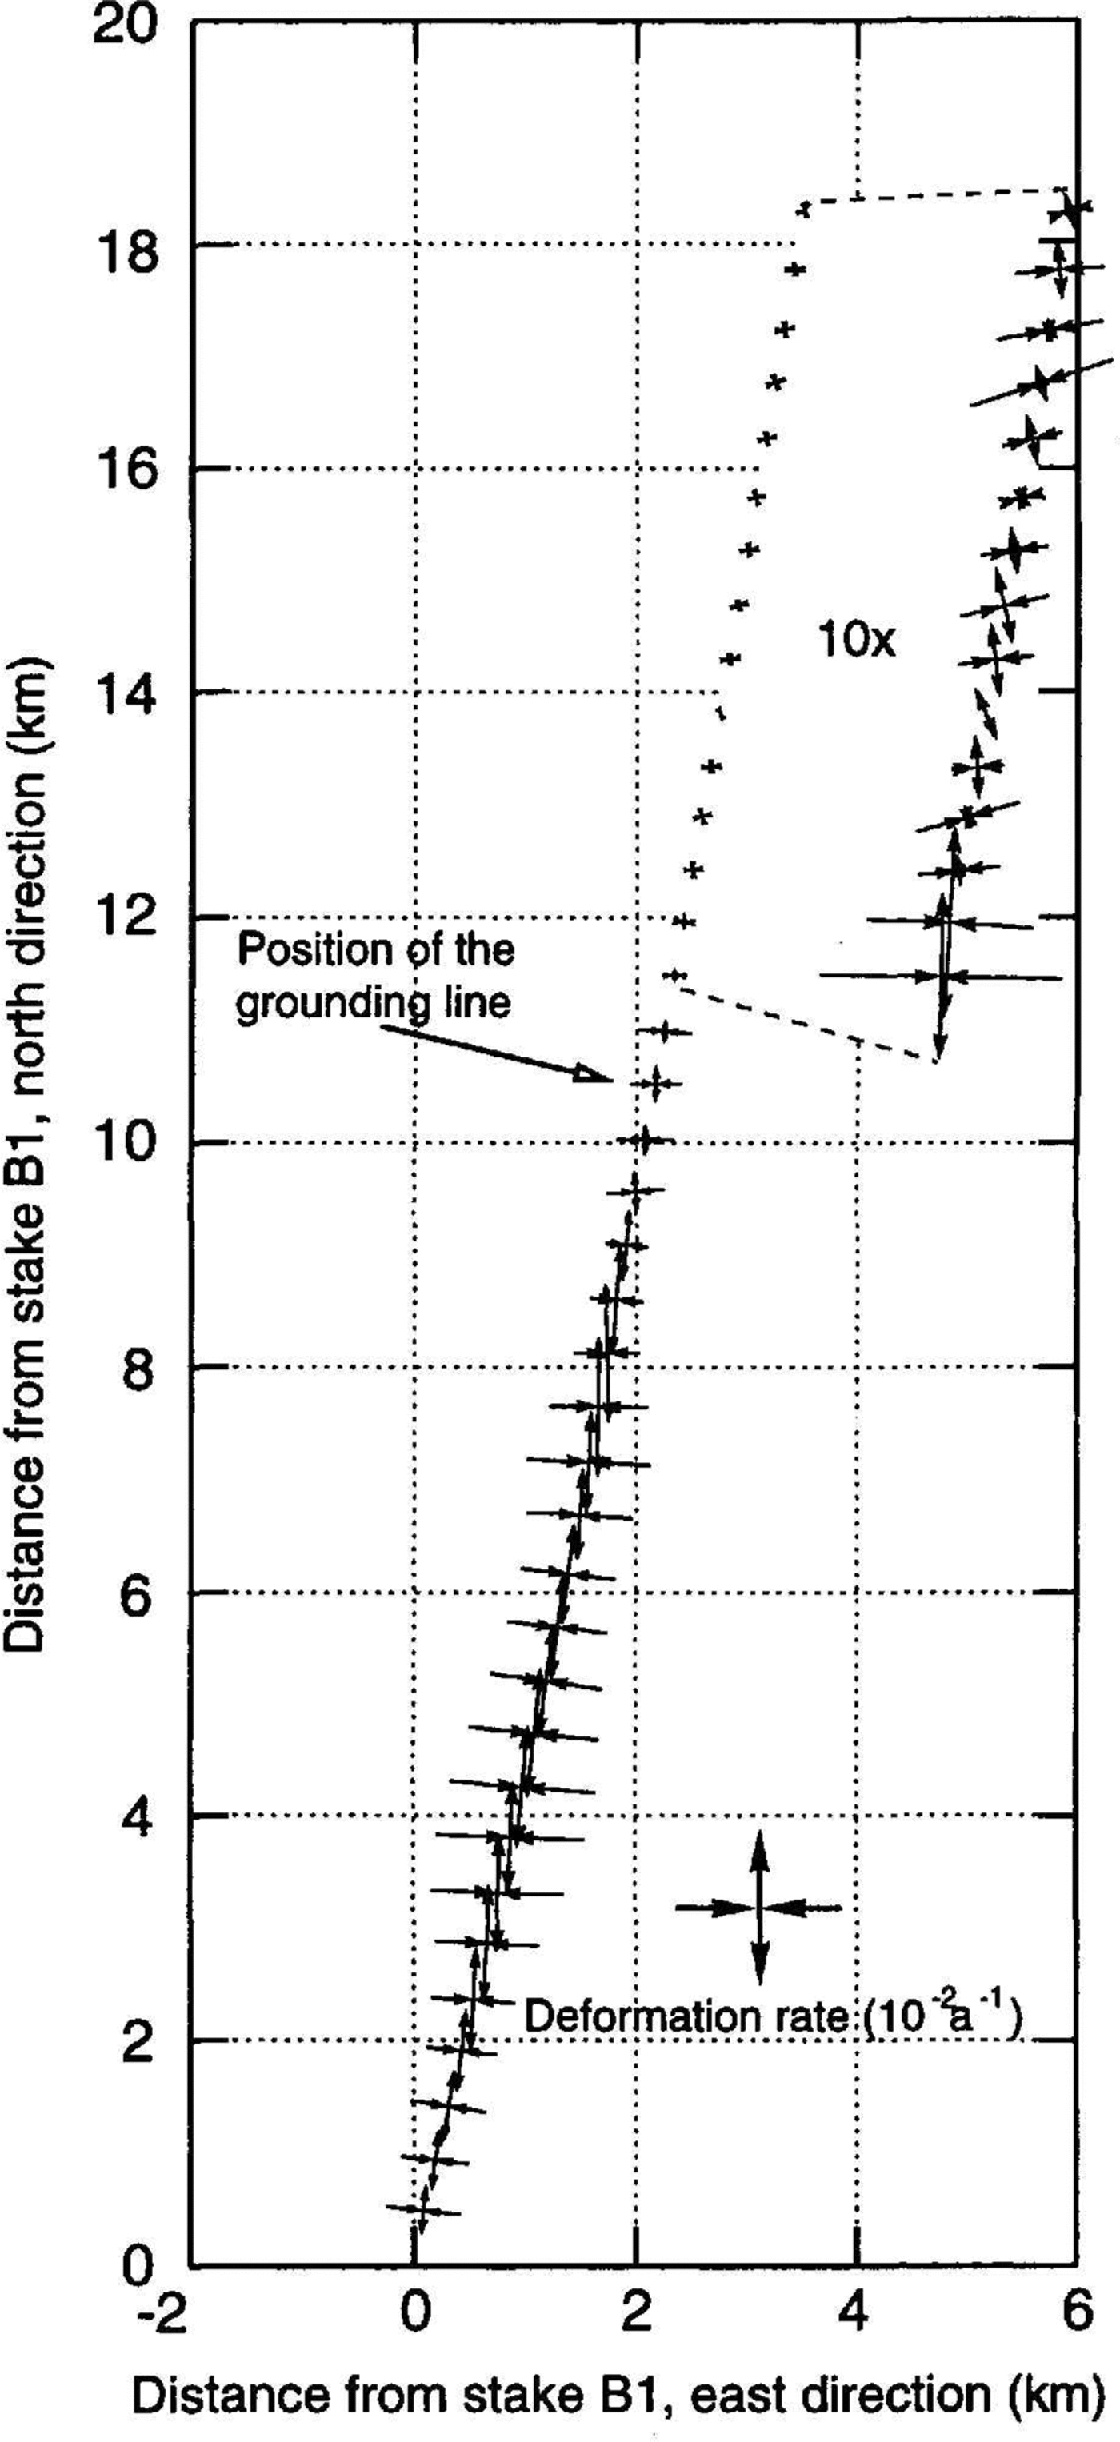
The general deformation pattern shows extension along the flow direction (roughly north–south), and compression of the same magnitude in the direction perpendicular to the flow (Fig. 4). The mean direction of the main deformation axis (azimuth 11.0°) is virtually parallel to the azimuth of the stake profile (11.7°). There is also a clear pattern in the magnitudes of the strain rates. They increase on the grounded ice sheet towards the grounding line from typical values of around 103 a−1 to a maximum of almost 10−2 a−1 some 6 km south of the grounding line. further downstream, deformation rates decrease and become very low on the ice shelf (<10−4 a1). The compressive conditions perpendicular to the flow direction imply convergent flow in the grounded part of the survey area. The ice moving downslope is apparently channeled in a topographic trough before flowing into the ice shelf.
Deformation pattern along the profile at the individual stake positions. Compressing and extending flow is indicated by the direction of the arrows. The arrow length is proportional to the strain rate. On the ice shelf a magnifying factor of 10 was used to represent the much smaller strain rates.
Combining the absolute GPS velocity measurements with the measured strain rates allows the reconstruction of surface velocities along the profile (Fig. 3b). These are in the range 80–150 m a−1 and exhibit a sharp rise in the grounded ice sheet, and then level off when approaching the grounding line. In the ice shelf, accelerations are very small, as indicated by the surface strain rate.
2.3 Ice thickness
Seismic depth soundings were carried out along the entire center line for every 500 m. Using a 24-channel seismograph with a 10 m geophone spacing, narrow angle reflections were recorded at each stake in a direction parallel to the flow. Explosive charges of 1.2 kg (Nitropenta) were used as the seismic source. These were emplaced in 10 m deep boreholes obtained by a hot-water drill. The offset between shot and first geophone was typically around 125 m. In addition to the standard 500 m spacing between separate recordings along the whole profile, a continuous two-fold profile with shot offsets of 125 m was recorded across the grounding zone over a distance of 2.5 km. In total, 65 depth soundings were performed along the profile.
Figure 5 shows a seismogram of the two-way travel times of the different shots relative to their position on the profile. A Butterworth filter with a central window of 80–150 Hz, and an automatic gain control 150 ms long were applied. The area of higher resolution is apparent from the smaller interval between the single traces. Over the entire profile, there is generally a good reflection from the lower ice boundary. Near the grounding line, the boundary between water and bedrock is more difficult to discern. The quality of the reflections improves again with increasing distance from the grounding line. The first multiple of the ice subsurface is visible only at small ice thicknesses close to shot 350. Underneath the ice shelf, the PS-converted reflection of the ice subsurface can be detected between the ice/water and water/bedrock reflections. The position of the flotation point could not be exactly determined, but lies within a few hundred meters of km 11 along the profile, approximately coincident with the break of surface slope (Fig. 3a). The velocity model for the seismic-wave propagation in different media was adapted from the assumptions made in Reference Smith and Doake.Smith and Doake (1994). The mean P-wave velocity through the whole ice column, including the upper firn layer, was calculated as 3708 m s−1. For sea water, a wave velocity of 1450 m s1 was used.
Seismogram of reflection soundings along the central flowline. The recordings show a generally well-defined reflection at the lower ice boundary, which is less clear for the bedrock below the ice shelf near the grounding line. Shots were placed 500 m apart, except around the grounding line, where the shot interval was 125 m.
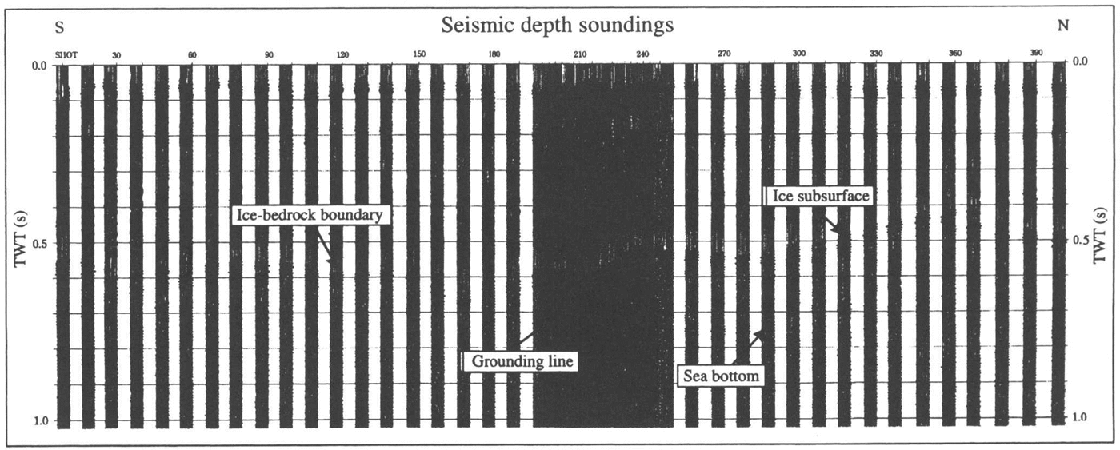
The resulting ice thicknesses are displayed in Figure 3c. They show a maximum thickness of around 1200 m on the grounded part, decreasing to some 800 m about 5.5 km downstream from the grounding line. A very rough bedrock surface can be observed along the whole profile. This is less evident below the ice shelf, but that is probably due to the lower quality of the signal, preventing a continuous determination of seabed reflections. Also shown in Figure 3c is the lower boundary of the ice shelf reconstructed from hydrostatic equilibrium. Apparently, hydrostatic equilibrium is not locally satisfied all along the profile. The bulge in the ice thickness around km 17 can also be seen as a small deflection in the surface data (Fig. 3a), but has no clear explanation. There is no increased lateral compression in the flow direction, nor are there any lateral tributary flows, which could increase the ice thickness north of km 17. Most likely it is just a local anomaly that does not extend in the lateral direction, and is supported by bridging effects from the adjacent thicker ice.
3. Formulation of the Ice-Dynamics Model
Identification of the resistive stresses opposing the ice flow is a long-standing problem in glaciology, and is an important source of information on the mechanics and force balance acting within natural ice masses. Several methods have been documented in the literature to calculate stresses and velocities with depth from surface measurements of ice geometry and velocity. One approach is to start with a model of basal conditions, and use this, together with the field equations, to calculate results which can be compared with measured data (e.g. Reference MacAyealMacAyeal, 1989). That is a trial-and-error technique which makes the solution somewhat arbitrary,and has the difficulty that the basal boundary condition needs to be known, which is seldom the case. Reference BlatterBlatter (1995) discussed another algorithm to calculate the stress and velocity fields, which includes the effects of normal deviatoric stress gradients in the force balance. This method is efficient and gives a unique solution for velocity and stress fields. However, the basal conditions must be known in advance, and the algorithm is unable to deal with floating-ice tongues. A more direct approach was taken by Reference Van der Veen and Whillans.Van der Veen and Whillans (1989a) who proposed a scheme for the forward calculation using measured surface data to infer deep conditions, without “any need for a priori knowledge of basal conditions. Reference MacAyealMacAyeal (1992) approached the same problem with control methods to infer the basal stress distribution of Ice Stream E, West Antarctica.
The method adopted in this study closely follows the reasoning of Reference Van der Veen and Whillans.Van der Veen and Whillans (1989a), and was employed by Reference HøydalHøydal (1996) in a force-balance study of Jutulstraumen, Antarctica. The main assumption is to consider plane strain in the direction of the flow, taken as the x axis, so that all stress and strain-rate components involving the transverse direction y are neglected. Another assumption is a stationary surface, which excludes any time dependence. In this way, the force balance in two dimensions can be written as


where σ ij are the full stress components, p is ice density, g is gravity and the z axis is vertically upward.
The general two-dimensional stress field is then partitioned into a resistive (R ij) and a glaciostatic part,

where δ ij is the Kroneeker delta and (H + h) is the elevation of the upper surface of the glacier. This allows separation of acting forces, resulting from the driving stress, from reaction forces, which result from the gradients of the resistive stresses. The driving stress Td, which arises from the pressure gradient induced by the surface slope, is given by the horizontal gradient of the vertically integrated glaciostatic stress,

where H is ice thickness and h is the elevation of the lower ice boundary.
In the stress balance, the resistive stresses act against this driving stress at the bed and the sides of the glacier, or as longitudinal pushes and pulls within the ice mass. All basal resistive forces sum up to the basal drag τ b:

Integrating Equation (1) over the ice thickness, using the relation between resistive and deviatoric stresses τ ij,

and introducing Glen’s flow law as the constitutive relation (Reference PatersonPaterson, 1994),

produces an expression for the shear strain rate έ xz (analogue to the scaled formulation in Reference Van der Veen and Whillans.Van der Veen and Whillans (1989a)),
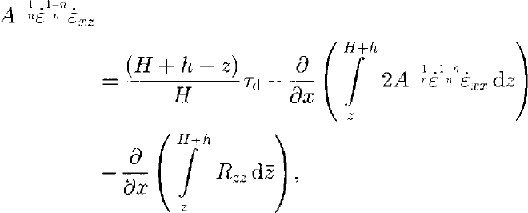
where A is the rate factor, έ ij are the components of the strain-rate tensor, τ ij are the stress deviators (defined as the full stress minus the hydrostatic component) and έ is the effective strain rate. The exponent n is taken as equal to 3.
Introducing the resistive stress in Equation (2), using the boundary conditions for a free surface and the flow law, an expression for the vertical resistive stress R zz can be derived by vertical integration of Equation (2):
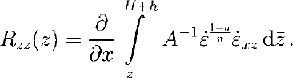
Strain rates are related to velocity gradients by definition, such that

where the righthand side is a formulation of Glen’s flow law and τ is the effective stress defined in terms of all the stress deviator components so that it is independent of the coordinate system. The calculation then proceeds from the surface downwards to the bottom. Boundary conditions are a stress-free surface and known horizontal and vertical ice velocities at the surface. Together with the ice-sheet geometry (surface elevation, surface slope and ice thickness), the above set of equations then allows determination of the shear strain rate έ xz at the surface (Equation (8)), and thus the vertical variation of the horizontal velocity (Equation (10) ). The depth-dependent variation of the vertical velocity then follows from the incompressibility condition

The kinematic boundary condition at the upper surface is given by

where w is vertical velocity, u is horizontal velocity and M is the mass balance, positive in the case of accumulation.
These equations allow a stepwise calculation of the velocity components at the next layer from their vertical derivatives in the actual layer, which again are used to determine the shear strain rate, velocity components, and so on. The numerical solution is obtained by the finite-difference method within a model domain with 41 gridpoints in the flow direction, uniformly spaced 0.5 km apart, and 100 layers in the vertical, which were scaled to local ice thickness. The forward-stepping method was implemented according to (Reference Van der Veen and Whillans.Van der Veen and Whillans 1989a, Reference Van der Veen and Whillans.b), including their reiteration and smoothing algorithm for omitting unrealistic variations of velocity components.
4. Application of Model to the Ekström Grounding Zone
4.1 Smoothing of data
As explained in Reference Van der Veen and Whillans.Van der Veen and Whillans (1989b), the application of their method requires careful handling of the input data. Most important are the surface slope and the ice thickness, because they directly affect the calculation of basal drag through the driving stress. The surface slope is most critical, because potential proportional errors in slope are much larger than errors in ice thickness. Since the spacing of the stake network is smaller than the ice thickness, we first applied a low-pass filter to eliminate high-frequency noise in the profile of ice thickness. The data were filtered by a running mean over five gridpoints, which does not have a large effect on the results, but eliminates the effects of small-scale bedrock undulations, which in reality have little influence on the flow pattern. Surface slopes were taken as a central difference over three gridpoints or a distance of 1 km. This retains the effect of the undulations with a wavelength of several ice thicknesses.
Another inherent limitation to the method is that unless precautions are taken, short-wavelength features develop at depth because of the non-linear nature of the flow law. These short-scale variations exist in reality at the bed, but are filtered by the glacier while transmitting them to the surface. Such short-scale features cannot be prevented from redeveloping when the inverse calculations start at the surface, but these have no physical meaning. Reference Whillans, Chen., van derVeen and Hughes.Whillans and others (1989) deal with this problem by smoothing the velocity field at selected depths as the calculation proceeds downwards. The problem becomes less critical for gridpoint distances near or exceeding the ice thickness, and was successfully dealt with in this study by very light smoothing of the velocity components in the horizontal, with a three-point filter where the central point had a weight of 95%.
The accumulation rate along the 20 km profile shows no systematic changes, and was therefore taken constant as 0.3 m a−1 w.e. (Reference Miller and Oerter.Miller and Oerter, 1990, and from our own stake readings).
4.2 Thermomechanical coupling
Another critical model parameter is the rate factor A, which depends on temperature (Reference PatersonPaterson, 1994). Reference Van der Veen and Whillans.Van der Veen and Whillans (1989b) found that the value of the rate factor plays an important role in the determination of the longitudinal stretching term and the calculation of deep velocities, but is much less important for the calculated basal drag. The temperature dependence of the rate factor can be described by an Arrhenius relationship, but the factor of proportionality is not known within a factor of 5 at best (Reference Paterson and Budd.Paterson and. Budd, 1982). That is equivalent to a temperature difference of 7–l5°C. Therefore the rate factor can be considered as a tuning parameter, which mainly determines the total vertical variation of horizontal velocity.
However, as the rate factor is a strong function of temperature, so it is also of depth. Within a vertical ice column, the temperature usually increases with depth from a value representing the mean annual temperature at the surface to a maximum value close to the pressure-melting point at the bottom. Therefore, deep ice is more ductile than ice close to the surface and experiences the largest deformation rates. Although the depth dependence of the rate factor mainly influences the vertical variation of velocity in the deeper layers, and thus the vertical shear strain rate, the overall stress state was shown to be only weakly sensitive to the depth variation of the rate factor (Reference Van der Veen and Whillans.Van der Veen and Whillans, 1989b; Reference Whillans, Chen., van derVeen and Hughes.Whillans and others, 1989; Reference HøydalHøydal, 1996).
Unfortunately, there is only one measurement of surface temperature close to our profile and we do not have any direct information on the temperature distribution with depth. Rigorous modeling of the temperature distribution is not possible for such a restricted section of a flowline, because this requires information from upstream to deal with the effects of horizontal advection. For want of a better alternative, and in an attempt to approximate the vertical temperature distribution and thus the rate factor as closely as possible, a simple approach was adopted based on the following considerations:
(i) The temperature profile is in steady state
(ii) The grounding-line cross-section can be approximated by a uniform slab of ice with a fixed vertical distribution of temperature relative to depth. The temperature distribution of the grounded part is thereby conserved in the 8 km stretch of ice shelf, where flow and boundary conditions are different. At the observed flow speed of around 150 m a−1 in the ice shelf, this would correspond to a maximum residence time of about 50 years, which is short compared to the conductive time-scale which would, apart from the effects of basal melting or basal accretion, be the dominant mechanism for temperature changes in the ice shelf. In view of the small length of the section (20 km), we believe that applying an identical temperature profile is not unreasonable.
(iii) In the grounded part, the base reaches the pressure-melting point everywhere. Evidence for wet basal tills comes from a recent scismic survey (personal communication from U. Nixdorf, 1997). Also, the dissipative heating produced by a vertically averaged flow velocity in excess of 100 m a−1 should be sufficient to raise the base to the melting point.
(iv) The upper half of the ice slab is isothermal and equal to the average mean annual temperature of –18°C reported by Reference Moser and Reinwarth.Moser and Reinwarth (unpublished). This 50% estimate approximately conforms to the analytical divide solution (Reference RobinRobin, 1955) corresponding to the observed accumulation rate of 0.3 m a−1. Horizontal advection of ice from higher elevations most likely causes a reversed temperature gradient in the upper layers, which is neglected, but this would reinforce the cold isothermal character of the upper part rather than weaken it.
(v) Heating from internal friction is concentrated at the base and is accounted for by increasing the basal temperature gradient resulting from geothermal heating. The geothermal heat flux is assumed to be 55 m W m2, considered to be a typical value for Precambrian shields, and a value widely used in Antarctic modeling (e.g. Reference HuybrechtsHuybrechts, 1990). The frictional heating released at the base is set equal to 3 × 10⁶ J m−2 a−1 (estimated from the product of a vertically integrated shear strain rate of 30 m a−1 and an average basal shear stress of 100 k Pa), which is equivalent to a heat flux of 95 m W m2. Setting the thermal conductivity for ice to 6.75 J m−1 K−1 a−1, both heating terms correspond to a total basal temperature gradient of –0.07 Km−1. The possibility of a temperate basal layer is excluded.
(vi) The temperature profile in the lower half of the ice slab is a third-order function of relative depth. This follows from the specified boundary conditions on the upper and lower parts of the lower half of the profile (both a fixed temperature and temperature gradient)
This allows us to approximate the temperature profile as:


where T is the temperature relative to pressure melting (K) and ζ is a scaled vertical coordinate equal to (z – h)/H. As far as can be judged from measured and calculated temperature profiles in large ice sheets, the result produced by the above equations looks realistic. No attempt was made to refine the above relations by feeding the actual frictional heating resulting from the calculated strain rates and basal sliding back into Equations (13) and (14).
The rate factor is obtained from the Arrhenius equation

where A 0 = 1.86 × 10⁻⁵ Pa−3 a−1, Q = 60 000 J mol−1 and R = 8.314 J mol1 K1. Comparing these values to the average flow parameter values listed in Reference PatersonPaterson (1994), the ice is slightly softer for temperatures below –7°C and up to a factor 3 harder for a temperature near to pressure melting.
5. Driving Stress and Basal Drag
The action of gravity materializes in the driving stress (Fig. 3d). As ice thickness varies proportionally less than the surface gradient, the main control is provided by the surface slopes. Consequently, the driving stress is largest in the grounded part, where it exhibits periodic variations associated with the surface undulations. These small-scale features are retained in the analysis because the slopes are measured over a distance of 1 km, i.e. of the order of the ice thickness. Driving stresses oscillate between 50 and 200 k Pa, which are typical values for grounded ice, but show a trend towards lower values in the direction of the grounding line. The grounding line approximately coincides with the point where the driving stress drops below 50 k Pa, then decreases to near-zero values further down the ice shelf.
The profile of basal drag is closely related to the driving stress, but is shifted by about 500 m downstream and generally has a somewhat lower amplitude. Whereas driving stress follows the variations of the surface, basal drag is governed by resistive forces at the bed. These include the effect of zones of lower or higher basal friction, related to sliding, basal lubrication and the existence of so-called sticky spots, but also to the effect of topographic perturbations (cf. Equation (5)). The phase shift of between π/4 and π/2 is suggestive of a topographical control on surface undulations as predicted by theory. In an extensive analysis, Reference BuddBudd (1970) found that bedrock perturbations transform into surface undulations which are shifted by a quarter-wavelength in the upstream direction, such that the surface is steepest where the ice is thinnest. This transmission from bedrock to surface features was predicted to be most efficient for bedrock wavelengths of the order of 3–5 ice thicknesses. Such conditions seem to be fulfilled along our profile, although an exact agreement with the theory is difficult to establish, as in reality bedrock variations have a three-dimensional character. This would cause the ice to flow around rather than over obstacles, effects which are not well represented m the plane-strain approach adopted for this study. Also, the non-zero values of the basal drag in the ice-shelf section are believed to represent a deviation of the ice flow from plane-strain conditions.
Further calculations pointed to the robust character of the calculated basal drag, which proved to be only weakly sensitive to uncertainties in the flow law and rate factor, as noted previously in Reference Van der Veen and Whillans.Van der Veen and Whillans (1989b), Reference Whillans, Chen., van derVeen and Hughes.Whillans and others (1989) and Reference HøydalHøydal (1996).
6. Vertical Stress Field
In a two-dimensional vertical plane, the force balance is essentially governed by two resistive stresses opposing the driving stress. As the constitutive relation is written in terms of deviatoric stresses, rather than full stresses, these resistive stresses are respectively defined as the vertical resistive shear stress R xz = τ xz and the longitudinal resistive normal stress R xx = 2τ xx + R zz. R zz is a measure for the so-called bridging effects resulting from the infamous “T-term” (Reference PatersonPaterson, 1994), but is usually small and therefore often neglected in similar analyses. Along our profile, maximum absolute values for R zz are <20 kPa. These maxima occur close to depressions in the bedrock and close to the grounding line, but are nonetheless included in the calculations.
For ease of display, the results are shown in a vertical section normalized to local ice thickness. The pattern of vertical shear stress (Fig. 6a) shows a clear distinction between grounded and floating ice, with a characteristic pattern of a regular increase with depth in the grounded part and of an almost total absence of shearing in the floating part. The stress maxima and minima in the upper layers of the grounded ice sheet correlate well with the longwave surface undulations, with maxima corresponding to areas with maximal surface slope and vice versa. In the lower layers, R xz is strongly correlated to the basal drag, and the pattern of maxima and minima is therefore shifted by about 500 m downstream. The shear stress at the base constitutes the main component of basal drag, but generally has somewhat lower magnitudes.
Model results: ice thickness is scaled to unity. The profile is oriented from south (left) to north (right) and corresponds to the x axis in Figure 3. (a) Result for the calculation if the vertical shear stress Rxz = τxz (k Pa) m the scaled model. (b) The longitudinal resistive stress Rxx = 2τxx + Rzz (k Pa) is only important in the upper part of the grounding-line profile. Rzzis a measure for the so-called bridging effects, but is generally small compared to Rxx. (c) Isolines if the horizontal resistive-stress gradient ∂Rxx/∂x along the profile. The pattern of longitudinal stress gradients at the bottom reflects differences between driving stress and basal drag. The gradients are in Pa m1. (d) The vertical distribution of the shear strain rate έxz shows a distinct pattern of concentration in the lower layers of the grounded ice sheet. Values are in 10−3 a−1. (e) Modeled distribution of the longitudinal strain rate έxx within the ice mass (10−4 a−1). The isolines reveal a pattern if compression and extension at the base of the grounded part. (f) Modeled distribution of horizontal velocity u(x,z) in the vertical plane parallel to the central stake line. Isolines are spaced 10 m a−1 apart.
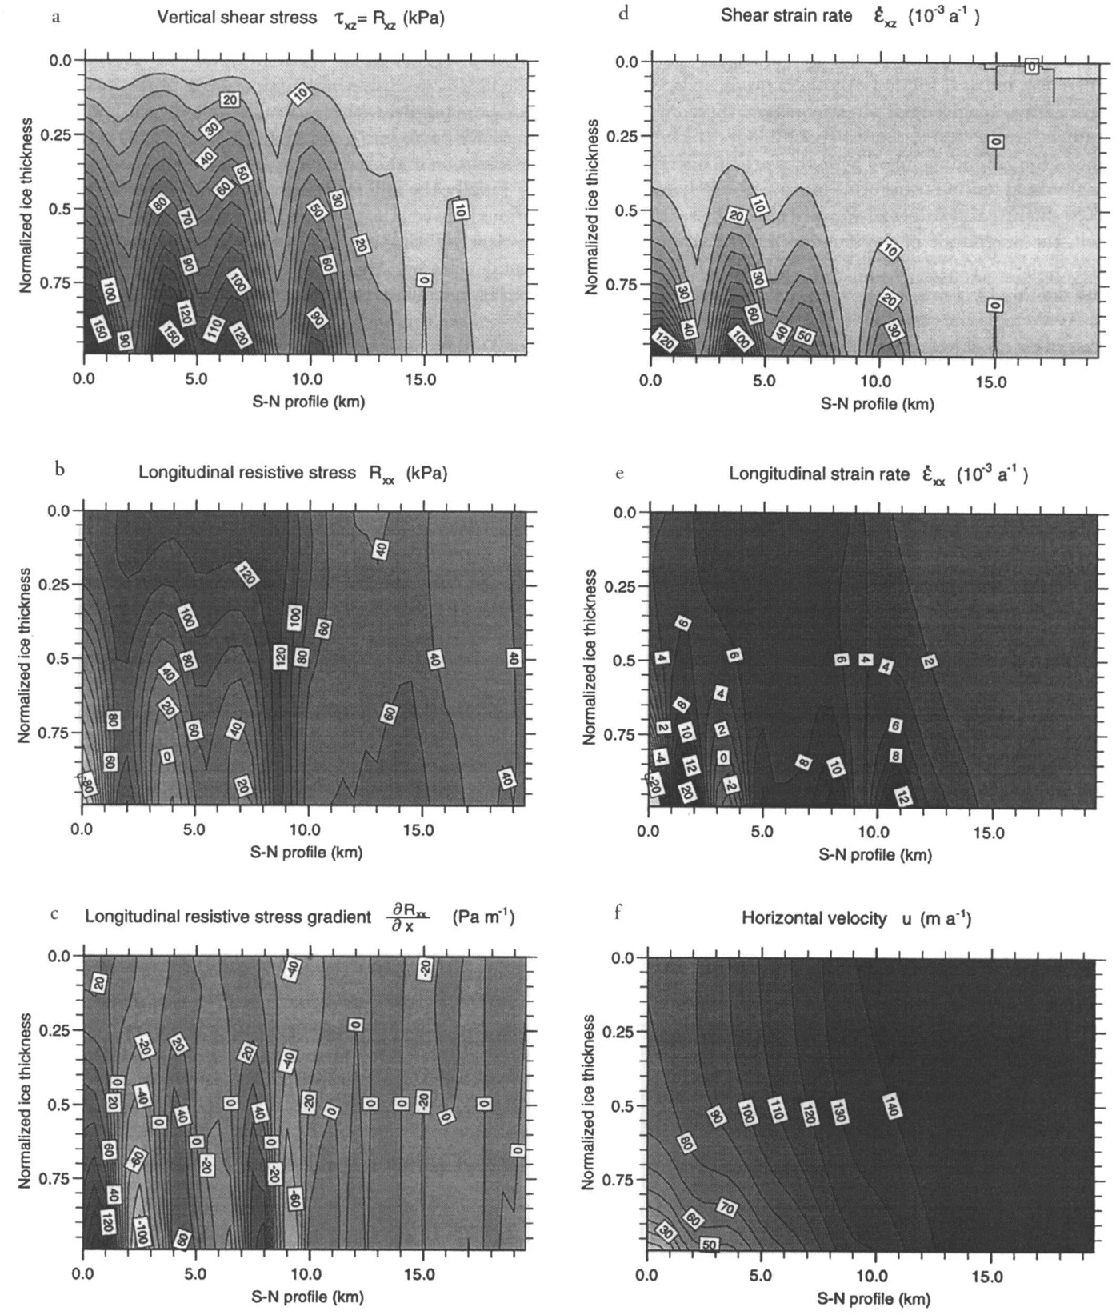
The grounding line coincides with a strong gradient in the shear stresses at a location where the basal shear stress drops off to values <50 k Pa. These further decrease rapidly to near zero within a distance of 2–3 ice thicknesses inside the ice shelf. Some shearing is observed at the lower shelf boundary at km 17, which arises from the local thickness minimum in this area, but the corresponding value is small. The effect is due to the comparably high gradients at the lower shelf boundary, which produce a longitudinal pressure gradient that forces the ice in the direction of the lower hydrostatic pressure and therefore results in some shearing.
The resistive longitudinal stress shows a very different pattern (Fig. 6b). In the grounded part, R xx anticorrelates with R xz. It is high in the upper layers, with values around 120 kPa, and decreases to near-zero values at the base, where variations are also largest. There, longitudinal tension varies between –100 and +120 kPa, which indicates longitudinal pushes (for negative values) and longitudinal pulls (for positive values). These variations can only partly be correlated to bedrock topography, at least in the direction of the profile, as we have no information about the topography in the lateral direction. Nevertheless, it seems that the stress distribution is influenced not only by bedrock perturbations, but also by differences in basal friction. Another conspicuous feature of the resistive longitudinal stress concerns the zero vertical gradient around km 9, that is, about 2–3 ice thicknesses inland of the grounding line. There, the vertical distribution of longitudinal tension transforms into a pattern characteristic of ice shelves, and values of R xx are also highest. In the ice shelf, the magnitude of the longitudinal resistive stress decreases to 40–60 kPa and remains approximately uniform with depth.
For the uniaxial case, the vertically averaged longitudinal stress in excess of hydrostatic pressure for a freely floating ice shelf is given by τ xx = l/4pgH (1 – ρ/ρ w) ≈ 1/2R xx, which for the observed ice thickness of around 900 m would yield values of 200–250 kPa. This theoretical maximum value is far larger than the actual normal deviatoric stress of around 20–30 kPa arising from the analysis. Apparently, most of the driving force is used to push the ice shelf through the confining margins of its narrow embayment. In other words, in this part of Ekströmisen, there exists a ‘“back-stress” (defined as the difference between the theoretical maximum and actually derived normal deviatoric stress) which originates from lateral shearing and would mainly cause horizontal shear.
The relevant quantity for ice deformation in the longitudinal direction is the gradient of the normal deviatoric stress. The distribution of the longitudinal resistive-stress gradient (Fig. 6c) shows very small values in the upper part of the grounded ice body. At the base, the sign of the longitudinal resistive-stress gradient accommodates the difference between driving stress and basal drag (shear stress). In areas where basal drag exceeds driving stress, the normal stress gradient at the base is positive. Differential longitudinal pushes take place where basal drag (or shear stress at the base) is not large enough to balance the driving stress. In the ice shelf, longitudinal gradients of deviatoric normal stresses are near zero, which is equivalent to the virtual absence of longitudinal deformation or thinning in the direction of the flow, as was also evident from the very low surface slopes.
7. Strain Rates and Velocities at Depth
The deviatoric stresses described above are linked to strain rates (velocity gradients) through the flow law. Of interest are the shear strain rate, έ xz ≈ l/2(∂u/∂z) (Fig. 6d), and the longitudinal strain rate, έ xx = ∂u/∂x (Fig. 6e). A major feature of the shear strain rate is the concentration at the base of the grounded ice sheet, which displays a non-linear increase with depth because of the flow-law exponent (n = 3) and the temperature dependence of the rate factor. The magnitude of έ xz is correlated with the vertical resistive stress R xz, and decreases towards the grounding line. In the ice shelf, shear strain rates are non-existent, as could be expected. A sharp transition between grounded and floating ice is well visible in the basal shear strain rate around km 12.
Comparison of the magnitudes of έ xz and έ xx clearly shows that the overall deformation pattern is dominated by shearing. The longitudinal strain rate indicates either compressing flow (for negative values) or extending flow (for positive values). In agreement with the stress analysis above, there is a trade-off at the base between έ xx and έ xz, which is linked to differences between driving stress and basal drag and regions of variable basal friction. Compressive flow at the base occurs where basal drag exceeds driving stress. The flow is extensive in the upper 60% of the ice body all along the profile, with a maximum of 6–8 × 10⁻³ a−1, which gradually turns into a situation with almost no longitudinal deformation in the ice shelf.
Finally, the different flow regimes and the different conditions between the grounded part and the floating part can be clearly distinguished in the vertical distribution of horizontal velocity (Fig. 6f). In the grounded ice sheet, the velocity gradient increases with depth, with almost no velocity shear in the upper 50%, in agreement with the theory. At the base, there are clear indications of the increasing importance of basal sliding. Although near-basal velocities resulting from internal deformation crucially depend on the magnitude and depth dependence of the rate factor (the higher the value for A, the more ductile the ice and thus the higher the velocity shear in the lower layers), there is little reason to believe that the rate factor should sharply increase downstream to accommodate the lower driving stresses. Therefore, an increasing fraction of the flow must occur through basal sliding. This is corroborated by the seismic evidence for wet basal conditions, and the fact that the surface elevation comes close to flotation, thereby increasing the ratio of basal water pressure to the ice-overburden pressure if there is an open connection to the ocean. Whether basal sliding also exists at the beginning of the profile cannot be determined from this analysis.
If basal sliding were of the predicted magnitude, i.e. increasing from about 10 to around 130 m a−1, this would, together with an average basal shear stress of around 100 k Pa, generate a basal heat flux of 30-400 m W m−2. This is an order of magnitude larger than the geothermal heat flux and is more than sufficient to raise the base to the pressure-melting point. In retrospect, this also provides a convincing argument for the occurrence of basal water and basal sliding, as was assumed a priori.
In the ice shelf, the velocity distribution in our longitudinal plane is almost uniform, in both the horizontal and vertical directions. In ice-dynamical terms, this is equivalent to a simple translation. Nor does the shape of the profile, together with the stress and flow conditions, provide any evidence for massive basal melting, as locally observed near the grounding lines of ice shelves elsewhere.
8. Conclusion
The model calculations reveal a clear distinction between the dynamics of grounded and floating ice, which are separated by a narrow transition zone only a few ice thicknesses wide. The dynamic regime of the grounded part is dominated by vertical shearing- most of it at the base, and a pronounced influence of variations in basal resistive stresses, which translate into distinct surface undulations with a wavelength of about four ice thicknesses.
Whether these wavelike features, which can be seen in all variables studied, are the result of bedrock perturbations or point to differences in basal lubrication, is, however, hard to determine from the present two-dimensional analysis. A phase shift between driving stress and basal drag of the correct sign and magnitude seems to favour an interpretation in terms of bedrock topographical variations. On the other hand, the occurrence of basal sliding, which increasingly predominates towards the grounding line, could also point to zones of varying basal resistance.
In the ice shelf, the calculated vertical shear is negligible, as expected, but longitudinal stretching was also found to be very small. This finding was linked to a large back-stress originating from lateral shearing, which was calculated to be about 90% of the normal deviatoric stress required for freely floating ice shelves.
Since the type of grounding zone studied in this paper is normal around the East Antarctic perimeter, one implication seems to be that numerical models of the coupled ice-sheet/ice-shelf system need not deal with grounding-line mechanics explicitly, enabling the use of reduced sets of equations in either flow domain, which can be linked by the continuity equation in dynamic situations. Such a simplification may not hold for West Antarctic ice streams, however, which are believed to behave like ice shelves for considerable distances inland.
Acknowledgements
We thank the members of ANT XI/3 and the crew of MV Polarqueen for their support. B. Riedel of TU Braunschweig, and A. Karsten of FH Hamburg are acknowledged for their remeasurement of several GPS sites during the 1995 field season. P. Huybrechts is supported financially by the Fund for Scientific Research, Flanders. This is Alfred-Wegener-Institut contribution No. 1563.



