Introduction
Metallic nanolayered composites (MNCs) are nanostructured materials possessing impressive mechanical properties, such as high strength, hardness, and fatigue resistance, which can be fabricated by deposition or severe plastic deformation processes [Reference Höchbauer, Misra, Hattar and Hoagland1, Reference Misra, Hirth, Hoagland, Embury and Kung2, Reference Wang, Misra and Hoagland3, Reference Misra, Demkowicz, Zhang and Hoagland4, Reference Shao and Medyanik5, Reference Shao, Zbib, Mastorakos and Bahr6]. MNCs are composed of alternating layers of two or more metallic phases and the layer thickness of each phase is generally less than 100 nm. The interfaces between each layer play a critical role in the deformation of MNCs, as they can act as barriers, sink, and sources of dislocations and vacancies [Reference Hoagland, Kurtz and Henager7, Reference Mastorakos, Abdolrahim and Zbib8, Reference Shao, Wang, Beyerlein and Misra9]. Both experimental and computational studies have illustrated the remarkable thickness-dependent strength in MNCs that can be predicted by the confined layer slip (CLS) model [Reference Misra, Hirth and Kung10, Reference Misra, Hirth and Hoagland11, Reference Huang, Beyerlein and Zhou12, Reference Huang, Wang and Zhou13]. Similar to nanocrystalline (NC) metallic materials, MNCs also exhibit an inverse relationship between the strength and elongation [Reference Huang, Beyerlein and Zhou12, Reference Kavarana, Ravichandran and Sahay14]. To explore the fracture mechanisms in MNCs, Zhu et al. [Reference Zhu, Li, Zhang, Tan and Liu15] examined the deformation zone ahead of the crack tip in the Cu/Ta MNCs and revealed a critical layer thickness, below which the fracture mode of the MNCs tends to be shearing failure. Zhang et al. [Reference Zhang, Zhang, Wang, Lei, Zhang, Niu, Liu, Zhang and Sun16] studied the fracture behavior of Cu/Nb and Cu/Zr. Their experiment results demonstrated that as the layer thickness of Cu layer decreased below 60 nm, the fracture mode in MNCs transited from brittle opening fracture to shear fracture. Based on their experiment results, they claimed that the transition of fracture modes is dominated by the constraint of the soft Cu layer on the brittle Nb or Zr layer. Hattar et al. [Reference Hattar, Misra, Dosanjh, Dickerson, Robertson and Hoagland17] demonstrated four fracture steps (crack deviation, layer necking, microvoid formation, and crack blunting) during the crack propagation in Cu/Nb by using the in situ transmission electron microscopy testing. Radchenko et al. [Reference Radchenko, Anwarali, Tippabhotla and Budiman18] found that the crack propagation under three-point bending in 63 nm Cu/Nb MNCs was inhibited by the interface shear. Atomistic simulations performed by Li et al. [Reference Li, Zhou, Zhang, Huang, Xu, Wang and Lu19] also illustrated the weak interface in Cu/Nb MNCs can hinder the crack propagation in Nb phase by interface shear and dislocation nucleation from interface.
Based on the previous studies, we can see that in most MNCs, the plastic deformation ability is limited by the thickness of the each single-layered phase. The interface in the MNCs can not only influence the strength of MNCs but also affect their ductility and the fracture behaviors. However, it is still unclear how the interface in MNCs affects the fracture mode of MNCs and how the crack interacts with the interface, especially for the cracks cutting through the layers. Atomistic simulations, such as molecular dynamics (MD) simulations, can shed light onto the failure mechanisms of NC materials by directly revealing the underlying atomic scale processes of the deformation and fracture. During the fracture, the crack propagation speed is comparable to the speed of sound and is well captured in the time frame of MD simulations. MD simulations have already been successfully used to explore the fracture behavior for NC metals, nanotwinned metals, and gradient metals [Reference Huang, Wang, Li, Zhang and Zhou20, Reference Latapie and Farkas21, Reference Zhou, Qu and Yang22, Reference Zeng, Li, Lu and Zhu23, Reference Huang, Wang and Zhou24]. In this study, we performed MD simulations of the deformation in Cu/Nb MNCs with a preexisting crack to explore the crack propagation and fracture behavior of MNCs. Our simulation results show that the interface can increase the fracture resistance of the brittle Nb layer by providing the dislocation sources to generate the plastic strain at the front of the crack. The fracture resistance of both layers would be enhanced by increasing the layer thickness. Introducing grain boundaries (GBs) would decrease the fracture resistance of Nb layer, as the GBs act as the weakest location promoting the intergranular fracture.
Results and discussion
Single crystalline samples without GBs
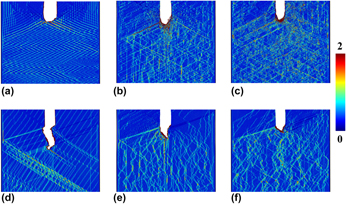
Figure 1 shows the atomistic structure for different single crystalline (SX) samples at 15% engineering strain. The atoms in these figure are colored by the Green strain component εxx. Figures 1(a)–1(c) present the samples for SX Cu and Cu layer in 5 nm and 20 nm SX Cu/Nb samples, respectively. Crack tips in Cu for all three samples were blunted. The crack in SX Cu and Cu layer in 20 nm SX Cu/Nb samples traveled almost the same distance at 15% strain, while the crack length in Cu layer in 5 nm SX Cu/Nb sample is pronounced longer than previous two cases. Figures 1(d)–1(f) present the shape and propagation path of the crack in SX Nb and Nb layer in 5 and 20 nm SX Cu/Nb samples. It is obvious that the final lengths of the crack in Nb layer in SX Cu/Nb samples are shorter than that in the SX Nb sample. In addition, the larger the layer thickness of the SX Cu/Nb samples, the shorter the crack length is.
Atomistic structures of different samples at 15% strain. Atoms colored by the green strain tensor component, εxx. (a) SX Cu, (b) Cu layer in 5 nm SX Cu/Nb, (c) Cu layer in 20 nm SX Cu/Nb, (d) SX Nb, (e) Nb layer in 5 nm SX Cu/Nb, and (f) Nb layer in 20 nm SX Cu/Nb.
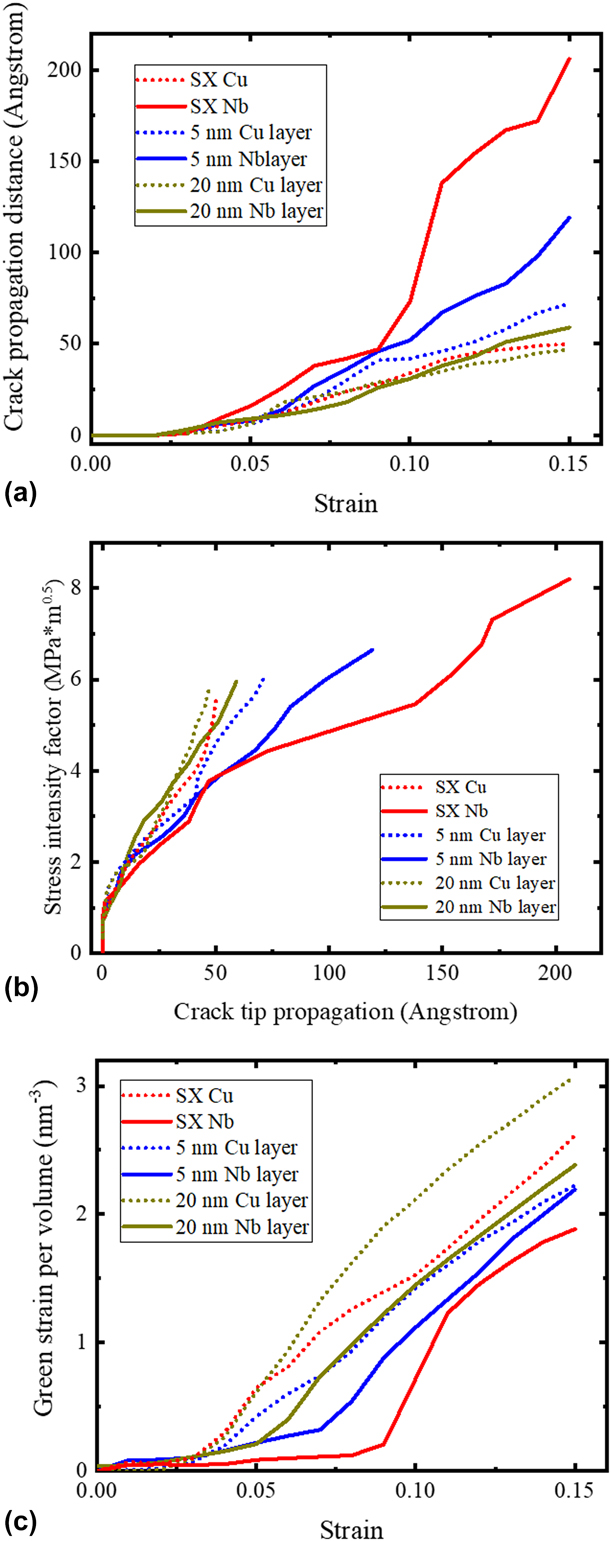
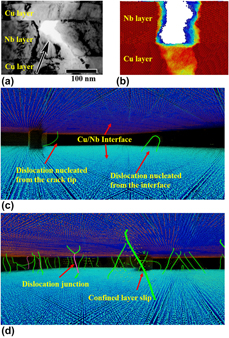
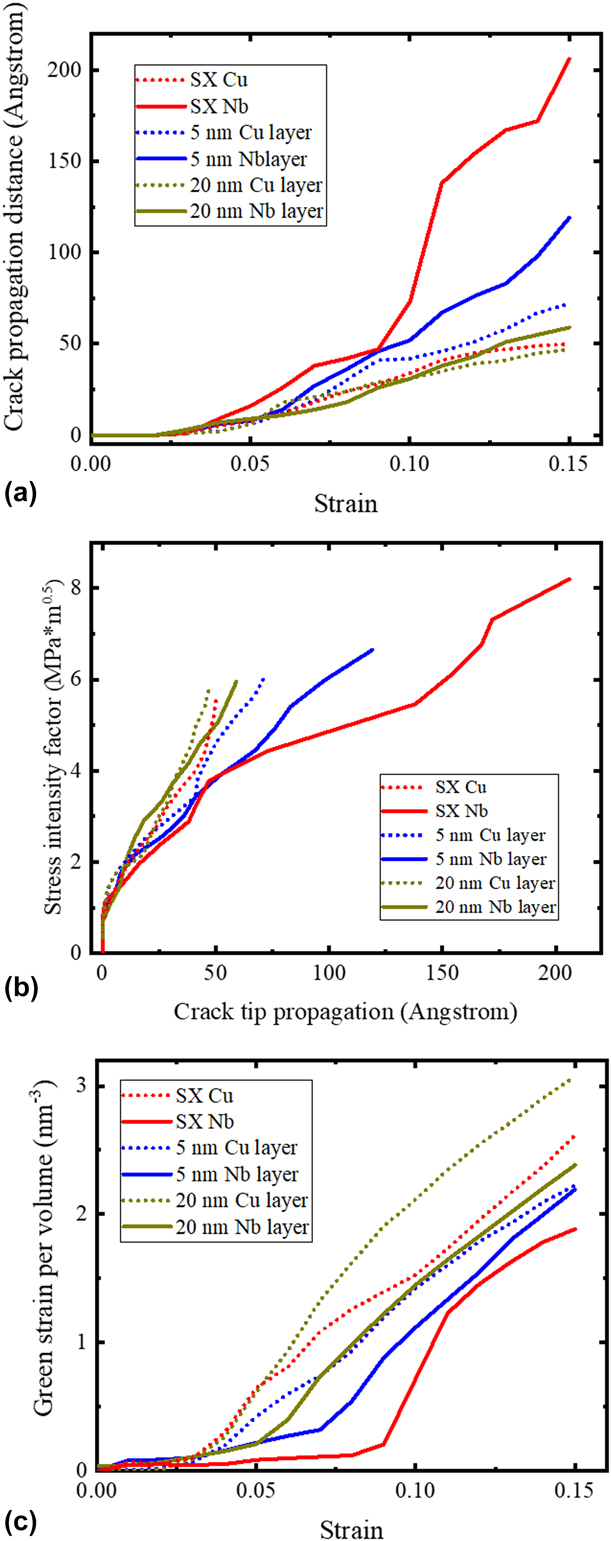
The specific crack tip propagation distances versus the applied strain for all samples are shown in Fig. 2(a). We can see that the crack propagation distances in SX Cu or Cu layer in SX Cu/Nb samples are all below 75 Å. The crack propagation distances are always larger in SX Nb or Nb layer in SX Cu/Nb samples than in Cu. Therefore, even if the initial preexisting crack position are the same in both Cu and Nb layers in Cu/Nb samples, crack propagation path and distance may be different for each phase in MNCs. This trend is consistent with the experiment results [Reference Hattar, Misra, Dosanjh, Dickerson, Robertson and Hoagland17] that the crack propagates/forms faster in Nb layer than in Cu layer, as shown in Figs. 3(a) and 3(b).
(a) Plot of crack propagation distance for different SX samples. (b) SIF curves for different SX samples. (c) Green strain per volume for different SX samples.
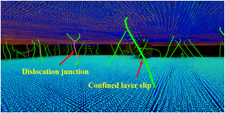
(a) One crack in Cu/Nb MNCs from the experimental work [Reference Radchenko, Anwarali, Tippabhotla and Budiman18]. (b) One crack in SX Cu/Nb samples in this study (the fractured layer is Nb layer and atoms were colored by their Y coordinate. Note: the crack growth direction is perpendicular to the paper in both experimental and simulation tests). (c) Dislocation nucleating from the interface and crack tip (atoms with BCC type were set invisible. Atoms were colored by their Z coordinate. Dislocations with green colors is for 1/2 〈111〉 in {110} slip system). (d) CLS of dislocations. (Dislocations with purple colors represent the dislocation junction.)
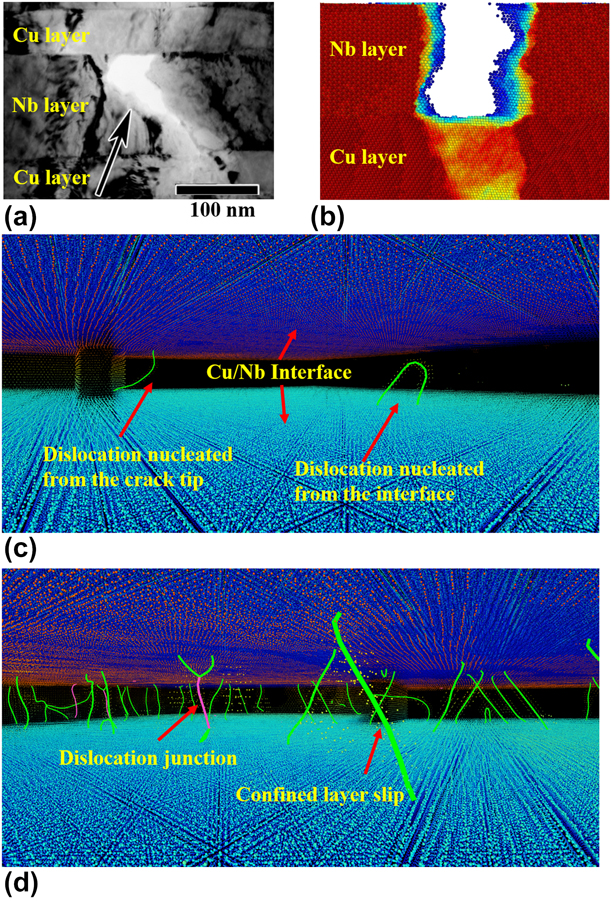
Among the SX Nb sample and the Nb layer in SX Cu/Nb samples, the SX Nb sample has the largest crack propagation distance and fastest propagation rate, as shown in Fig. 2(a). It indicates that Cu/Nb interface can slow down the crack propagation rate and increase the fracture resistance ability of Nb layer. At 15% strain, the crack propagation distance has been decreased by 42% from 21 nm in SX Nb to 12 nm in Nb layer in 5 nm SX Cu/Nb. Moreover, the improvement of fracture resistance is more prominent in the thicker Nb layer. Compared with the SX Nb sample, the final propagation distance for Nb layer in 20 nm SX Cu/Nb decreases from 21 to 6 nm. Thus, the thicker the sample, the better the crack resistance is in the Nb layer. This trend is also consistent with the results from previous experimental study by Kavarana et al. [Reference Kavarana, Ravichandran and Sahay14], which demonstrated that the ductility of MNCs increases with the bilayer thickness.
Figure 2(b) shows the evolution of the stress intensity factor (SIF) versus the crack tip propagation distance. Similar to the trend shown in Fig. 2(a), SX Cu and Cu layer in Cu/Nb samples have larger SIF than the SX Nb and Nb layer in Cu/Nb. And SX Cu and Cu layer in 20 nm SX Cu/Nb carry similar values of SIFs over the same crack tip propagation range, and both of them are larger than that for Cu layer in 5 nm SX Cu/Nb sample. In addition, the SIFs for Nb layer in Cu/Nb samples are larger than that for the SX Nb. And also the larger the layer thickness, the higher SIFs of each phase in Cu/Nb samples.
Since no GBs exist in all the SX samples, Green strain shown in Fig. 1 should totally result from the dislocation activities. The Green strains in Nb layers of SX Cu/Nb samples are more uniform than that in the SX Nb sample. That indicates more slip systems in the Nb layer of SX Cu/Nb samples were activated, which led to a more homogeneous plastic deformation, while the activated dislocation activities were more focused on one or two slip systems in SX Nb sample. Figure 2(c) compares the total green strains induced by dislocation activities per volume for SX samples. It is clear that at the same applied strain, the Green strains induced by dislocation activities are higher in SX Cu and Cu layer in Cu/Nb than in Nb phase or layers. The evolution of the Green strain in each case is consistent well with the crack propagation distance shown in Fig. 2(a) and SIFs in Fig. 2(b). The phase with higher SIF and shorter crack propagation distance normally contains larger Green strain. In metallic materials, there are two ways to release the excess elastic energy stored within the materials: (i) creating new surfaces by opening cracks and (ii) changing the shape of the material via plastic deformation. In the SX samples, the plastic deformation was mainly induced by the dislocation activities. Thus, larger Green strain under the same applied strain indicates more plastic deformation induced by dislocation activates that suppressed the crack propagation to create new surfaces. In the Cu/Nb samples, the interface provides dislocation sources for nucleating interfacial dislocations into each phase, as shown in Figs. 3(c) and 3(d). Thus, the Nb layers in Cu/Nb samples own more Green strain than the SX Nb sample. In addition, thicker Cu/Nb samples carry larger Green strains in both Cu and Nb layers. That is because the CLS is the main dislocation activity in the SX Cu/Nb samples, as shown in Fig. 3(d). The critical stress for activating CLS is inversely proportional to the layer thickness, as follows [Reference Misra, Hirth and Hoagland11]:
 $${\tau _{{\rm{CLS}}}} = {{\mu b\;\sin \;\varphi } \over {8\pi h}}\left( {{{4 - \nu } \over {1 - \nu }}} \right)\ln {{\alpha h} \over {b\;\sin \;\varphi }}\quad ,$$
where h is the layer thickness, μ the shear modulus, ν the Poisson’s ratio, φ the angle between slip plane and the layer interface, b the Burgers vector of dislocation, and α is a coefficient representing the extent of dislocation core. Therefore, the larger the layer thickness, the smaller the critical stress is to activate dislocation motion within the layer. The dislocation-induced plasticity would increase with the layer thickness and therefore increase the Green strain and suppress the crack propagation. In SX samples, dislocations can only come from the crack tip due to the high stress concentration, and the number of dislocation sources is limited. In contrast, the available dislocation sources are plenteous in Cu/Nb sample due to the high density of interfacial dislocation networks [Reference Shao, Wang, Beyerlein and Misra9, Reference Shao, Wang, Misra and Hoagland25]. That is why the Green strain in Cu layer in 20 nm Cu/Nb sample is even larger than that in the SX Cu sample.
Polycrystalline samples with GBs
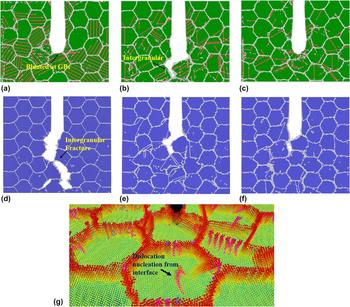
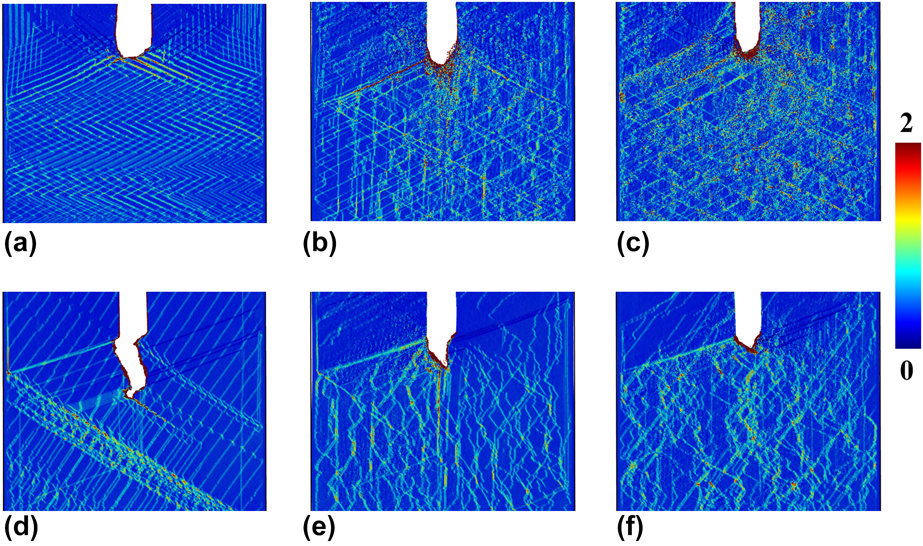
Figure 4 shows the atomistic structure of different polycrystalline (PX) samples at 12% engineering strain. Figures 4(a)–4(c) present the samples for PX Cu and Cu layers in 5 nm and 20 nm PX Cu/Nb samples, respectively. For PX Cu, the crack propagated within the initial grain first. After the tip approached the GBs, the propagation stopped and the crack was blunted at GBs, as shown in Fig. 4(a). For the Cu layer in 5 nm PX Cu/Nb sample, after the preexisting crack approached the closest GBs, it continued growing along other GBs, which induced the intergranular fracture in the thin Cu layer. However, when the layer thickness of Cu layer increased to 20 nm, the intergranular fracture disappeared and crack also was blunted at GBs, as shown in Fig. 4(c). According to the CLS model, the critical stress for dislocation slip within each thin layer in 20 nm samples is much lower than that in 5 nm samples. Thus, more dislocations can slip at the front of the crack, especially those nucleating from the GBs, to release the elastic energy and blunt the crack tip in the 20 nm sample rather than open new surfaces at the front of the crack along the GBs.
Atomistic structures for different PX samples at 12% strain: (a) PX Cu, (b) Cu layer in 5 nm PX Cu/Nb, (c) Cu layer in 20 nm PX Cu/Nb, (d) PX Nb, (e) Nb layer in 5 nm PX Cu/Nb, (f) Nb layer in PX 20 nm Cu/Nb, and (g) one example of the dislocation nucleating from the interface at the front of the crack within the Nb layer in 20 nm PX Cu/Nb sample. Atoms belong BCC and FCC atom are set invisible, and atoms are colored by their Z coordinate. The purple line represents the dislocation line, which belongs to 1/2 〈111〉 in {110} slip system.
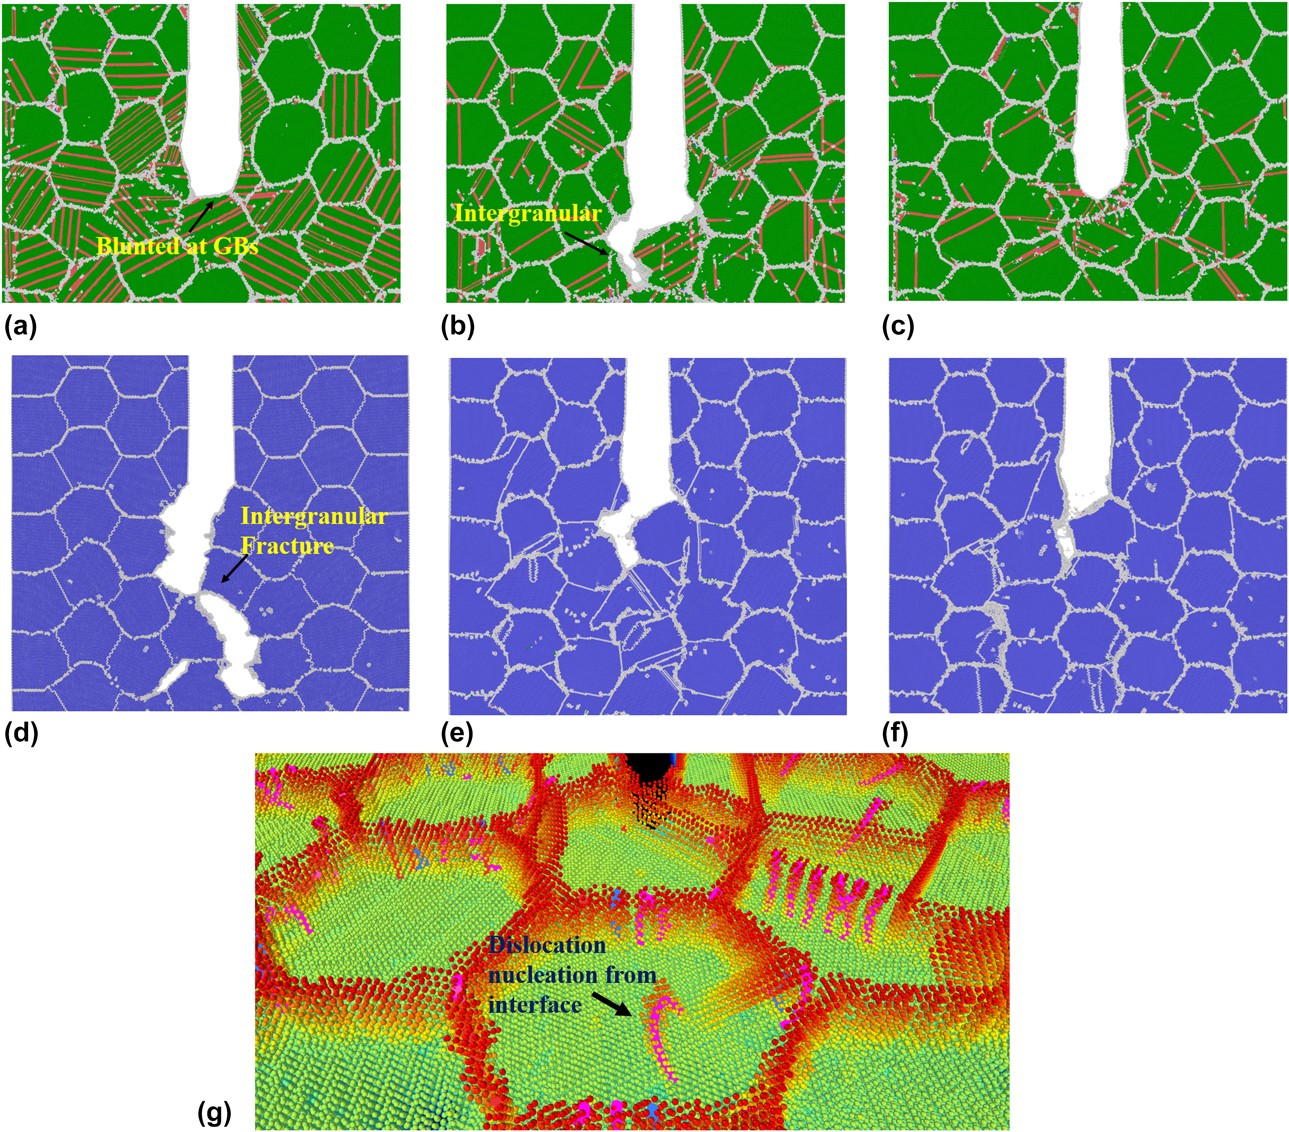
Figures 4(d)–4(f) present the shape and propagation path of the crack in PX Nb and Nb layer in 5 nm and 20 nm PX Cu/Nb samples, respectively. Although cracks in all three samples propagated along the GBs, differences still exist between the PX Nb and Nb layer in the PX Cu/Nb samples. In PX Nb, multiple cracks nucleated at the GBs in the front of the preexisting crack. Those newly formed cracks grow along the GBs. Once they coalesced with the preexisting crack, a long crack formed across multiple GBs. While the crack in Cu/Nb grows much slower and little or less new cracks nucleated at the front of the preexisting crack.
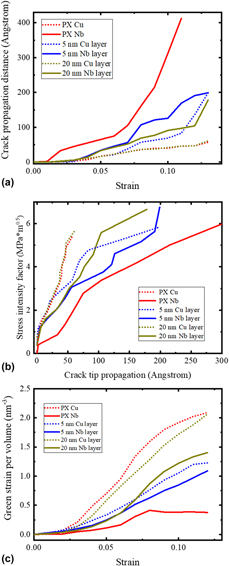
Figure 5(a) plots the crack propagation distance versus the engineering strain for all the PX samples. From the plot, we can see that the crack propagation process for PX Cu sample is nearly the same as that in Cu layer of 20 nm PX Cu/Nb sample. Since there was no crack blunting, the crack propagation distance in Cu layer in 5 nm PX Cu/Nb sample is strikingly larger than that in the PX Cu after 6% strain. This phenomenon may be caused by the suppression of dislocation nucleation at interface when the layer thickness is small. The interfaces may improve the fracture resistance of the Cu layer, but the opposing effect of the GBs make the overall crack resistance deteriorate. As the layer thickness increases from 5 to 20 nm, the fracture resistance ability of Cu layer in Cu/Nb MNCs may recover to the same level as single-phase PX Cu sample. Therefore, the interfaces can improve the fracture resistance. Figure 5(a) also indicates that the trend of crack propagation distance for PX Nb and Nb layer in PX Cu/Nb samples is similar to that in SX samples: (i) introducing the Cu/Nb interface improved the fracture resistance of the Nb layer and (ii) the thicker the samples, the better crack resistance is. As shown in Fig. 4(g), dislocations nucleate from the interface at the front of crack due to the high stress concentration at the front of the crack. Therefore, in the PX Cu/Nb samples, the interface also can provide dislocation sources for nucleating interfacial dislocations into each phase. Figure 5(b) shows the fracture toughness curves for all the PX samples. We can see that, at the same crack tip propagation distance, the values of SIFs in the 20 nm Cu layer and single-phase PX Cu are the same, both of which are larger than the SIF in 5 nm Cu layer. For Nb, the SIF of 5 nm Nb layer is the lowest one among the three cases. The SIF curves for 20 nm Nb and PX Nb overlap each other for the first 50 Å. After the crack propagated 50 Å, the SIF curve of 20 nm Nb deviated from the PX Nb curve. That means the Cu/Nb interface suppressed the crack propagation and increased the SIF in the 20 nm Cu/Nb.
(a) Plot of crack propagation distance for different PX samples. (b) SIF for different PX samples. (c) Green strain per volume for different PX samples.
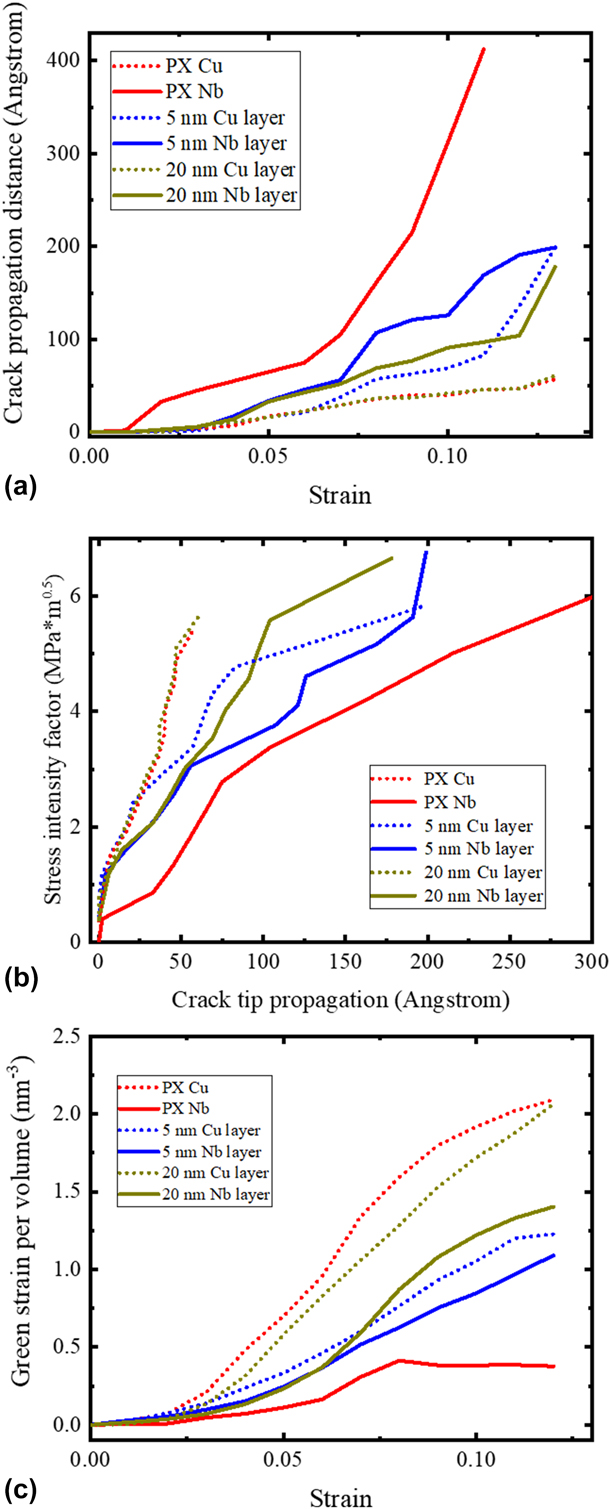
Figure 5(c) compares the total Green strain induced in PX samples. The Green strain induced by GBs atoms were not considered on this plot, as the shape and size of grains and the GBs types are exactly the same for all PX samples. It is clear that the Green strain in the PX Cu samples is always the highest one among all cases, followed by the Cu layer in 20 nm Cu/Nb sample, while the single-phase PX Nb displays lowest Green strain for the full range of applied strain. This trend is consistent with the crack propagation distance plot in Fig. 5(a). Since the excess stored elastic energy can be released either by the crack propagation or by the dislocation slip, larger Green strains induced by the dislocation slip can suppress the crack propagation and increase the SIF. Thus, the Green strains in Nb layers bonded by the Cu/Nb interfaces are higher than those in the single-phase PX Nb, and increasing the layer thickness can facilitate the dislocation activities to generate more Green strains.
Conclusion
In this work, we studied the fracture resistance of SX and PX Cu/Nb MNCs by using MD simulations. Our simulation results are consistent with previous experimental results, which revealed that cracks in Cu and Nb layers may exhibit different propagation paths and distances under the isostrain loading condition. Nb layer in Cu/Nb samples exhibited better fracture resistance compared with the single-phase Nb samples, as the interface can provide abundant dislocation sources for plastic deformation at the crack tip that can suppress the crack propagation and increase the fracture resistance in MNCs. Compared with the SX Cu samples, the Cu/Nb interface would deteriorate the fracture resistance of Cu layer when the layer thickness of Cu layer is below 20 nm. While with the layer thickness increases to 20 nm, the Cu layers in the MNCs possess a similar fracture resistance as that in the single phase Cu samples, as the CRSS to drive the dislocation motion decreases with the increment in the layer thickness. GBs in PX Cu/Nb samples would decrease the fracture resistance of both Cu and Nb layer by promoting the intergranular fracture, so the effect of interface may be not be as prominent as that in SX Cu/Nb samples when the layer thickness is small, while the effect of layer thickness on the fracture resistance will not be altered by the GBs. Our findings in this work can provide fundamental understanding of the fracture behavior of MNCs and have implications for the design of nanostructured materials with better fracture resistance.
Materials and methods
We performed the MD simulation using large-scale atomic/molecular massively parallel simulator (LAMMPS) codes [Reference Plimpton26]. Interatomic potential based on embedded atom method was used to describe the force between each atom. Potentials developed by Mishin et al., Ackland et al., and Zhang et al. were used to describe the interatomic force for Cu–Cu, Nb–Nb, and Cu–Nb, respectively [Reference Misra, Hirth, Hoagland, Embury and Kung2, Reference Liang, Enrique, Alfredo, Xiang-Yang and Michael27, Reference Honeycutt and Andersen28]. These potentials have been used widely in the last decade for many studies and provided a lot of insight for understanding the deformation mechanism [Reference Mastorakos, Bellou, Bahr and Zbib29, Reference Abdolrahim, Zbib and Bahr30, Reference Martínez, Caro and Beyerlein31, Reference Zhou, Averback and Bellon32].
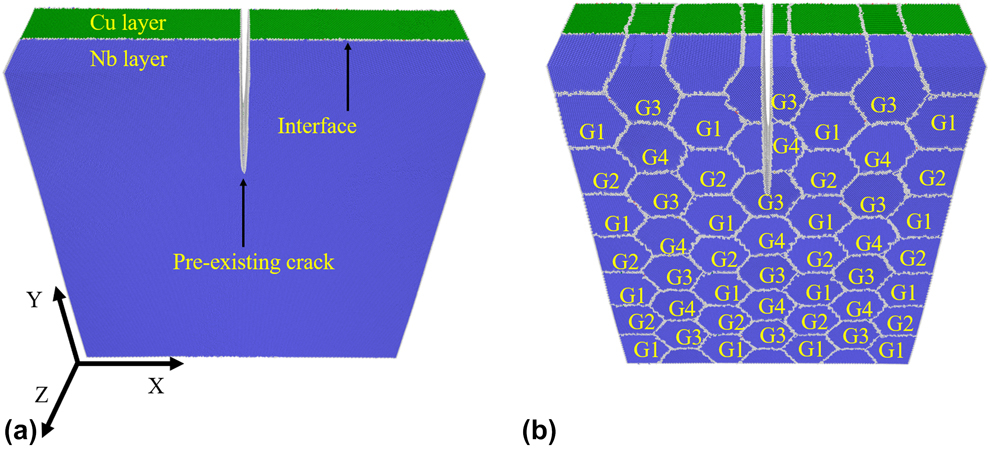
To study the effect of interface and the coupled effect of interface and GBs on fracture behavior of MNCs, we adopted multiple types of samples in our model, which include two-phase samples of SX Cu/Nb, PX Cu/Nb, and single-phase samples of SX Cu, SX Nb, PX Cu, and PX Nb. Figure 6 presents the examples of samples used in our calculations. Periodic boundary conditions have been applied along the thickness direction, which normally contains a large number of thin layers. As our study focuses on the mechanism of crack propagation within the nanolayers, this model may restrict a possibility of the shear localization that may take place at the final/catastrophic fracture stage. Fixed boundary conditions were set in other two directions under external loading. A preexisting crack is created with the crack tip end at the center of each sample. To mimic the microstructure of Cu/Nb composites synthesized by the physical vapor deposition method [Reference Misra and Krug33], the crystallographic orientation for Cu layer is set as x- $\left[ {11\bar{2}} \right]$, y-
 $\left[ {1\bar{1}0} \right]$, and z-[111], while the crystallographic orientation for Nb layer is set as x-
 $\left[ {11\bar{2}} \right]$, y-[111], and z-
 $\left[ {1\bar{1}0} \right]$. This configuration of Cu and Nb phases follows the Kurdjumov–Sachs (KS) orientation relationship [Reference Hoagland, Kurtz and Henager7]. The dimension of the simulation box was optimized to minimize the internal stresses. In the PX Cu/Nb samples, a modified Voronoi method [Reference Schiøtz, Vegge, Di Tolla and Jacobsen34] was used to create the nanograins with a hexagonal shape shown in Fig. 6(b). The grain size for PX samples in this study set to be 10 nm. We fixed one pair of Cu/Nb grains with the initial crystallographic orientation described above and rotated the neighboring grain pairs by 30°, 60°, and 90° along the thickness direction shown in Fig. 6(b). In this way, stable large-angle GBs can be created and the KS orientation relationship can still be maintained in each pairs of Cu/Nb grains; this method has also been used in previous MD simulations of PX Cu/Nb and Cu/Ag MNCs [Reference Huang, Beyerlein and Zhou12, Reference Zhu, Li and Huang35]. Finally, to explore how the layer thickness affects the fracture behavior of MNCs, we vary the layer thickness of both SX Cu/Nb and PX Cu/Nb samples from 5 to 20 nm in our model.
Initial configuration of Cu/Nb samples with a preexisting crack: (a) SX Cu/Nb sample and (b) PX Cu/Nb sample. (Atoms are colored by the CAN method. Atoms with green, blue, and white represent the FCC, BCC, and unknown atoms, respectively. The unknown atoms generally represent the atoms located at GBs and interface.) The crystallographic orientation for Cu layer is set as x- $\left[ {11\bar{2}} \right]$, y-
 $\left[ {1\bar{1}0} \right]$, and z-[111], while the crystallographic orientation for Nb layer is set as x-
 $\left[ {11\bar{2}} \right]$, y-[111], and z-
 $\left[ {1\bar{1}0} \right]$. G1 have the same crystallographic orientation in (a), and G2, G3, and G4 were rotated by 30°, 60°, and 90° along the Z-axis.
Before experiencing loading, the samples were relaxed by the conjugate gradient method first, then equilibrated at 300 K for about 40 ps by the Nose/Hoover isobaric–isothermal ensemble (NPT) [Reference Schiøtz, Vegge, Di Tolla and Jacobsen34] and the pressure in Z direction was kept zero [Reference Hoover36, Reference Nosé37]. After relaxation, we loaded the sample by increasing the SIF of 0.015 MPa m1/2 per step based on the fracture mechanics solution for mode-I fracture [Reference Latapie and Farkas21]. During the each loading step, the boundary atoms within 1 nm from the edge in X and Y directions were fixed, while other mobile atoms were allowed to relax for 1 ps. The crack tip was recorded to extract the crack length at a specific applied strain. Common neighbor analysis method [Reference Honeycutt and Andersen28] and Green strain tensor [Reference Zimmerman, Bammann and Gao38] were calculated to characterize the microstructure evolution. Dislocation structures were generated by the dislocation extraction algorithm [Reference Stukowski, Bulatov and Arsenlis39]. Finally, the atomistic structures were visualized by the software OVITO [Reference Stukowski40].
To determine the Green strain, E ij, for each atom, we first calculated the local deformation gradient tensor F for each atom based on the derivative of the relative displacements of the atom’s neighbors.
 $${{\bi{F}}_{iI}} = {{\partial x} \over {\partial X}}\quad ,$$
where X = [X 1, X 2, X 3] is the original distance vector for atoms to their references before deformation and x = [x 1, x 2, x 3] is the new distance vector during deformation. The neighboring atoms should locate within a cutoff radius for 3.5 Angstrom, which can include at least three non-coplanar neighbors for the targeted atom [Reference Zhang, Tucker and Trelewicz41]. Then, the Green strain E ij is calculated as follows:
 $${E_{ij}} = {1 \over 2}\left( {{{\bi{F}}_{iI}}{{\bi{F}}_{ij}} - {\delta _{IJ}}} \right)\quad ,$$
where δIJ is the identity tensor.
Acknowledgments
This work was supported by the grants from NSF CAREER Award (CMMI-1652662). The supercomputer time allocation for completing the atomistic simulations was provided by the Extreme Science and Engineering Discovery Environment (XSEDE), award number DMR170093.