INTRODUCTION
Pacific oysters (Crassostrea gigas (Thunberg, 1793)) are among the most important filter feeders in marine coastal environments and are also among the most important molluscs for extensive aquaculture. Moreover, based on ecological and market assessment, they are considered a driving force for socio-economic change in ecologically complex coastal systems such as lagoons throughout the Mediterranean area (Gibbs, Reference Gibbs2004; Little et al., Reference Little, Murray, Leschen, Waley, Ross, Telfer, Falconer, Soto and Aguilar-Manjarrez2013).
Shellfish aquaculture is a major industry worldwide, with a production of 15.2 million tons of molluscs in 2012; it represents 23% of the global aquaculture production, which mainly constitutes clams (33%), oysters (31%) and mussels (12%) (FAO, 2014). There has been an increase in Mediterranean aquaculture in the last 30 years and a move from small, land-based enterprises to large, extensive aquaculture activities (Squadrone et al., Reference Squadrone, Brizio, Stella, Prearo, Pastorino, Serracca, Ercolini and Abete2016). For Italy, there is great potential for Blue Growth development, especially for sustainable aquaculture, due to its long coastline, numerous sheltered bays, estuaries and lagoons and occurrence of important economic bivalve species such as Ruditapes spp., Mytilus galloprovincialis and Crassostrea gigas (Seitz et al., Reference Seitz, Wennhage, Bergström, Lipcius and Ysebaert2013). Indeed, Italian coastal areas provide the necessary salinity range and food resources for bivalve growth, making oyster aquaculture a growing industry in Italy. Oysters are generally appreciated for their nutritive quality, organoleptic properties and economic potential (Bayne, Reference Bayne and Wiley1976), with an increasing demand and revenue in international markets (Orban et al., Reference Orban, Di Lena, Nevigato, Casini, Marzetti and Caproni2002, Reference Orban, Di Lena, Nevigato, Casini, Caproni, Santoroni and Giulini2006; Fuentes et al., Reference Flores-Vergara, Cordero-Esquivel, Cerón-Ortiz and Arredondo-Vega2009; Karnjanapratum et al., Reference Karnjanapratum, Benjakul, Kishimura and Tsai2013; Pogoda et al., Reference Pogoda, Buck, Saborowski and Hagen2013). The global production of oysters doubled from the 1970s until 2003, ranging from 272,000 metric tons, with a peak of 765,000 metric tons in 1988 (FAO, 2004). After 2004, a peak of 729,000 metric tons was registered in 2007, while a negative trend was observed in the following years, reaching a value of 625,000 metric tons in 2014 (FAO, 2016). Due to a worldwide decline in oyster production and contemporary market requirements, an increase in catch has been recorded over the last 10 years (FAO, 2016). This leads to a continuous search for natural sites that are suitable for oyster farming.
Our investigation was performed in Varano Lagoon, which is one of the largest lagoons positioned on the south-eastern coast of Italy. Previous studies in this area have emphasized the lagoon as a suitable place for shellfish culture, particularly for mussels, clams and oysters (Cilenti, Reference Cilenti2007; Scirocco et al., Reference Scirocco, Florio, Specchiulli, Cilenti, Pazienza and Breber2008). To diversify fish production, the Pacific oyster Crassostrea gigas has been cultured at commercial farms in Varano Lagoon since 2006 (Cilenti, Reference Cilenti2007). The main objective of this study was to evaluate the growth performance, quality and market aspects of oysters reared in Varano Lagoon. This aim was addressed by verifying the ideal time for oyster processing at two lagoon sites characterized by different environmental and hydrodynamic conditions.
MATERIALS AND METHODS
Geographic area
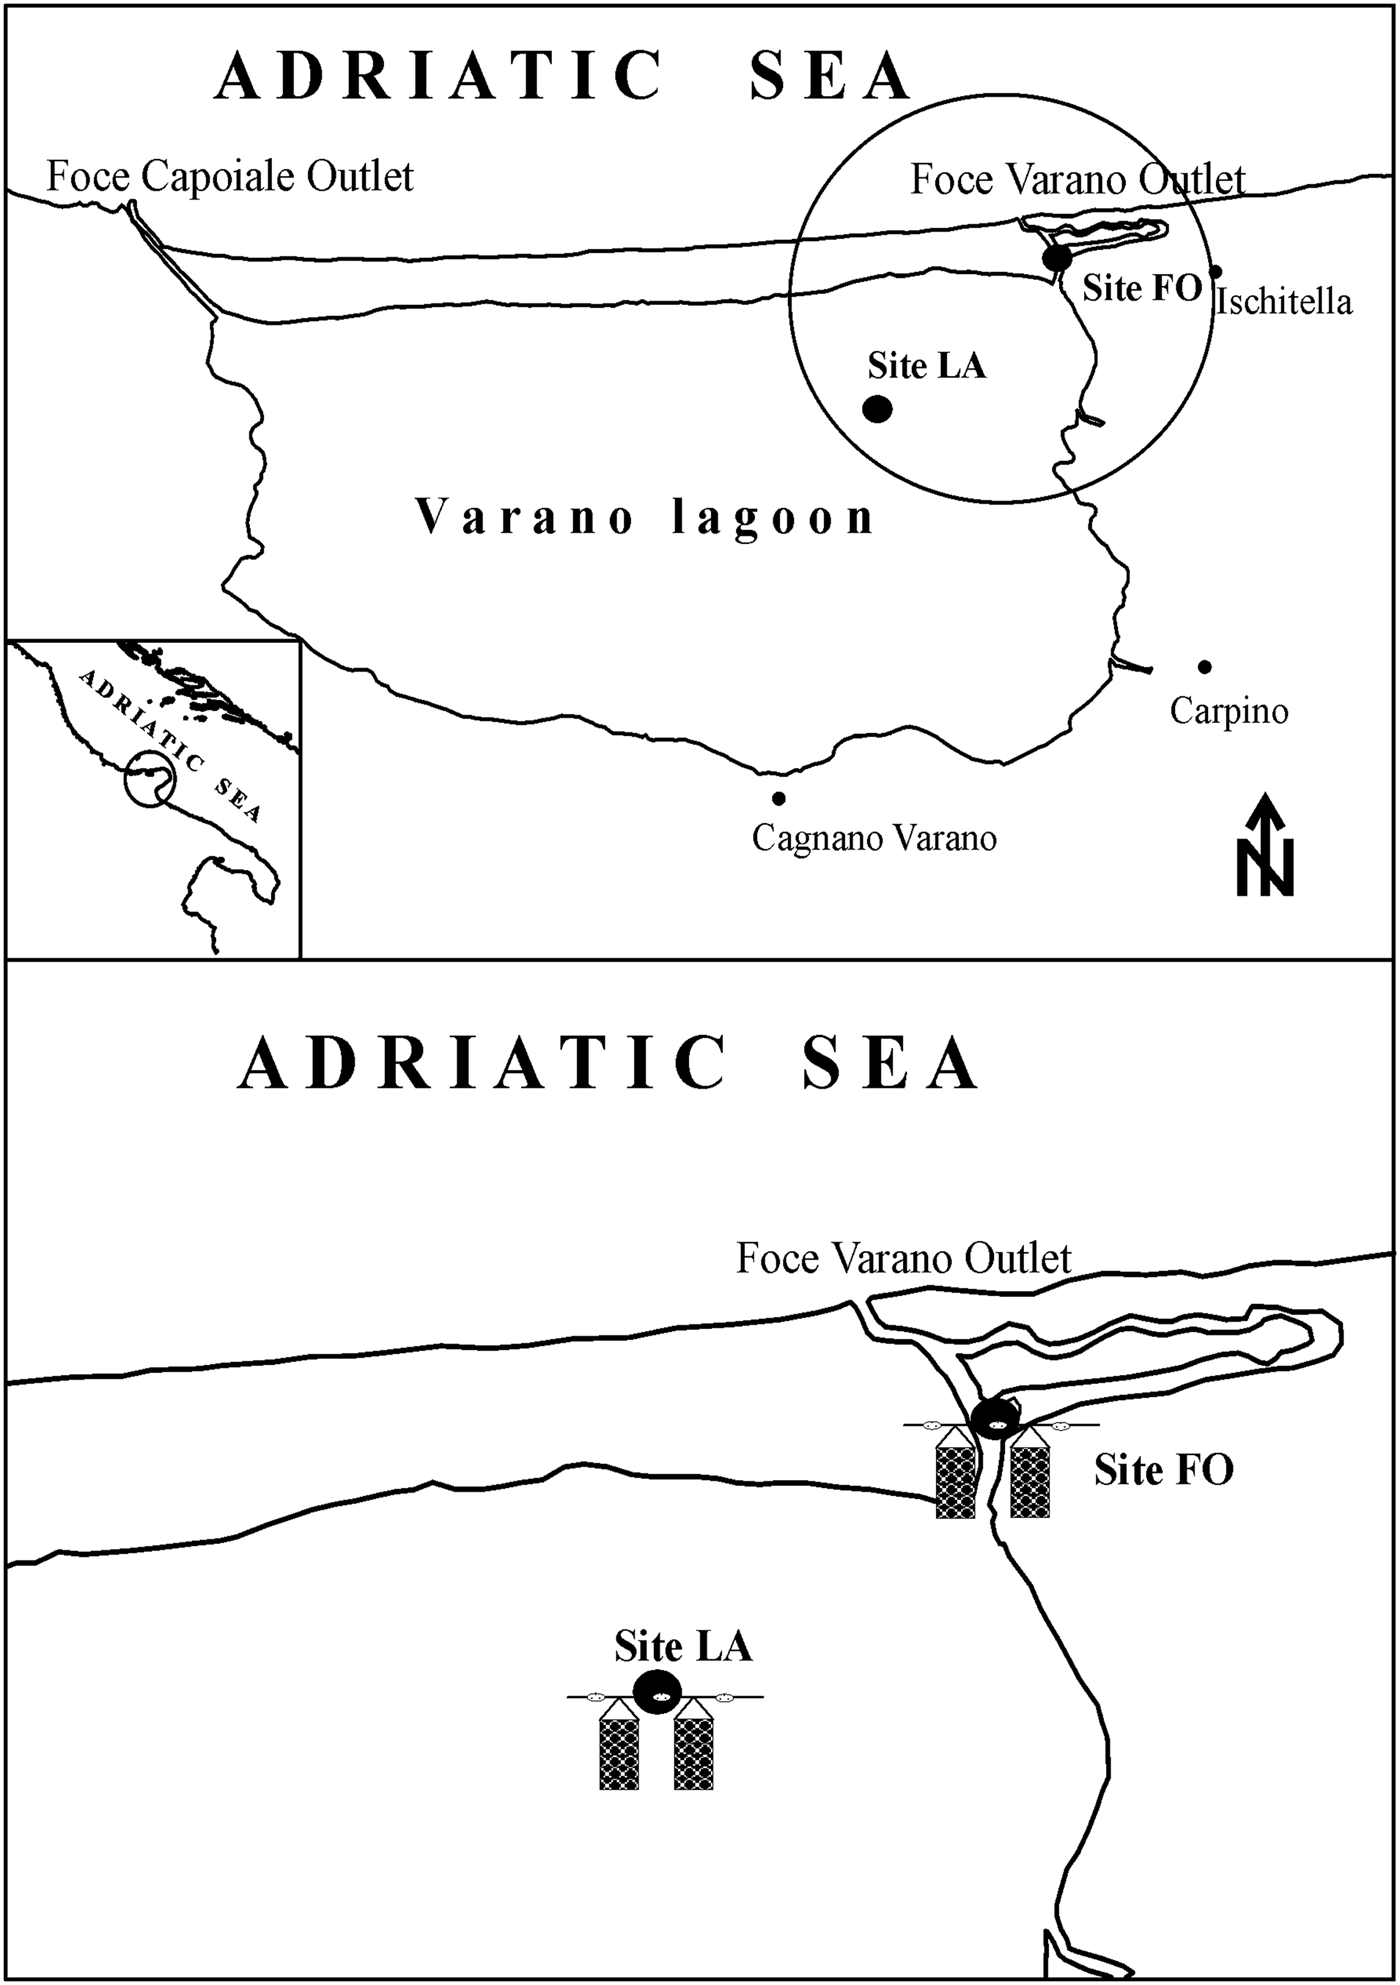
The Varano Lagoon is located on the northern coast of the Gargano Promontory (southern Adriatic Sea) (41.88°N 15.75°E) and is a shallow, semi-enclosed coastal basin with an area of 6500 ha and a perimeter of 33 km (Figure 1). The lagoon represents a typical eurythermal habitat (7–30°C) with high inter-seasonal physiochemical variability (Spagnoli et al., Reference Spagnoli, Specchiulli, Scirocco, Carapella, Villani, Casolino, Schiavone and Franchi2002). The average depth is 4 m, and the maximum depth is 5 m in the central zone. The lagoon is connected to the sea through the Capoiale and Varano inlets (depth 2 m each; length 2 and 1.3 km; width 30 and 25 m; respectively), which regulate the saline balance (25–29 psu) of the lagoon water masses (Specchiulli et al., Reference Specchiulli, Scirocco, Cilenti, Florio, Renzi and Breber2008a) along with tidal (~30 cm), wind and anthropogenic actions (Specchiulli et al., Reference Specchiulli, Renzi, Scirocco, Cilenti, Florio, Breber, Focardi and Bastianoni2010). Prevailing north-north-western (NNW) winds make exchanges much more effective in autumn and winter (Cilenti et al., Reference Cilenti, Pazienza, Scirocco, Fabbrocini and D'Adamo2015), with the main sea water inflow through the north-western channel. The main freshwater inputs are in the south-eastern area of the lagoon and originate from eastern urban and agricultural runoff and livestock breeding and western groundwater springs. The mean residence time of waters is long (~260 days, Molinaroli et al., Reference Molinaroli, Sarretta, Ferrarin, Masiero, Specchiulli and Guerzoni2014), and hydrological and chemical variability follows a seasonal pattern that also varies with freshwater and marine inputs (Specchiulli et al., Reference Specchiulli, Focardi, Renzi, Scirocco, Cilenti, Breber and Bastianoni2008b; Roselli et al., Reference Roselli, Cañedo-Argüelles, CostaGoela, Cristina, Rieradevall, D'Adamo and Newton2013).
Study area and sampling site locations.

Field experiment
Two experimental sites separated by a distance of ~2 km (LA 41°54′2″N 15°47′20′E; FO 41°54′56″N 15°48′6″E) were chosen within the concession for oyster farming (Figure 1). The sites are characterized by different hydrodynamic conditions. The innermost site (LA) was in a deeper (>4 m) and dynamic area that is more exposed to the winds, while the other site (FO) was located within a sheltered and shallow (2 m) channel near a sandbank system that is affected by tidal ranges.
A total of 500,000 C. gigas spat (mean length 8.43 ± 1.57 mm), produced at commercial French hatcheries, were reared in lantern nets from November 2014 to September 2015. Two lantern nets (150 cm length, 60 cm diameter, six compartments arranged in vertical levels, mesh size from 8 × 8 mm to 16 × 16 mm) were hung from a submerged longline system established at 1 m below the water surface and already used for mollusc farming (Mytilus galloprovincialis, Lamarck 1819). During the experiment, 2400 individuals were reared in each lantern (400 per compartment) for assays of growth and survival, condition indices and lipid content measurements. Oyster lanterns were repositioned immediately after sampling to avoid excessive stress on animals. Sampled oysters were carefully stored in refrigerated containers and transferred to the laboratory.
Hydrological and trophic variables
Hydrological and trophic parameters were measured monthly during the study period. Temperature (T°C), salinity (S psu), and oxygen (O2%) were measured using a multiparameter probe (Sea-Bird Electronic SBE-19 Plus). At each site, ~1000 ml of surface water was collected in triplicate with Niskin bottles to analyse nutrients, organic matter and phytoplankton biomass. In the laboratory, water samples were screened through a 200 µm mesh net to remove larger zooplankton and debris. Subsamples (500–2000 ml) were filtered through Whatman GF/F filters and used to analyse total suspended matter (TSM, mg l−1) and the Seston organic fraction (OSM, mg l−1). TSM determination was carried out gravimetrically after desiccation at 105°C for 24 h. The filters were combusted at 450°C for 4 h and weighed to obtain inorganic suspended matter content (ISM, mg l−1). Organic suspended matter (OSM) content was obtained by subtracting the ISM from the TSM (Strickland & Parsons, Reference Strickland and Parsons1972). Aliquots of 100–300 ml of surface water were filtered through Whatman GF/F filters for total chlorophyll a (chl a, mg m−3) analysis following the methods described by EPA 445.0 (1997). For nutrients (ammonia N-NH4 +, nitrite N-NO2 −, nitrate N-NO3 −, μM), the water samples were filtered through 0.45 µm cellulose acetate filters and stored at −20°C before analyses using a Bran + LuebbeQuATro flow analyser following the manufacturer's instructions (Bran & Luebbe 2004; Specchiulli et al. Reference Specchiulli, Bignami, Marini, Fabbrocini, Scirocco, Campanelli, Penna, Santucci and D'Adamo2016).
Biological measures and quality parameters
The individuals (N = 80) were sampled monthly at each site. After a few hours in the laboratory, the main biometric (length, width, thickness) parameters were measured to the nearest 0.1 mm and the weight (whole weight) to the nearest 0.01 g. The lanterns were often cleaned from biofouling, and empty shells were removed.
Monthly specific growth rate (SGR %) was determined according to the following formula:
(SGR %) = 100[(lnL2-L1)/(T2-T1)], where L1 and L2 are the mean shell lengths at the times T1 and T2 (T2-T1 was an average of 30 days) (Chatterji et al., Reference Chatterji, Ansari, Ingole and Parulekar1984).
Empty oyster shells in the lanterns were counted and removed to determine mortality, and the lantern nets were brushed and cleaned of fouling organisms. Mortality was determined as
 $${\rm Mortality}\, \% = {\rm 1}00*\left( {N_{\rm t}/N_0} \right),$$
where N t is the number of empty shells oyster removed from the lantern after time t, and N 0 is the number of oysters at the beginning.
To assess variation in condition indices, ~2 months before reaching commercial size at both sites, a subsample of 30 oysters was used for the evaluation of economic and ecophysiological quality. For this purpose, four condition indices (CI, CICG, CIE, MY), the level of infestation by the worms and the total lipid content were calculated and measured. For CI and CICG, six oysters were opened, and the soft tissue and shells were freeze-dried (48 h minimum) and weighed. The other condition indices were determined using wet weight. Inner-shell valves were also examined to estimate the degree of blistering by burrowing worms according to Fleury et al. (Reference Fleury, Goyard, Mazuri, Claude, Bouget, Langlade and Le Coguic2001). A synthetic ‘Polydora index’ (PI) was calculated to determine the dry mass of the meat (DMmeat) and valves (DMshell), and soft tissue and shells were freeze-dried (48 h minimum) and weighed.
Condition index (CI) was calculated using the equation suggested by Davenport & Chen (Reference Davenport and Chen1987) and Walne & Mann (Reference Walne, Mann and Barnes1975): CI = DMmeat(g)/DMshell(g).
The condition index described by Crosby and Gale (CICG) (Crosby & Gale, Reference Crosby and Gale1990), accounting for the presence of internal fluid and shell cavity volume, was defined as CICG = Mmeat(g)/1000/cavity volume(g) where cavity volume = whole weight (g)−shell weight (g).
The Imai & Sasakai index (Reference Imai and Sasakai1961), also called the Economical Condition index (CIE), was calculated as CIE = shell thickness(mm)×(0.5(shell length(mm)+shell width (mm)))−1.
The AFNOR quality index, or meat yield, is the index mostly used by the French oyster industry and is defined by the French National Organization for Standardization (AFNOR, 1985) as
 $${\rm MY}\; (\% ) = ({\rm wet \;meat \;weight}({\rm g})/\,{\rm total \,weight} \,({\rm g}))*{\rm 1}00.$$
This index divides the oysters into three classes: ‘Not classified’ (AFNOR index less than 6.5), ‘Fine’ (AFNOR index between 6.5 and 9) and ‘Special’ (AFNOR index greater than 9).
Infestation by Polydora (Polydora ciliata) was assessed by the classification of oysters into five classes (Fleury et al., Reference Fleury, Goyard, Mazuri, Claude, Bouget, Langlade and Le Coguic2001). Briefly, each oyster was associated with a degree of damage according to a macroscopic scale from 0 (no mud worms present) to 1 (complete infestation). The Polydora index (PI) was calculated from this classification from 0 (absences of worms) to 1 (total infestation of worms), as follows:
 $$\eqalign{{\rm PI} & = {\rm p}(0)*0 + {\rm p}({\rm 1})*0.{\rm 25} + {\rm p}({\rm 2})*0.{\rm 5} + {\rm p(3)}*0.{\rm 75} \cr & \quad + {\rm p}({\rm 4})*{\rm 1}.}$$
Lipid content was determined in the previous six freeze-dried samples of meat (~2 g). Each sample consisted of a pool of total meat. Total lipids were determined by using chloroform/methanol/water extraction following Bligh & Dyer (Reference Bligh and Dyer1959).
Data analysis
Significant spatial and temporal differences in environmental variables and quality parameters were explored using the Kruskal–Wallis test (Kruskal & Wallis, Reference Kruskal and Wallis1952) and a non-parametric ANOVA for rank by calculating H (the test statistic) and P (the level of significance). To highlight the differences between the two sites in the performance of growth, the Kruskal–Wallis analysis was also performed considering the measurements made on monthly basis. Correlations between specific growth rate and environmental variables were tested by Spearman's rank correlation coefficient. Statistical analyses were carried out using the software program PAST 3.0.
RESULTS
Environmental and trophic variables
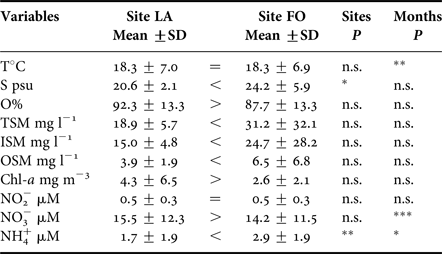
The environmental and trophic parameters characterizing the two sample sites are shown in Table 1. Temperature followed a seasonal pattern and did not significantly differ between sites. Minimum values were registered in January (9.0°C at LA and 9.8°C at FO), while significantly higher values were registered in July (30.1°C at LA and 29.5°C at FO). Salinity was significantly different between the two sites and showed a linear, temporal trend at the LA site, ranging between 17.8 psu in December 2014 and 25.0 psu in September 2015, while a more emphasized but non-significant variability due to tidal effects was observed at the FO site, where it ranged between 15.5 psu in April 2015 and 33.3 psu in July 2015. Waters at LA showed saturation levels slightly higher than at FO, with ranges of 73.4–111.6 and 67.8–112.2%, respectively. The highest saturation level was measured in April 2015 at LA and in June 2015 at FO. The concentration of total suspended matter and the inorganic (ISM) and organic (OSM) fractions did not show significant differences between sites and months. At LA, both TSM and ISM were higher in February 2015 (26.0 and 21.7 mg l−1, respectively) and in July 2015 (29.9 and 22.5 mg l−1, respectively), while at FO, the highest values (121.5 and 103.6 mg l−1, respectively) were observed in November 2014.The highest ISM/OSM ratios were measured in June 2015 (6.9) at LA and in March 2015 (7.4) at FO. Chlorophyll a showed no significant differences between sites and months, although a large difference between the two sites was observed in July 2015, with a peak of 23.1 mg m−3measured at LA while a value of 3.7 mg m−3 was measured at FO. At the FO site, slightly higher values were observed in May 2015 (5.1 mg m−3) and at the end of the sampling (6.6 mg m−3). Mean values of nitrate were comparable between the two sites and significantly changed over the observation period. Both sites showed the highest levels in December 2014 (38.4 µM at LA and 31.2 µM at FO) and a decreasing trend until July 2015, when the lowest values were registered (values < 0.5 µM at both sites). No significant differences were observed in nitrite levels, which showed values lower than 1 µM at both sites for the entire observation period. Ammonium showed significant spatio-temporal variation, and concentrations at the FO site were twice those observed at the LA site. The highest values (6.8 µM) were observed at LA in September 2015.
Mean values and standard deviation (±SD) of the environmental and trophic variables at the two sampling sites (LA and FO).

n.s.=not significant.
Kruskal–Wallis ANOVA by ranks: significant differences between sites and months are reported.
*=P < 0.05; **=P < 0.01; ***=P < 0.001.
Biological measures and quality indices
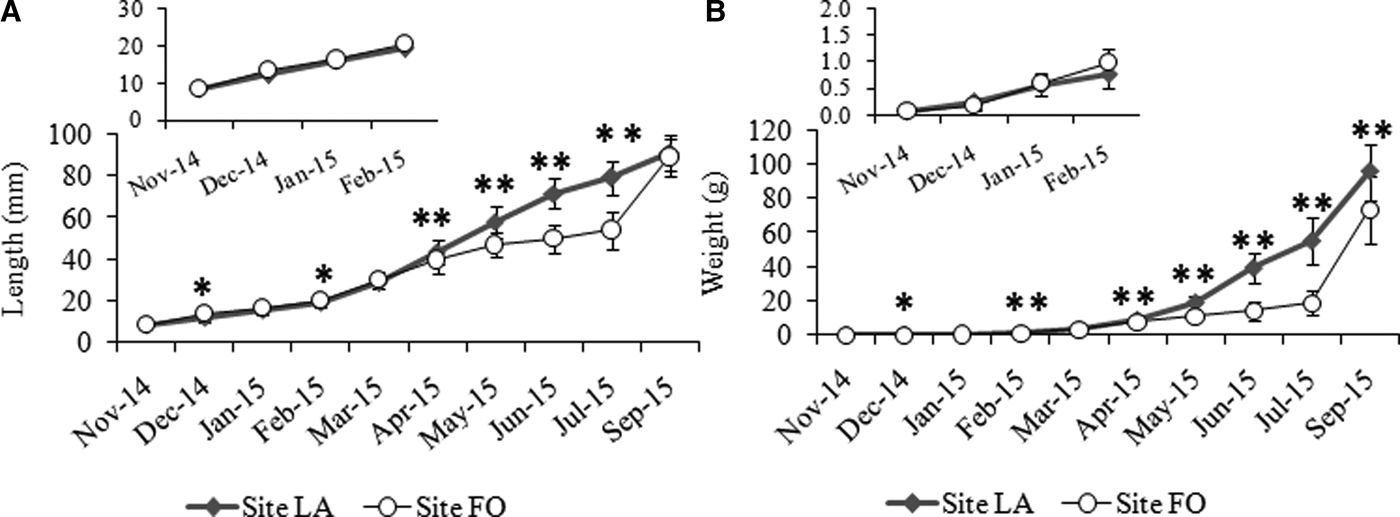
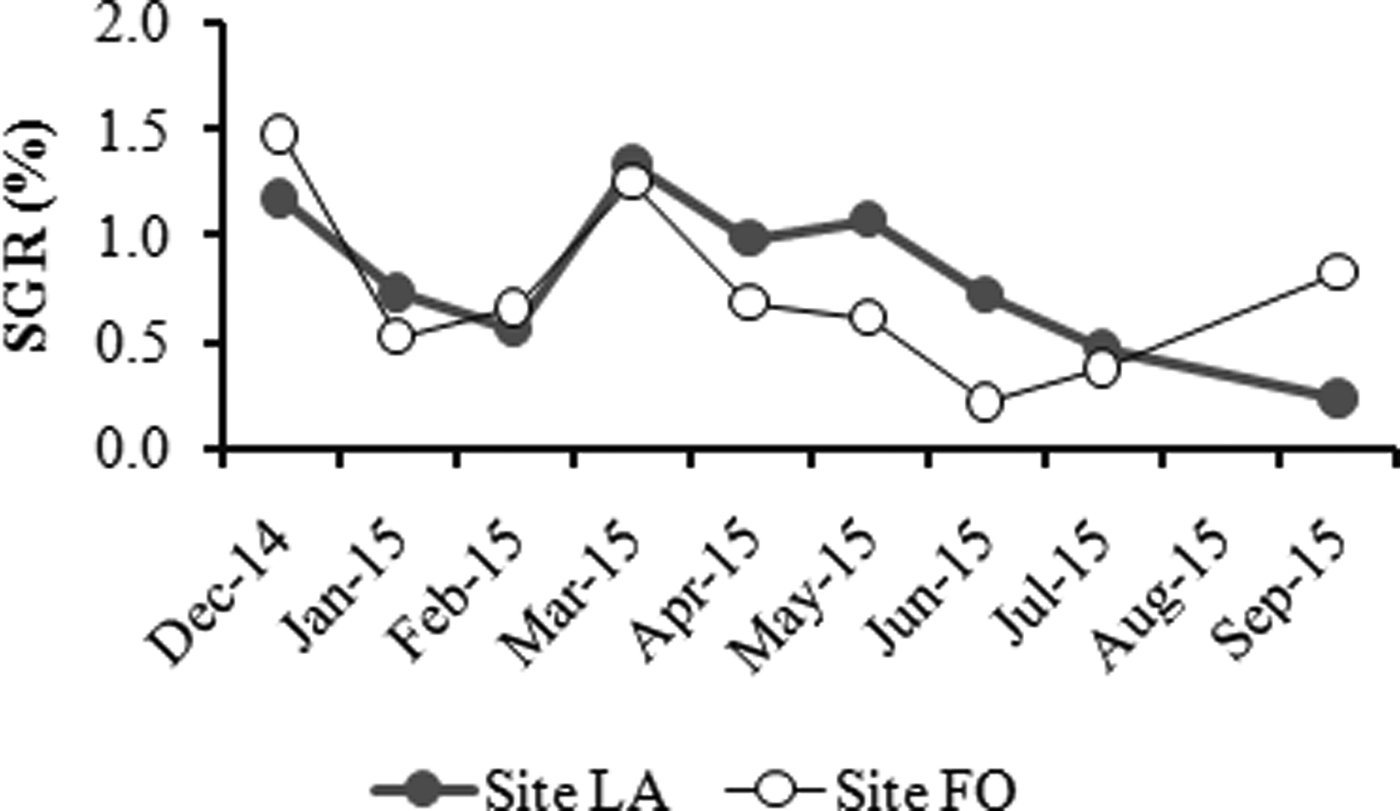
Shell lengths and wet weights of oysters increased significantly (P < 0.05) during cultivation time at both sites. The Kruskal–Wallis analysis performed on a monthly basis showed increasingly significant differences between the two sites over the observation period, with differences in length being more obvious in April 2015 (Figure 2A) and in weight in February 2015 (Figure 2B). The oysters reached the commercial size of 60 mm in June at LA and 2 months later at FO. At the end of the experiment, no significant differences between the two sites were observed in the shell length (91.4 ± 8.4 mm at LA and 89.2 ± 9.2 mm at FO), while a significant (P < 0.01) difference in weight was found (95.9 ± 16.6 g at LA and 73.8 ± 20.9 g at FO). A total mortality of 18% was recorded only at site FO. In this study, the specific growth rate (SGR) of C. gigas showed a comparable trend in the two different sites in the first part of the experiment period (December 2014–March 2015) (Figure 3). From April onwards, there was a markedly greater decrease in growth performance at FO than at LA. In the last 2 months, SGR increased at FO, reaching values two to three times those observed at LA. At site LA, the mean monthly SGR percentages ranged from 1.3% (March) to 0.2% (September), with a mean of 0.8 ± 0.4%. At FO, mean monthly SGR values ranged between 1.5% (December) and 0.2% (June), with a mean of 0.7 ± 0.4% (Figure 3). SGR was negatively correlated with salinity, TSM and ISM at LA (P < 0.05), while no correlations were found between SGR and environmental variables at FO.
Average shell length (±SD) and wet weight (±SD) of Crassostrea gigas cultivated at the FO and LA sites in Varano Lagoon. Significance levels (Student's t-test): *P < 0.05, **P < 0.01.

Monthly specific growth rates (SGR%) in length during the observation period at each sampling site.

The temporal variation in quality indices was calculated in adult oysters before reaching commercial size (60 mm) and is shown in Table 2. In the observation period from March to September 2015, the FO site showed the highest mean values of both CI (high value representing large oyster meat) and CICG (reflecting the fullness of an oyster cup) in September and the lowest values in July. At the LA site, the highest values for both indices were obtained in May, while the lowest values were obtained in September (CI) and July (CICG). High mean CIE values (indicating high economic quality of oysters) were obtained in April and June for FO and in March and September for LA, while low values were observed in March at FO and in May at LA. The AFNOR index or meat yield was high at both sites for the entire observation period, although the LA site showed the highest value in March, and FO showed the lowest in June. The Polydora index (PI) showed the highest values in September at both sites (0.38 at FO and 0.51 at LA), and the mud blister worms began to colonize the inner bivalves from June onwards at both sites. The mean lipid content (wet weight) obtained from March to September 2015 was 1.7 ± 0.6% at LA and 1.5 ± 0.6% at FO. At LA, the total lipid increased from March to May when the highest value (2.6%) was reached and decreased until September (1.5%). At the FO site, lipid percentage increased from March to June when it reached the highest value (17.6%), and then it decreased quickly in July (9.2%).
Quality indices (see the text for explanation) calculated on adult oysters collected from both the sampling sites before reaching the commercial size (60 mm).

DISCUSSION
Blue growth is generally accepted as a long-term strategy to support sustainable growth in the marine sector, thereby allowing the identification of new species and new sites for aquaculture to meet the constant demand for marine products. For this purpose, the Pacific cupped oyster has been cultivated in a municipal grant area in the Varano Lagoon. Growth performance and quality of the products collected from different sites were evaluated as a prerequisite for mollusc farming development. Although oyster shell appearance can be a decisive factor in market price and purchase motivation (Brenner et al., Reference Brenner, Buchholz, Heemken, Buck and Koehler2012), product quality is mostly regulated by biochemical composition and condition indices (Orban et al., Reference Orban, Di Lena, Nevigato, Casini, Caproni, Santoroni and Giulini2006; Filgueira et al., Reference Filgueira, Labarta and Fernández-Reiriz2008; Fuentes et al., Reference Fuentes, Fernández-Segovia, Escriche and Serra2009). Bivalve quality is known to strongly depend on water characteristics and should ensure a safe and healthy product (Lees, Reference Lees2000). Oyster growth is affected by several trophic and physiochemical parameters such as temperature, salinity, nutrient levels and autotrophic production (Pogoda et al., Reference Pogoda, Buck and Hagen2011). In this study, the oysters reached commercial size in 6 months at the LA site and in 10 months at the FO site, and these results seem to be related to variation in salinity between sites. Indeed, the oysters seem to prefer more stable saline conditions (Laing et al., Reference Laing, Walker and Areal2005) as found at the LA site, while the sudden salinity changes characterizing the FO site could be responsible for the limited length. No significant difference in length or weight was observed in the first 5 months of breeding, while highly significant differences were found between the sites in the spring and summer.
The specific growth rate (SGR) was found to be inversely correlated with salinity at the LA site, suggesting that the oysters grew faster under more freshwater input into the lagoon. Indeed, the highest SGR value was found in December 2014 after flood events occurred in September 2014 (Fabbrocini et al., Reference Fabbrocini, Cassin, Santucci, Scirocco, Specchiulli and D'Adamo2017) and in the late winter-spring period (Figure 3). Moreover, SGR increased as TSM decreased. No correlation was found between TSM and phytoplanktonic biomass, indicating a low load of the organic fraction. These results indicated that detritus from sediment may represent a significant source of the TSM, as observed in other coastal areas (Schmidt et al., Reference Schmidt, Gonzalez, Lecroart, Tronczyňski, Billy and Jouanneau2007), and did not contribute to the growth of the oysters. Although the SGR was not related to temperature, the growth rates of suspension feeders decreased in summer when the temperature was high, as also indicated by Resgalla et al. (Reference Resgalla, Brasil, Laitano and Reis Filho2007). At the FO site, no correlations were found between SGR and the environmental variables. Nevertheless, SGR followed a similar trend to that observed at LA during the first 4 months of observation, while the oysters showed slower growth rates from April to July under maximum temperature (~30°C), as mentioned in other studies (Laing et al., Reference Laing, Walker and Areal2005). In addition, the occurrence of summer anoxic events, strong hydrodynamics and shallow depth of the FO site could be responsible for the high turbidity which limited the growth rate, as reported by Çelik et al. (Reference Çelik, Karayucel, Karayucel, Eyüboğlu and Öztürk2015).
Many authors recognize the importance of condition indices to assess the nutritional state of bivalves and their commercial quality (Bodoy et al., Reference Bodoy, Prou and Berthone1986; Crosby & Gale, Reference Crosby and Gale1990; Baghurst & Mitchell, Reference Baghurst and Mitchell2002).
The CI showed seasonal variation at both sites. Variation in condition indices is reported to result from complex interactions between many factors such as the gametogenic cycle and spawning as well as food availability (Boscolo et al., Reference Boscolo, Cornello and Giovanardi2003; Li et al., Reference Li, Qin, Li and Benkendorff2009). In this study, both spatial and temporal differences in the observed condition indices are related to factors other than food, such as environmental conditions. Although not significant, there were marked differences in the CI between the two sites, with better conditions at LA than at FO and reaching a maximum of 6 in May; this value indicates good conditions according to Linehan et al. (Reference Linehan, O'Connor and Burnell1999). In contrast, at the FO site, the oysters showed slow growth in terms of CI, indicating lower adaptation to the environmental conditions at this site. A general correlation between the CI and season has been observed in European coastal areas (Abad et al., Reference Abad, Ruiz, Martinez, Mosquera and Sánchez1995; Soletchnick et al., Reference Soletchnick, Faury and Goulletquer2006; Castillo-Duran et al., Reference Castillo-Duran, Chavez-Villalba, Arreola-Lizarraga and Barraza-Guardado2010; Chávez-Villalba et al., Reference Chávez-Villalba, Arreola-Lizárraga, Burrola-Sánchez and Hoyos-Chairez2010). In our case study, increased differences between the two sites from May to July occurred concurrently with increasing temperatures, which could serve as a major stressor for oysters farmed at the FO site that increases energetic costs and decreases energy reserves for metabolic maintenance (Flores-Vergara et al., Reference Flores-Vergara, Cordero-Esquivel, Cerón-Ortiz and Arredondo-Vega2004).
The CICG reflects the fullness of the oyster meat, with higher CICG values corresponding to more oyster meat. Despite finding no significant differences between oysters collected from the LA and FO sites, oysters cultivated at LA had CICG values in May that were about twice those obtained from oysters harvested at FO. This result confirms that the FO site may be characterized by environmental stress conditions. A comparison with other studies highlights that oysters reared in Alaska (84–155, Oliveira et al., Reference Oliveira, Himelbloom, Crapo, Verholt, Fong and RaLonde2006) and Japan (132–169, Futagawa et al., Reference Futagawa, Yoshie-Stark and Ogushi2011) are fuller than those reared in Varano (33–87, this study). Based on CICG values, the oysters reared in the Varano Lagoon are apparently not well filled with meat. In contrast, CIE values highlighted the economic quality of oysters reared in the Varano Lagoon. Indeed, the values obtained in both sites during the observation period varied between 0.35–0.46 except for FO in June (0.05), and this range is comparable to that obtained in other areas that have been recognized as suitable for oyster production with an economically reasonable size for harvesting (Linehan et al., Reference Linehan, O'Connor and Burnell1999; Oliveira et al., Reference Oliveira, Himelbloom, Crapo, Verholt, Fong and RaLonde2006; Futagawa et al., Reference Futagawa, Yoshie-Stark and Ogushi2011).
The AFNOR index for meat yield did not significantly differ between the two sites and had values higher than 15, which suggests that the Varano Lagoon was able to produce oysters defined as ‘Special’, according to the classification reported by Soletchnik et al. (Reference Soletchnik, Le Moine and Goulletquer2001) for Crassostrea gigas reared in France.
However, a real problem for the marketability of Varano oysters was the presence of the mud blister worm (Polydora ciliata) from June to September. The Polydora index trend at both sites indicated no mudworm presence during the juvenile stage before reaching the commercial size followed by a significant increase (P < 0.01) during the marketable stages that occurred more rapidly at LA. This may be due to increased temperatures, as was also found in France (Royer et al., Reference Royer, Ropert, Mathieu and Costil2006). Indeed, environmental factors such as high salinity, high temperatures, and shallowness that are typical of the summer season in coastal lagoons may be responsible for the occurrence of Polydora sp. (Caceres-Martinez et al., Reference Caceres-Martinez, Macias-Montes de Oca and Vasquez-Yeomans1998; Ruellet, Reference Ruellet2004).
Lipid content represents the main energy reserves for gametogenesis in bivalves (Kang et al., Reference Kang, Park, Lee, Choi and Lee2000; Dridi et al., Reference Dridi, Romdhane and Elcafsi2007; Pogoda et al., Reference Pogoda, Buck, Saborowski and Hagen2013), and variation in this trait is closely related to gamete development, with the maximum lipid content corresponding to maximum ripeness and the lowest lipid value corresponding to the spawning period (Liu et al., Reference Liu, Li, Yuan and Zhang2008). The total lipid content obtained in this study was higher in oysters in May and June, with values comparable or greater than those found in Japanese areas (Futagawa et al., Reference Futagawa, Yoshie-Stark and Ogushi2011).
Mortality was recorded only at the FO site, with a rate of 18% during the observation period and a greater incidence in summer in oysters with shell length ranging from 38 to 47 mm; lower (14%) cumulative mortality among juvenile Crassostrea gigas was reported in a semiarid lagoon in north-western Mexico (Castillo-Duran et al., Reference Castillo-Duran, Chavez-Villalba, Arreola-Lizarraga and Barraza-Guardado2010). An increase in mortality was observed from May to September that was probably due to physiological stress related to reproductive status, as observed by other authors (Berthelin et al., Reference Berthelin, Kellner and Mathieu2000) and which is emphasized by environmental stress conditions.
In conclusion, we evaluated the influence of physiochemical variables on oyster culture at two different sites of the Varano Lagoon until harvest. The oysters reared at the LA site reached commercial size in June and had the highest condition indices and lipid content and lowest Polydora index, prior to sale before the summer. In contrast, the oysters at the FO site reached commercial size after the summer when the condition indices and the lipid content were low and the Polydora index was high.
The results of this study show that the environmental conditions of the area surrounding the innermost LA site were more suitable for oyster culture and allowed the oysters to reach commercial size (60 mm) in a shorter amount of time (6–8 months). Although oyster length and weight in the LA site were greater than in the FO site during the entire study period, the sizes of the animals reared at the two sites were comparable in terms of shell length and dry mass at the end of the experiment. In the spring, nutrient availability in the lagoon positively affected the feeding response of suspension feeders, and the oysters showed higher growth performance. The decrease in growth was observed in winter and in summer because of the simultaneous decrease of nutrients and increase in salinity, TSM and ISM. The results highlight the potential economic benefits associated with sustainable aquaculture development in the lagoon, although the presence of the mud blister worm (Polydora sp.) could be a real problem, as it damages oyster market value and threatens serious financial loss to farmers.
ACKNOWLEDGEMENTS
We wish to thank the Ischitella Fishing Consortium (FG) for their support in sampling activities.