

Introduction
The pattern of wing venation is an important component in the classification of Lepidoptera (Nielson and Common, Reference Nielson, Common and Naumann1991; Scoble, Reference Scoble1992), which may vary greatly within species, especially among allopatric populations. The veins are characteristic of the wing, appearing as longitudinal stripes, and run from the wing base to its apex. They are distributed in taxon-specific two-dimensional patterns, which are complicated through cross veins running between the longitudinal ones (Bier, Reference Bier2000; De Celis and Fernando, Reference De Celis and Fernando2003). The wings of different insects present many modifications of shape, size, structure and venation patterns that underlie their adaptation to a variety of functions such as locomotion, defence, protection, display devices and regulation of body temperature. Secondary adaptations of either the fore- or hindwing may also occur in Coleoptera, Strepsiptera and Diptera (Imms, Reference Imms1964).
Geometric morphometric methods provide powerful tools to describe and analyse biological form (Bookstein, Reference Bookstein, Marcus, Corti, Loy, Naylor and Slice1996). The geometric morphometry represents an important new perspective to study the species variation as well as its covariation among populations (Rohlf, Reference Rohlf, MacLeod and Forey2002). Applications of traditional distance measurements are also used for size explorations; but it provides limited information about the shapes. Conversely, geometric morphometric methods inform shape variation mostly in a quantitative way. This is important, because typically taxonomic characters concern variation in shape rather than size (Mutanen, Reference Mutanen2005).
Some systematic studies involving phylogenetic analysis use female specimens, while others include both male and female specimens (Pretorius, Reference Pretorius2005). Here, we investigate the extent of morphological similarities and differences among the morphs and for proper determination of variation, we compared fore- and hindwing of both male and female moths.
Little attention has been paid to the study of intraspecific variation in wing venation, although many authors reported extensive studies on wing venation in different taxa. Warren (Reference Warren1936) demonstrated that in the genus Erebia (Nymphalidae), wing venation varies considerably within species and even displays an asymmetric pattern in individuals. Similarly, Sotavolta (Reference Sotavolta1964) demonstrated considerable intraspecific variation in wing venation in Arctiidae.
The Indian moth species producing silk are well known, probably better than in any region of the world. The sericigenous saturniid Antheraea assamensis (Helfer 1837) (Lepidoptera: Saturniidae) (muga silkworm), having the lowest chromosome number n = 15 in genus Antheraea, is exclusively confined to the Brahmaputra valley of Assam, India (Rao, Reference Rao1978; Seth, Reference Seth, Agarwal and Seth2000), due to its unique ecological niche. It produces golden-coloured silk of high economic value. Although it is known as a monotypic species, it has four distinct larval colour morphs in semi-domesticated populations and a wild morph (Thangavelu et al., Reference Thangavelu, Chakraborty, Bhagawati and Isa Md1988), which has not been studied from the taxonomical point of view (Singh and Sen, Reference Singh and Sen2001). The colour morphs and the wild morph vary in their phenotypic characters depending upon the alternation of generation, host plant selection or seasonal changes. Moreover, according to habitat status, the animals may change their characters. The wild form shows diapausing behaviour and may be univoltine or bivoltine, whereas the semi-domesticated forms are devoid of diapause, resulting in five to six generations per year. The green form is the prevalent stock, while the blue, orange and yellow ones are of rare occurrence in nature. Due to narrow or endemic distribution and lack of better alternative strains, this silkworm faces the problem of inbreeding depression. To mitigate this problem, the villagers allow the female moths of semi-domesticated stock to copulate with males from the dense forest of unknown origin, which is called wild morph. This is a traditional practice and thus the breeding stocks have been maintained from time immemorial.
The homeland of A. assamensis, the narrow strip of Brahmaputra valley, is located in the far Northeast corner of India. This part of India is geographically isolated and lagging behind in all respects. Perhaps due to this reason, detailed investigations on wild-type and semi-domesticated forms have not been done on A. assamensis in spite of their high economic value. Arora and Gupta (Reference Arora and Gupta1979) described the wing venation of the prevalent green colour morph of A. assamensis. The authors studied the venation pattern of all available morphs using morphometric methods. This may be helpful in identifying the genetic variation among them.
Materials and methods
Samples
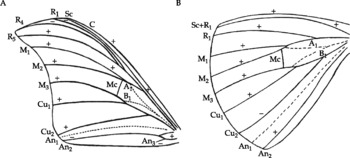
Larvae of A. assamensis were reared at the rearing house of the Institute of Advanced Study in Science and Technology (IASST) located at Boragaon, Assam, India. The coloured larvae viz. green, blue or orange were reared separately. The wild morphs were collected from the forest in the diapausing cocoon stage. All these forms of A. assamensis are termed as ‘morphs’ in this paper. The left forewing and left hindwing of both sexes of all morphs were considered in this study (Fig. 1). Twenty samples of wings were examined for each wing area, sex and morph.
Wing venation pattern of Antheraea assamensis Helfer. A, forewing; B, hindwing.

The wings were pulled apart with axillary sclerite pincers and immersed in 10% boiling KOH, rinsed in distilled water and transferred to dilute ethanol (30–50%). They were then placed in 50:50 aqueous solution of sodium chloride and sodium hypochlorite to bleach, and intermittently washed in 10% HCl to speed the bleaching. After rinsing with distilled water for 5 min to remove the acid and bleach, the wings were stained with 1% eosin in 70% ethanol for 24 h. They were again rinsed thoroughly three times in 70% ethanol, and the samples were placed in clean, dry Petri dishes (Dicky et al., Reference Dicky, Erick, Kokko, Barron, Schaalje and Gowen1992). Wing venations were observed under a binocular microscope.
Nomenclature
The nomenclature of the vein was adopted from Hamilton (Reference Hamilton1972). According to this system, the wing veins are named from anterior to posterior. The convexity and concavity of the veins are denoted by ‘+’ and ‘ − ’, respectively, and compared with the Richards and Davies (Reference Richards and Davies1977) system.
Measurements
For geometric morphometric analysis, the processed wing samples were photographed with a Sony 8.1 mega pixel digital still camera (VX DSC H7 Model) mounted on a frame so that the wings were at a fixed distance from the camera and the images were transferred to a computer for processing. The tpsDig programme (F James Rohlf, Version 1.2) was used to digitize the landmarks, and the landmarks are indicated by labelled dots on the wing images. The co-ordinates of all specimens were aligned using the procrustes-generalized orthogonal least-square superimposition method (Rohlf and Slice, Reference Rohlf and Slice1990), which fits one configuration over another by minimizing the sum of squared distances between homologous landmark among each group of colour morphs and wild counterpart. For each specimen, the centroid (CTR) sizes (Bookstein, Reference Bookstein1991) were calculated as derived from coordinate data. Landmark configuration of each specimen was aligned, translated, rotated and scaled to a unit CTR size using the consensus configuration of all specimens. The average configuration of landmark resulting from this procedure served as the ‘reference’ or tangent configuration in subsequent computations. Procrustes to tangent (PT) distances were calculated among the different groups by computing the square root of the sum of squared distances between two centred (CTR superimposed) and normalized (CTR size = 1), and optimally rotated, configurations of landmarks using the program tpsSmall to compare the landmarks among multispecimen groups.
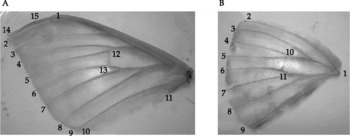
Wing span of the forewing was measured from tip to tip using a graduated measuring scale (mm) and the area of fore- and hindwings was calculated using scalene triangle formula of three sides of the wing. The tps series of the program was used to perform the numerical and geometric analyses of the x, y co-ordinates of landmarks. For landmark analysis, 15 and 11 landmarks were selected on the fore- and hindwings, respectively, for both sexes in all the groups (Fig. 2A and B). The landmarks were labelled in forewings at the apical end of the veins as costa (C-1), subcosta (Sc-15), radius (R1-14, R4-2, R5-3), media (M1-4, M2-5, M3-6), cubitus (Cu1-7, Cu2-8), anal (An1-9, An2-10, An3-11) and median cross vein (Mc-12,13), and in the case of hindwings the humeral angle-1, Sc+R1-2, M1-3, M2-4, M3-5, Cu1-6, Cu2-7, An1-8, An2-9 and Mc-10,11 using the tpsDig program as dots on the wing images.
A, landmarks in forewing (C-1, Sc-15, R1-14, R4-2, R5-3, M1-4, M2-5, M3-6, Cu1-7, Cu2-8, An1-9, An2-10, An3-11 and Mc-12,13). B, landmarks in hindwing (Humeral angle-1, Sc+R1-2, M1-3, M2-4, M3-5, Cu1-6, Cu2-7, An1-8, An2-9 and Mc-10,11).

The relative warp analysis was conducted to explore shape variability within the species. This was calculated from the consensus data of landmark of fore- and hindwings of each morph for both sexes using the tpsRelw program. To visualize the variation among specimens, thin-plate spline (TPS) grid was drawn with the tpsSplin program.
All morphometric data were analysed using ANOVA, with the means separated using the Student-Newman-Keuls procedure at 5% level of significance.
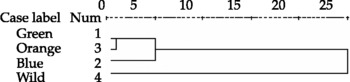
A cluster analysis, using the unequal group, was performed in proximity matrix with squared Euclidian distance in dissimilarity matrix. The cluster produced dendrogram (hierarchical tree), using ward method, to depict hierarchically the venation differences among colour morphs and wild counterparts using the tpsTree program.
Results
Venation
The venation pattern of A. assamensis revealed the presence of the principal veins recorded in saturniids with few exceptions. The veins of the forewing are C, Sc, R1, R4 and R5, media (M1, M2 and M3), Cu1 and Cu2, An1 and An2 and Mc. In addition to these, A. assamensis possesses the third anal vein (An3) and a sub-vein, which has been denoted as a weak base of media (A1 and B1) in both male and female and which is quite unusual in saturniids (Fig. 1A). In the hindwing, R1+Sc merged, R5, M1, M2 and M3, Cu1 and Cu2 and Mc are present, whereas R4 and An3 are absent. The weak bases of media (A1 and B1) and An1 sub-veins are indistinct compared with the other principal veins in both the wings of males and females (Fig. 1B).
The wing venation of A. assamensis has many common features with Antheraea frithi (Moore) except a Mc and anal vein An3 (Jolly et al., Reference Jolly, Narashimhana and Sen1974).
The venations of forewing are more prominent in male than female forewings in all cases. Also the weak bases of media A1 and B1 join with M2 and M3 veins, but do not touch the Mc. The Mc vein is straight and has an angle towards the axillary region in all others than the orange morph. In the orange morph, instead of continuous Mc, a groove-like extension is observed in the M2 and M3 veins. All the veins, especially An3 and Mc, are well developed in the wild morphs.
It was observed that the cross veins of hindwings are more prominent than in the forewings in all specimens. The A1 and B1 weak bases of media remain the same as in the forewing.
Contrary to the venation pattern described by Richards and Davies (Reference Richards and Davies1977), the Sc and M veins of the forewing are convex, whereas Cu2 and An3 are concave (Fig. 1A) in all cases. In the hindwing, except Cu2, all other veins are convex (Fig. 1B). There is no variation of curvature of vein among the study material.
Morphometrics
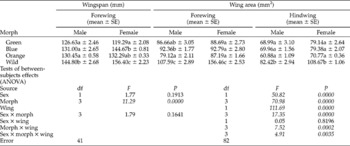
The results of wingspan and average area are shown in Table 1. The female wing is usually bigger than the male in all the morphs. However, the wild morphs have the highest wingspan and area, followed by the blue morph (Table 1). The orange morph had the least wing area. The mean wingspans of the morphs vary significantly, but there is no difference between the sexes. The wing area varies significantly between sex, morphs and wing areas. The interaction effect of sex and morph, as well as morph and wing are significant (Table 1).
Wing measurement of male and female moths (n=20; tests of between-subjects effects: ANOVA)

Mean values in each column having the same letter are not significantly different at 5% level of significance using the Student-Newman-Keuls (SNK) means separation method. Significant effects are marked in italics in the ANOVA table.
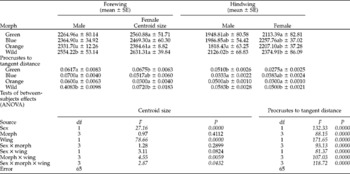
The mean CTR size and PT distance of the fore- and hindwings of the wild morphs show the highest values followed by the blue morph, while the least CTR size and PT distance were observed in orange morphs. The result of the ANOVA for CTR size revealed significant variation in sex and wing areas, while all effects were significant for PT distance (Table 2).
Centroid size and procrustes to tangent distance of Antheraea assamaensis morphs (n=20; tests of between-subjects effects: ANOVA)

Mean values in each column having the same letter are not significantly different at 5% level of significance using the Student-Newman-Keuls (SNK) means separation method. Significant effects are marked in italics in the ANOVA table.
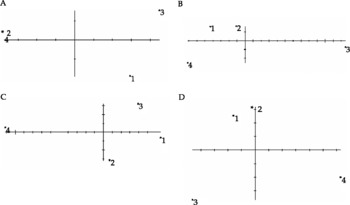
Results of the analysis of relative warp are shown in Fig. 3, with the numbers 1, 2, 3 and 4 representing green, blue, orange and wild, respectively. In the relative warp analysis of the forewing of males, 2 and 4 are situated closely, widely separated from 3 and 1. In the female forewing, 1 and 2 are closely situated. In case of the hindwing of male and female, 1 and 2 are also relatively close.
Relative warp scores: A, male forewing; B, female forewing; C, male hindwing and; D, female hindwing. 1, 2, 3 and 4 indicate green, blue, orange and wild morphs, respectively.

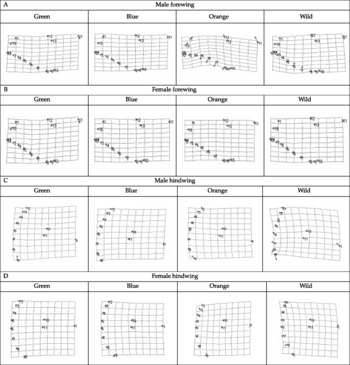
The TPS analyses of the samples are shown in Fig. 4. The TPS of males and females' reference configurations (or mean wing shape) were studied. From these grids, a better indication was obtained of which landmarks are responsible for the variation among the morphs. In the forewing of wild males, landmarks 1, 15 (Sc and R1), 12, 13 (the position of Mc) and 9, 10, 11 (position of An1, An2 and An3) are separated from others. However, no significant variation was observed in the forewing of females. The position 1 (base) and 9 (An2) of the hindwing of wild males differ significantly from those of other morphs (Fig. 4C).
A, male forewing; B, female forewing; C, male hindwing and; D, female hindwing. The grids show the thin-plate spline transformation from the starting from (†) to the estimated configuration (o). The estimated shape at the root of the tree is used as the starting form.

Discussion
Contrary to Arora and Gupta's (Reference Arora and Gupta1979) description, sub-vein (A1, B1) and an anal vein (An1) were observed in the present investigation. In the forewing, R1 is stalked with R4 and R5 and they run parallel with very narrow distance as reported in other Antheraean species (Arora and Gupta, Reference Arora and Gupta1979). Irrespective of morph, the Mc vein is straight but wavy in other Antheraean species and does not touch the bases of media A1 and B1. It is indicative that A. assamensis is the ancestral stock and the other species have evolved through chromosomal fission (Rangaswami et al., Reference Rangaswami, Narashimhana, Kashibiswanathan, Sastry and Jolly1976). Remarkably, the venation system, especially the anal vein (An2 and An3), is more prominent and stronger in wild morphs (irrespective of sexes) than in the domesticated ones. This may be correlated to the greater flying capacity of wild morphs, which are known as active flyers than the semi-domesticated colour morphs (Rangaswami et al., Reference Rangaswami, Narashimhana, Kashibiswanathan, Sastry and Jolly1976). Despite the variations in venation, venation characters, however, can be useful. Branching point positions generally seem to be of little value, but the presence or absence of certain veins may be significant as evident in Elachistidae (Albrecht and Kalia, Reference Albrecht and Kalia1997).
Evidence shows that in some cases one longitudinal vein might be modified into cross veins such as in some species of Mycetophilidae (Diptera), one longitudinal vein is shortened and acquires the appearance of a cross vein. However, De Celis and Fernando (2003) suggested that the existence of a class of genes dedicated to the formulations of cross veins implies a clear developmental separation between the cross veins in these structures during evolution.
Curvature is a character to determine the characteristics of wing venation. Coding of branching point is difficult when distances and relative position are concerned. This is particularly evident when more than one point is involved. The variation may be caused by the shift of the point involved or any combination of shifts.
The overall landmark data of male and female moths revealed that the wild morphs differ from the semi-domesticated ones. The highest level of variation occurs in the forewing of males. This is due to the presence of An3 vein, which implies genetic variability (Rangaswami et al., Reference Rangaswami, Narashimhana, Kashibiswanathan, Sastry and Jolly1976). In case of the female hindwing, it is observed that the blue colour morph is closer to the wild ones. Evidence shows that the blue colour morph has bigger wingspan next to the wild morphs, possibly due to the fact that the blue colour morph habitat in the hilly region is closer to the wild populations that facilitate interbreeding naturally.
Relative warp analysis was conducted to explore shape variability within the dataset. Plotting of relative warps' scores produced a set of graphical representations of shape variability within the sample in two axis of variation. The relative warp scores of forewings of males confirm the closeness of blue and wild, suggesting that the blue morph shares a strong genetic link with wild ones. In case of the female forewing, green and blue are closer to wild, whereas the orange morph is isolated. Hindwing of both sexes also shows the same pattern of relationship between the morphs.
To visualize the deviation of wing shape, the TPS transformation grid was used to estimate the shape variation comparing with the consensus of respective wings (Fig. 4). In male forewing, anal vein landmark deviations occur especially in the An3 point. On the other hand, the coastal and Mc also deviate from each other. This is probably due to the sharp, falcate apex of the forewing. No significant variation was observed in the female forewing. Basal area plays a vital role in landmark studies. Due to the shape differentiation in wild moth, the landmark shows marked deviation in the base and An2 veins. It indicates that the venation pattern is also dependent on the curvature of the wing base point towards the anal region. The radial margin expands convexly in wild, whereas in the orange morphs it expanded concavely.
The decomposition of shape variation into uniform and non-uniform components through geometrical analysis of landmark data takes into account the configuration of the sample data points, and can describe and locate differences of forms in organisms more efficiently than multivariate analysis of traditional distance measurements. This approach has been shown to yield the most rewarding information in insect eco-morphological studies (Harbach and Kitching, Reference Harbach and Kitching1998). The results of the cluster analysis (Fig. 5) confirm that there are close similarities between orange and green, while the blue morph is an intermediate group. However, wild morphs have no close similarity with any other colour morphs.
TPS tree dendrogram showing hierarchical cluster analysis.

The relationship between morphology and ecology in insects and other organisms has long been known, and a few studies have applied multivariate morphometric methods to investigate eco-morphological patterns (Hughes and Vogler Reference Hughes and Vogler2004). Problems arise with the different morphotypes of A. assamensis because it has minor subjective morphological differences, and it has not been based on quantitative analyses but only on subjective visual comparisons. Similar cases were examined by Fibiger (Reference Fibiger1990) on European Euxoa tritici L. (Noctuidae) having differences in wing patterns. Wing patterns vary substantially and are commonly susceptible to both geographical and local variations in E. cursoria where external features overlap with E. tritici (Fibiger, Reference Fibiger1990).
The variation of wing venation observed in this study confirms the results obtained in other Lepidopteran species, for example among the Elachistidae (Albrecht and Kalia, Reference Albrecht and Kalia1997), and some species of Gelechioidea, Nymphalidae and Arctiidae where they display the asymmetric pattern in the individuals as well as considerable intraspecific variation in wing venation (Warren, Reference Warren1936; Sotavolta, Reference Sotavolta1964). However, wing venation characters subject to the same kind of variation as discussed here still play an important part in classification.
The primary objective of this study was to examine variation among A. assamensis morphs. The result suggests interesting conclusions about patterns of variation. They provide evidence for two kinds of architectural constraints on wing morphology such as a strong pattern of allometric size variation and a pattern of increasing variability from anterior to posterior along the wings. These two patterns have been defined in this study, but the fact may be biologically correlated.
From the present study, we observe that irrespective of individual morphs, sexual dimorphism is evident in A. assamensis. This suggests that both sexes should not be combined in such type of analysis because small-scale differences may influence the results since subtle shape differences exist between the sexes.
Irrespective of sexes, the venation pattern, including longitudinal and cross vein, is prominent in wild morphs. The thickness of veins or width determines the number of cells forming the veins. Many variations or irregularities of vein thickening may exist in the same wing or the same vein in different species. It is likely that modification in veins' thickness results from changes in the efficiency of lateral inhibition between vein cells, as this is the mechanism determining vein width in Drosophila (Diptera:) (De Celis, Reference De Celis1997). The same may happen in wild morphs also. The intraspecific variation of vein was well established in Elachistidae (Albrecht and Kalia, Reference Albrecht and Kalia1997). It should be noted that the same variation is observed in A. assamensis, especially in analysis of relative branching point's position. From this study, it is indicative that the bivoltine/univoltine wild morph has some genetical variation from others. This suggests that in the process of evolution, the wild counterparts have strong and direct genetic links with green and blue morphs. However, further studies are required to correlate other genetic traits such as genitalia or DNA fingerprinting for confirmation.
Acknowledgements
R. Nath would like to acknowledge the grants provided by the University Grants Commission, India, and thanks the Principal Dr S. K. Dutta of Dhing College in Assam. We are thankful to the Department of Sericulture, Government of Assam and Central Silk Board, Guwahati, for helping in the collection of materials. We duly thank Mr N. Bhagawati for helping in statistical analysis. Thanks are also due to the Director Professor J. Chutia, IASST, Guwahati, for providing laboratory facilities for this work.