
Introduction
Surface plasmon resonance-enhanced light transmission through metallic nanohole arrays was first observed in 1998 and was named transmission surface plasmon resonance (TSPR).[Reference Ebbesen, Lezec, Ghaemi, Thio and Wolff1] The TSPR phenomenon was also observed using a gold-coated diffraction grating.[Reference Lertvachirapaiboon, Baba, Ekgasit, Shinbo, Kato and Kaneko2–Reference Maurer, Nicolas, Lévêque, Subramanian, Proust, Béal, Schuermans, Vilcot, Herro, Kazan, Plain, Boukherroub, Akjouj, Djafari-Rouhani, Adam and Szunerits14] The plasmonic nanohole arrays[Reference Ebbesen, Lezec, Ghaemi, Thio and Wolff1, Reference Thio, Ghaemi, Lezec, Wolff and Ebbesen15–Reference Zhang, Wang, Wong, Liu, Zhou and Liedberg24] and plasmonic grating[Reference Lertvachirapaiboon, Baba, Ekgasit, Shinbo, Kato and Kaneko2–Reference Maurer, Nicolas, Lévêque, Subramanian, Proust, Béal, Schuermans, Vilcot, Herro, Kazan, Plain, Boukherroub, Akjouj, Djafari-Rouhani, Adam and Szunerits14] showed narrow transmission peaks and could be tuned over a wide wavelength range (visible to near-infrared). TSPR excitation is highly sensitive to local dielectric conditions at the metal interface and the grating momentum wave vector.[Reference Yeh, Kleingartner and Hillier5, Reference Yeh, Petefish and Hillier6] TSPR measurements have many advantages over conventional SPR techniques; for example, since the TSPR optical signal contains no optical noise originating from reflected light, distinctive TSPR peaks and dominant bright spots on a dark background indicated enhanced transmitted light and an improved signal-to-noise ratio.[Reference Lertvachirapaiboon, Baba, Ekgasit, Shinbo, Kato and Kaneko2, Reference Escobedo20–Reference Song, Wong, Guo, Deng, Tan, Gorelik and Zhou22] The TSPR phenomenon has been investigated using imaging techniques.[Reference Yeh, Kleingartner and Hillier5–Reference Yeh and Hillier7, Reference Lertvachirapaiboon, Baba, Ekgasit, Shinbo, Kato and Kaneko13, Reference Im, Lesuffleur, Lindquist and Oh18, Reference Im, Lee, Wittenberg, Johnson, Lindquist, Nagpal, Norris and Oh19] Im et al. demonstrated that the transmitted intensity originating from plasmonic nanohole arrays depended on their periodicity.[Reference Im, Lesuffleur, Lindquist and Oh18] A substrate of plasmonic nanohole arrays was coupled with a parallel microfluidic channel for protein microarray applications. A TSPR technique involving metallic nanoslit and nanohole arrays could be combined with a smartphone to record TSPR images (TSPRis).[Reference Cetin, Coskun, Galarreta, Huang, Herman, Ozcan and Altug25–Reference Wang, Chang, Lin, Gartia and Liu27] In 2016, Lee et al. developed plasmonic biochips containing metallic nanoslit arrays for rapid label-free pesticide detection using a smartphone.[Reference Lee, You, Tsai, Lin, Hsieh, Ho, Hsu and Wei26] The sensitivity change in the optical transmitted signal was dependent on the pesticide concentration and could be recorded with a smartphone camera. By recording images and appropriately evaluating the signal, the technique could be used for pesticide detection with a detection limit of 1 ppb. Furthermore, this technique provides a simple detection protocol, is portable and label-free, and requires no expensive instruments.
Recently, our group successfully developed a TSPR imaging technique using grating-structured thin gold films with a white light source. The TSPRi was detected with a scientific complementary metal-oxide-semiconductor (sCMOS) camera with liquid crystal tunable filters (LCTFs).[Reference Lertvachirapaiboon, Baba, Ekgasit, Shinbo, Kato and Kaneko13] This system was used for hydrogen peroxide detection. In this work, a plasmonic grating substrate with a TSPR excitation wavelength corresponding to the detection range of a smartphone camera was developed. To monitor TSPR and transmission images produced with the developed TSPR substrate at a specific wavelength, incident white light was passed through the LCTFs prior to recording images with a smartphone camera. This work focused especially on acquiring a TSPRi at the specific TSPR excitation wavelength of the plasmonic grating structure. The unique TSPR characteristics provided by the plasmonic grating structure combined with our developed optical setup for obtaining a TSPRi with a smartphone camera showed distinctive results. To acquire the sensitivity of this novel system, the systematical change of refractive of environment using different concentrations of ethylene glycol (EG) solutions was investigated. Simultaneous injection EG solutions with different concentrations into a microchannel attached to the substrate gave a sensitivity of 282/RIU. The TSPRi detected with the smartphone camera showed high potential with respect to further development of portable sensing devices.
Experimental section
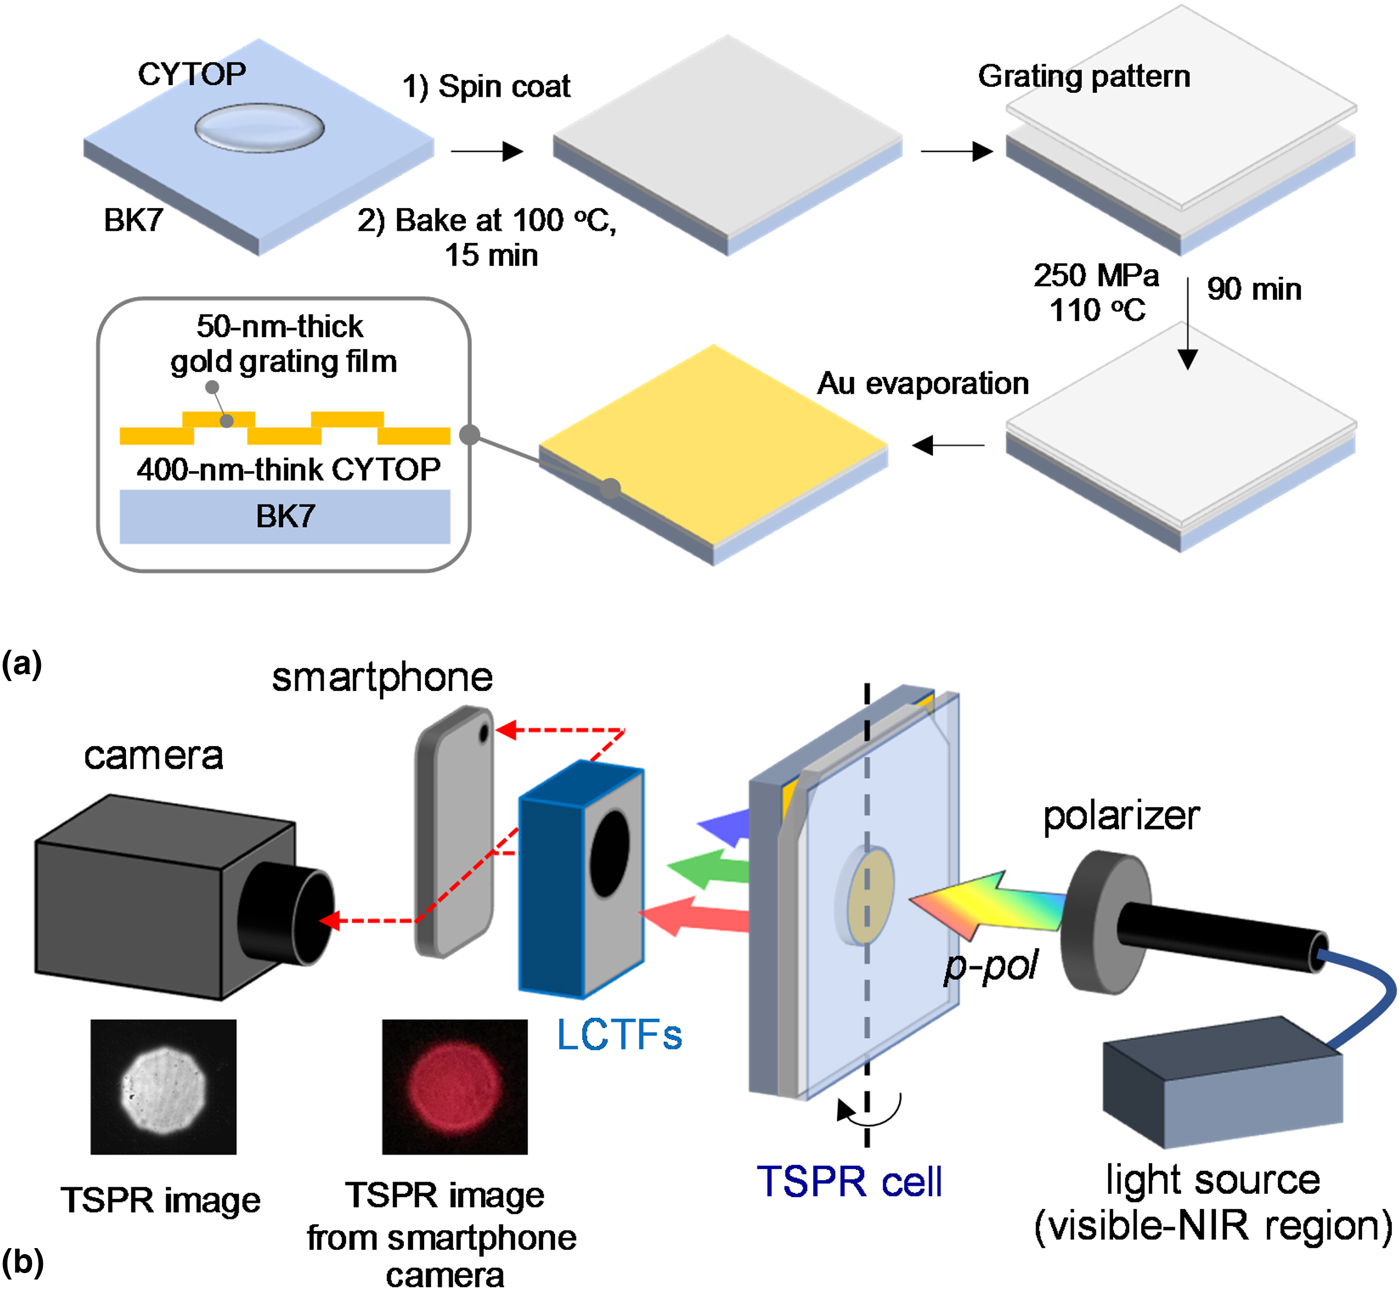
A CYTOP solution (CT809M, AGC Chemicals, Japan) was spin coated on a BK7 glass slide at 1500 rpm for 10 s and then at 3000 rpm for 30 s. The BK7 glass slide with CYTOP film was kept in an oven at 100 °C for 15 min to evaporate the solvent. An imprinted grating pattern was formed by compressing a plastic grating substrate with a grating pitch size of 740 nm on a CYTOP film under a pressure of 250 MPa at a temperature of 110 °C for 60 min. The substrate was kept under high pressure for a further 30 min. A gold film with a thickness of approximately 50 nm was deposited by vacuum evaporation on a CYTOP grating/glass slide substrate. The dimensions of gold film on the substrate are 0.5 cm in width and 2.0 cm in length. Figure 1(a) shows a schematic representation of the substrate fabrication process.
(a) Schematic representation of TSPR substrate fabricated for smartphone camera detection. (b) Schematic representation of the experimental setup for TSPRi detection with sCMOS and smartphone cameras.

TSPR spectra were obtained from a home-made TSPR system equipped with a fiber-optic spectrometer (HR4000, Ocean Optics) and a white light source (LS-1 Tungsten Halogen, Ocean Optics). The substrates were mounted on a rotation stage. White light was passed through a linear polarizer, and the TSPR signals were then detected by the fiber-optic spectrometer. For TSPRi acquisition, a camera (Zyla 5.5 sCMOS, Andor) with LCTFs was used instead of a spectrometer. The camera exposure time was fixed at 0.02 s. For TSPRi detection with a smartphone camera, an iPod Touch attached to a plano-convex lens made from glass with a diameter of 9 mm was used instead of a camera. The images recorded with the smartphone camera were subsequently converted to 8-bit images for measuring gray values using ImageJ software. The correlation results between the signals acquired from sCMOS detector and iPod Tough camera were obtained from the same detection area of around 5 mm in diameter, which corresponded to 125 and 75 pixels for sCMOS detector and iPod Touch camera, respectively. For the sensing test, the developed substrate was attached to a four-channel microfluidic cell. The dimensions of each channel were 1.0 mm in width, which corresponded to 15 pixels of iPod Touch camera, 10.0 mm in length, and 0.2 mm in depth, and the length of the pitch was 3.0 mm. The different concentrations of EG aqueous solutions were employed to systematically change the environmental refractive index from 1.35 to 1.41 for the study of TSPR phenomenon and to acquire the sensitivity of this technique. All microchannels were filled with water and a TSPRi was recorded as a reference. EG solutions of different concentrations were simultaneously injected into the microchannels, and a TSPRi of each microchannel was recorded. The ΔTSPRi intensities were then investigated to calculate the sensitivity of this technique. Figure 1(b) shows a schematic representation of the experimental setup for TSPRi detection with a sCMOS detector and smartphone camera. Typical TSPRs obtained with the sCMOS detector and smartphone camera are also shown in this figure.
Results and discussion
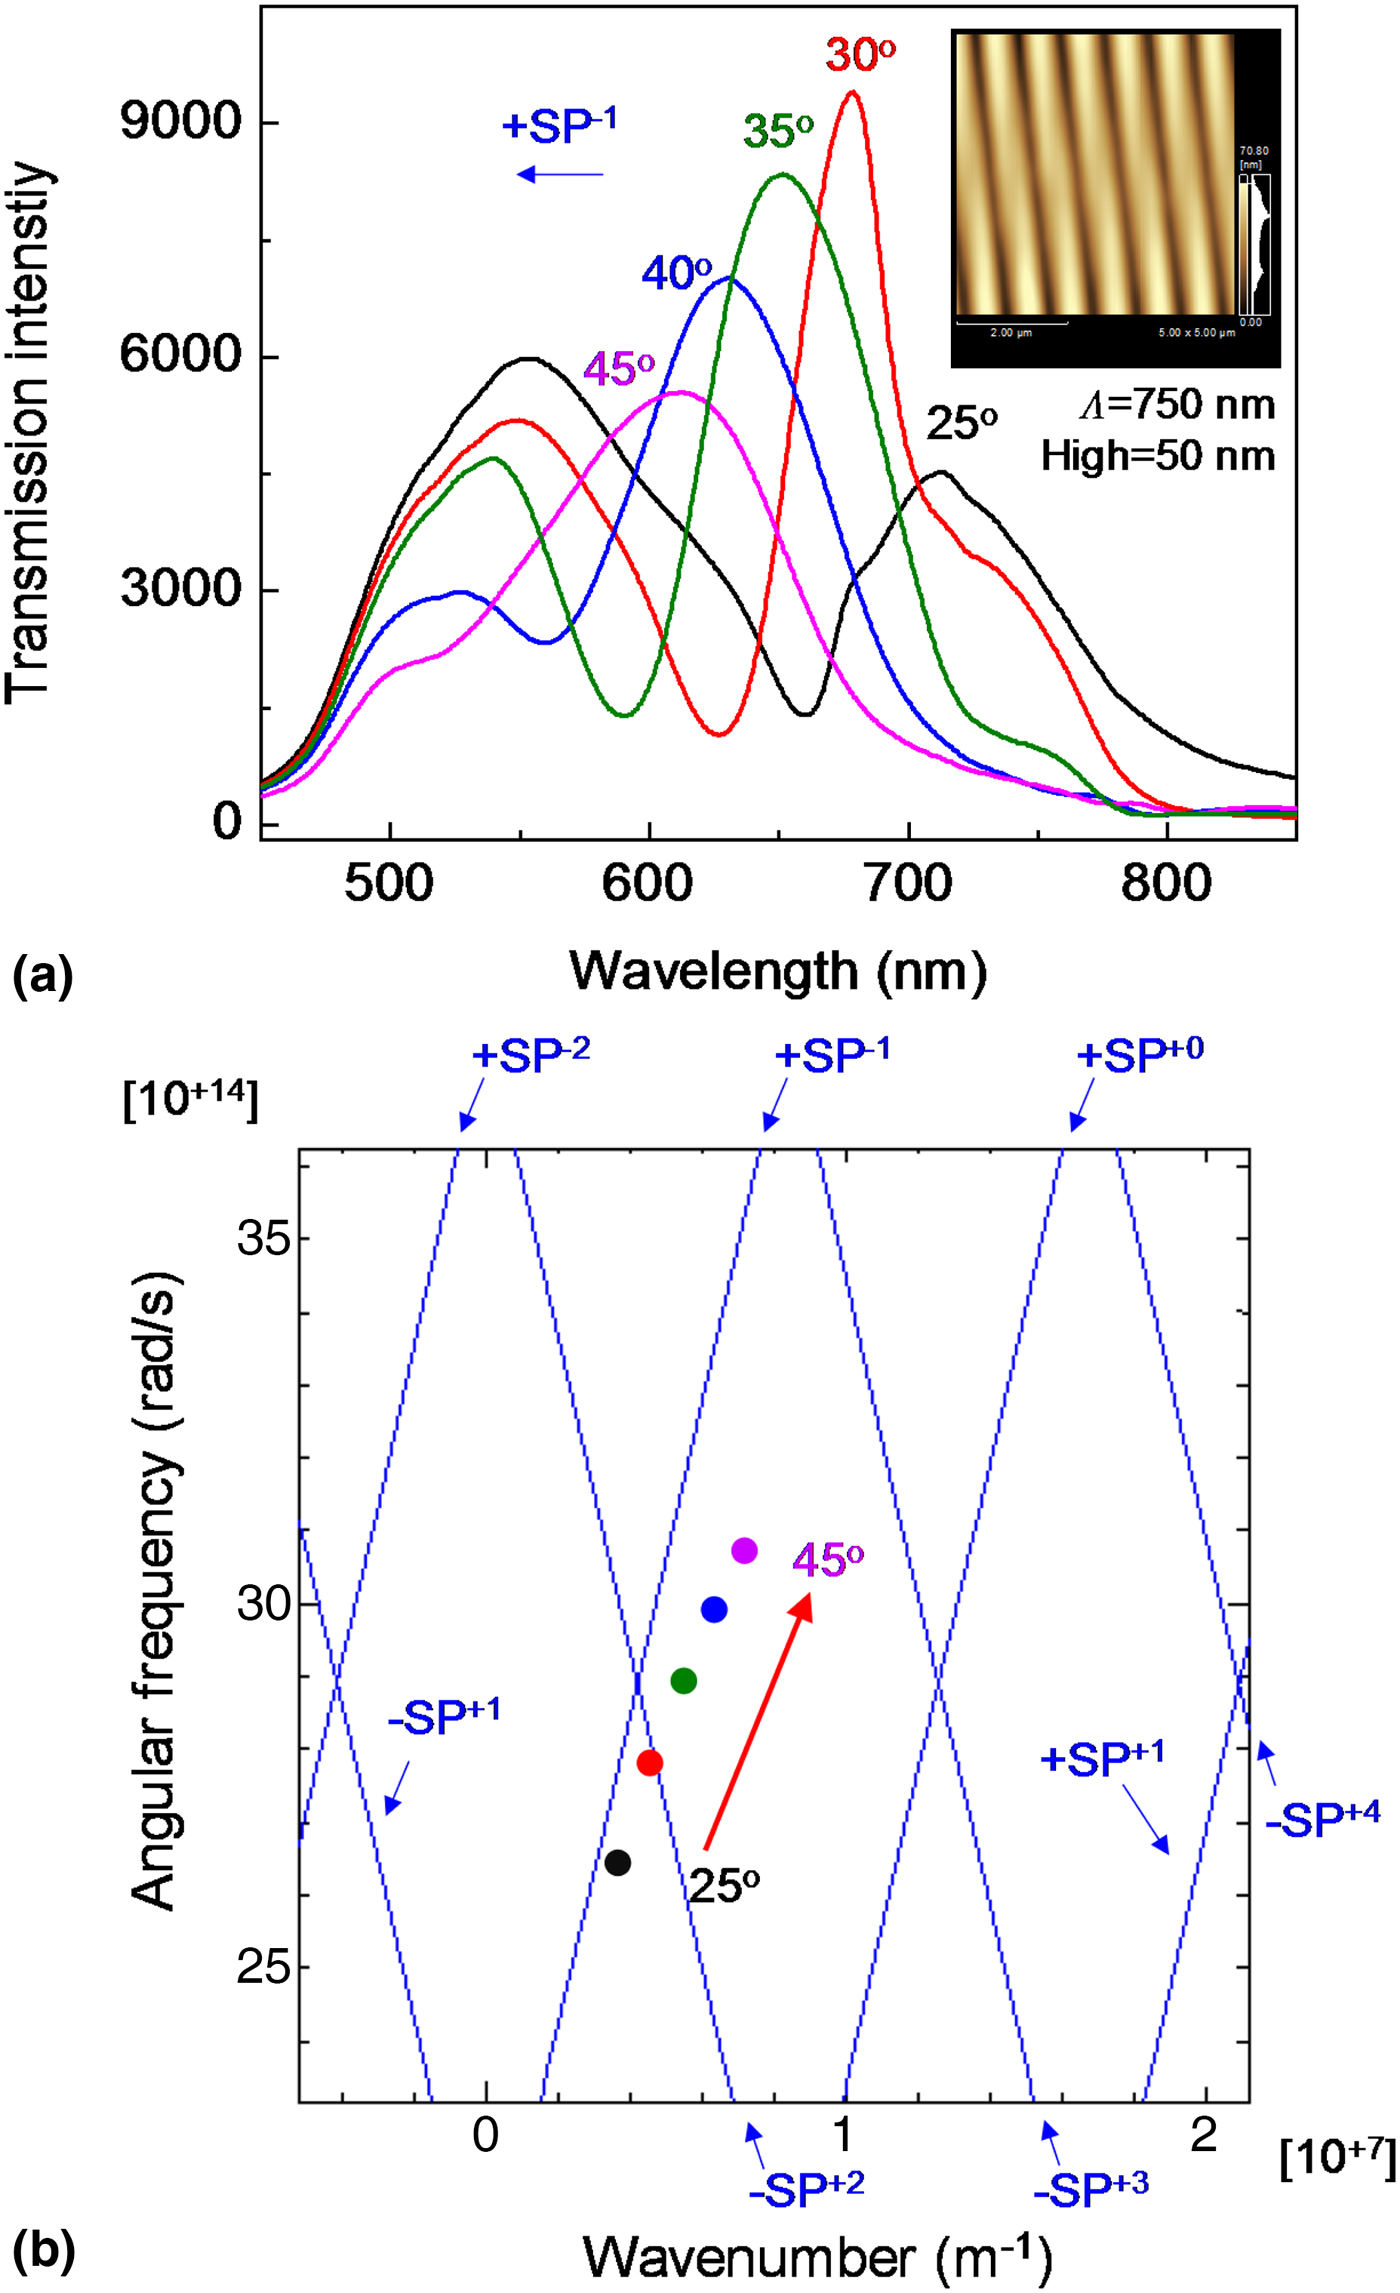
TSPR spectra of a 50 nm-thick gold-coated CYTOP grating/glass slide substrate (with a grating pitch of ~750 nm and a grating height of 50 nm, as shown in the AFM image in the inset of Fig. 2; the total thickness of the gold-coated CYTOP grating film is shown in Supplementary Fig. S1) were recorded at incident light angles of 25–45°, at TSPR excitation wavelengths between 550 and 750 nm, and the signals were recorded in an aqueous environment, as shown in Fig. 2. At an incident light angle of 25°, a TSPR peak was observed at 715 nm. The TSPR peaks shifted toward shorter wavelengths when the incident light angle was increased from 25° to 45°. The shift in the TSPR peak of the substrate corresponded to a surface plasmon mode of −1 (+SP−1) as shown in Fig. 2(b).[Reference Baba, Kanda, Ohno, Ohdaira, Shinbo, Kato and Kaneko28–Reference Shinbo, Takizawa, Obata, Lertvachirapaiboon, Baba, Kato and Kaneko31] A CYTOP has a dielectric function close to water, which we use as a medium.[Reference Shinbo, Takizawa, Obata, Lertvachirapaiboon, Baba, Kato and Kaneko31, Reference Hassan, Khodami, Tait and Berini32] Moreover, this substrate enabled us to record a TSPRi with a camera, including a smartphone camera. There are two main reasons why a conventional gold-coated polycarbonate substrate (polycarbonate/gold/water system) cannot be used in this work. Firstly, the conventional substrate mainly produces TSPR signals in the near-infrared region (−SP+2 mode), which cannot be detected by a smartphone camera. Secondly, the TSPR signals (+SP−1 mode) in the visible light region originate from the gold/polycarbonate interface, which cannot be used for sensing, as confirmed by the TSPR spectra of conventional substrates and the experimental and calculated SP dispersion results shown in Supplementary Fig. S2.
(a) TSPR spectra of gold-coated CYTOP grating/glass slide substrate at incident light angles from 25° to 45°. Inset shows AFM image of the substrate. The experimental TSPR spectra were recorded in an aqueous environment. (b) The experimental (dot plots) and calculated (blue solid lines) results of SP dispersion of TSPR substrate.

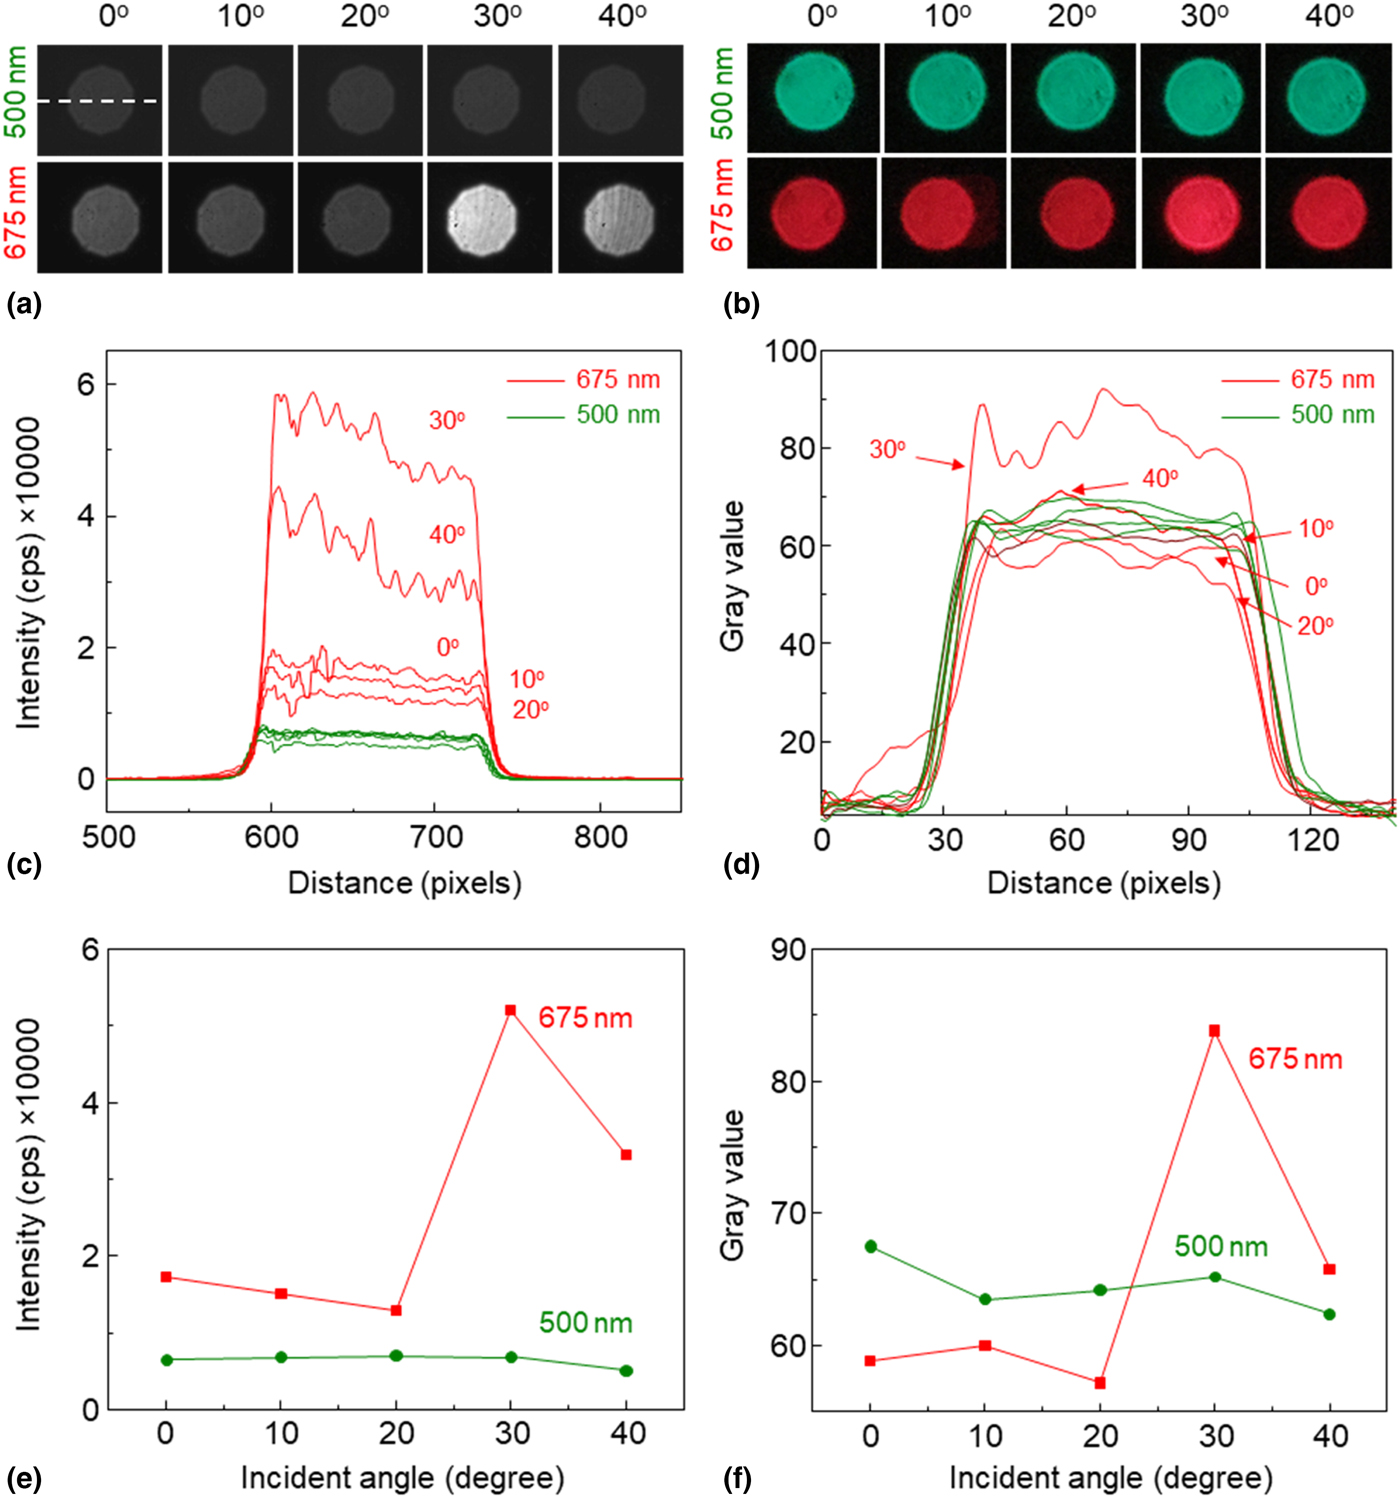
The TSPRs and corresponding TSPR signals detected with the sCMOS detector at 675 nm are shown in Figs. 3(a) and 3(c) (red lines), respectively. The sensitivity change in the TSPR intensity was observed at a wavelength of 675 nm when the incident light angle changed. The strongest TSPR signal, represented by the brightest TSPRi, was observed at an incident light angle of 30° [Figs. 3(a), 3(c), and 3(e)]. The decrease in the TSPR intensity at an incident light angle of 40° was due to the shift in the TSPR peak to a shorter wavelength, as shown in the TSPR spectra in Fig. 2. At an observable wavelength of 500 nm (without TSPR), the signals were not sensitive to the incident light angle, and only insignificant changes in transmission intensities were observed, as shown in the transmission images and green lines in Figs. 3(a) and 3(c), respectively. Intensity plots as a function of the incident light angle at observable wavelengths of 675 (red line) and 500 nm (green line) are shown in Fig. 3(e). The TSPR intensity of the gold-coated CYTOP grating/glass slide substrate at an incident light angle of 30° was higher than the transmitted intensity at 500 nm (without TSPR) by 7.6 times. Corresponding results were obtained with a smartphone camera. The most vivid red color of the TSPRi and the strongest TSPR intensity obtained from the substrate were observed at a wavelength of 675 nm and an incident light angle of 30°, as shown in Figs. 3(b) and 3(d), respectively. At 500 nm, the transmission images were green and were not sensitive to the incident light angle, as shown in Fig. 3(b). The TSPRi intensity obtained with the smartphone camera was up to 1.5 times higher than that of the conventional transmitted signals, as shown in Fig. 3(f). The transmitted intensities at the observable wavelength of 675 nm were similar to those at 500 nm because the images were converted to grayscale, which represented the average values of red, green, and blue [(red + green + blue)/3]. Nevertheless, the TSPRi and TSPRi intensity (at a wavelength of 675 nm and an incident light angle of 30°) were different from the conventional transmitted signal.
Transmission images and corresponding intensities detected by (a, c) sCMOS detector and (b, d) smartphone camera. The TSPRi intensities in these experiments were measured at the horizontal center lines of transmission images, as indicated by a dashed line in (a). Transmitted intensity plot as a function of the incident light angle at wavelengths of 500 and 675 nm detected by (e) sCMOS detector and (f) smartphone camera. The signals were recorded in an aqueous environment.

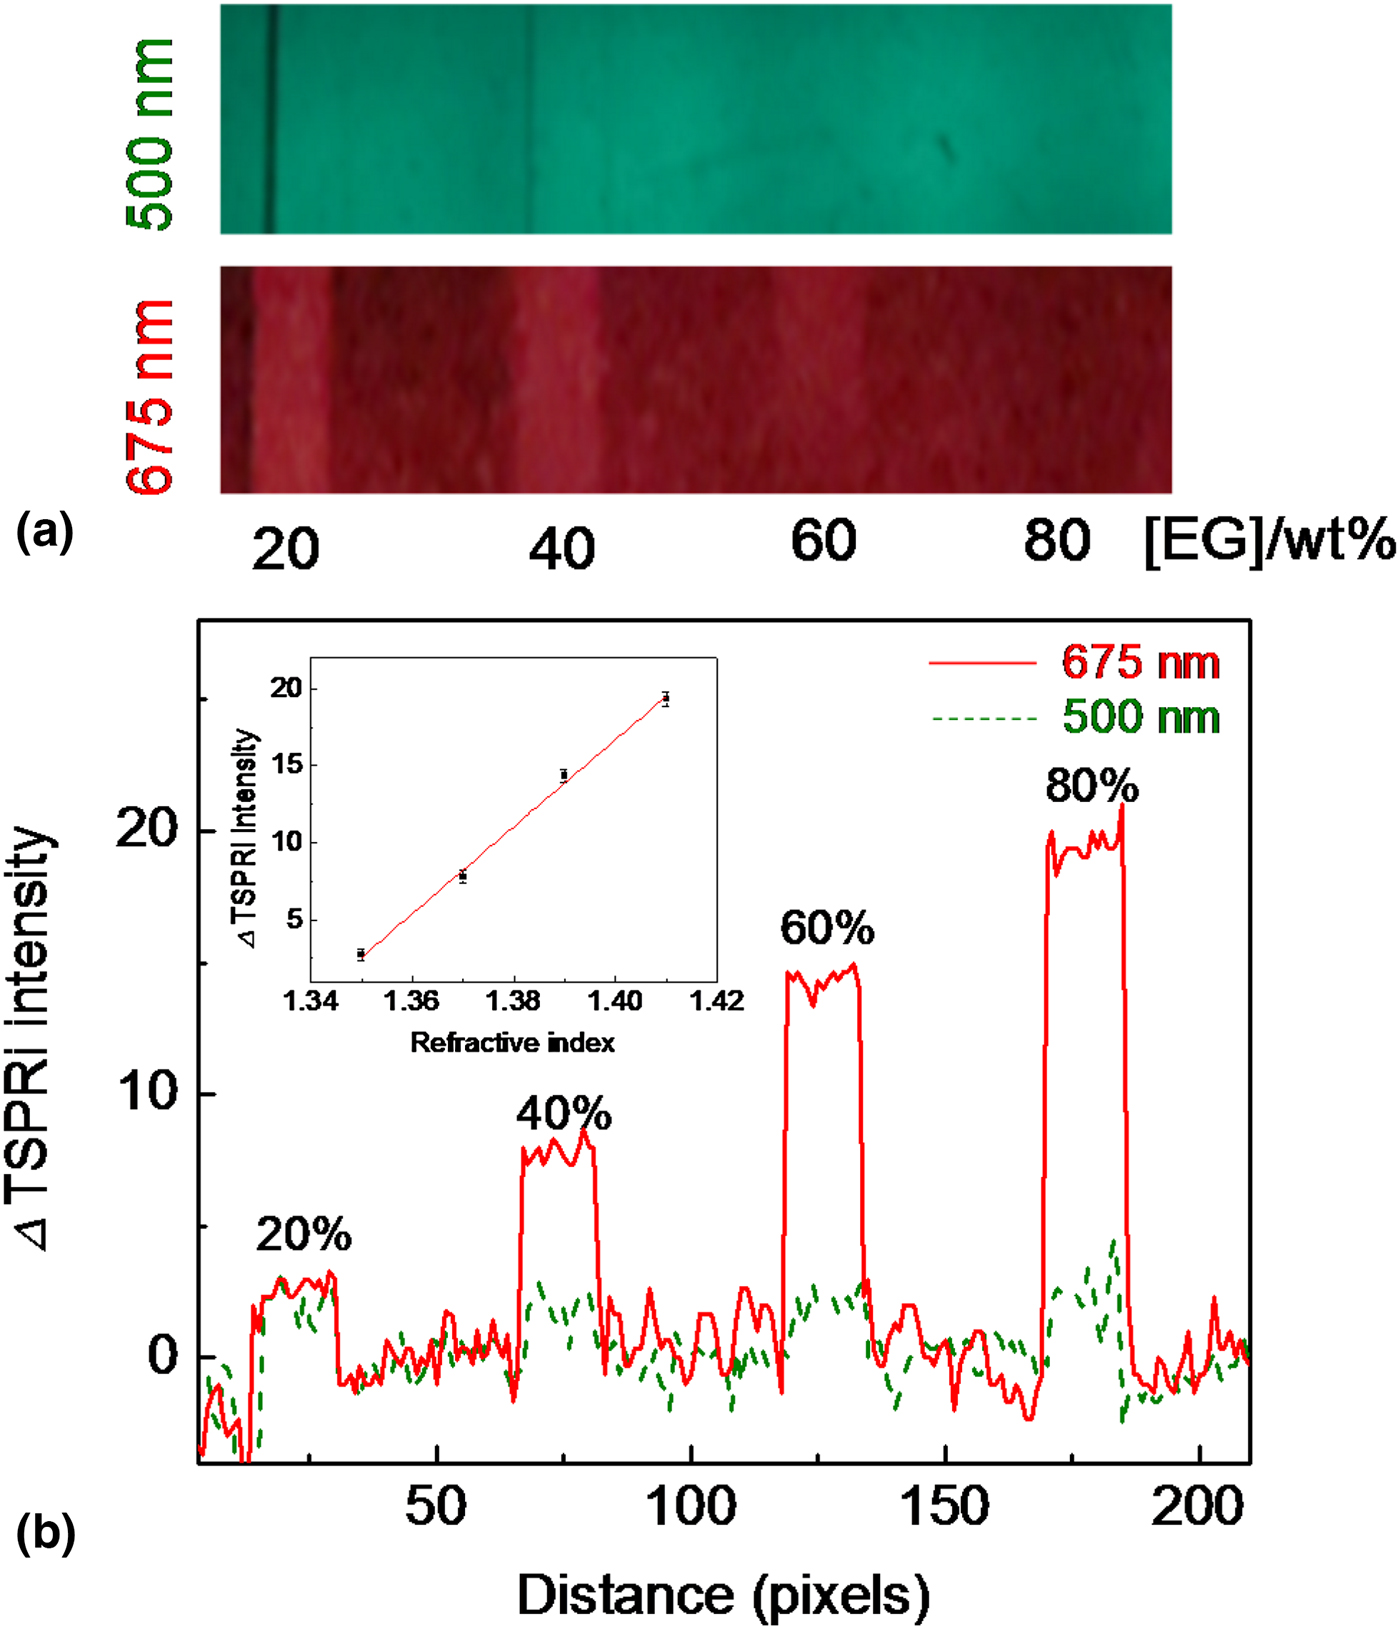
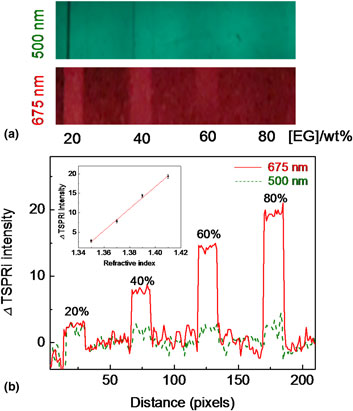
To further investigate the sensitivity of the technique with the smartphone, the excitation wavelength and the incident light angle of the experimental setup were fixed at 675 nm and 30° for TSPRi acquisition. The developed substrate was attached to a four-channel microfluidic cell. All microchannels were filled with water and a TSPRi was recorded as a reference. Different concentrations of EG solutions were subsequently injected into the microchannel. EG solutions with concentrations of 20, 40, 60, and 80 wt.% were employed in this experiment. A TSPRi of the substrate at an excitation wavelength of 675 nm was obtained for each concentration of EG solution. TSPRs obtained while injecting different concentrations of EG solutions at an excitation wavelength of 675 nm are shown in the lower image of Fig. 4(a). A conventional transmission image without SP excitation, which was recorded at a wavelength of 500 nm, is shown in the upper image of Fig. 4(a). At different concentrations of EG solutions, the TSPRi showed significant differences in brightness, whereas only insignificant changes in the brightness of conventional transmission images were observed. As the TSPRi intensity change was directly related to the refractive index change, a typical quantitative analysis determined the difference between the TSPRi intensity (ΔTSPRi) of the substrate in water and that of the substrate in EG solution (TSPRi[water] − TSPRi[EG]). When the EG concentration was increased, a systematic increase in ΔTSPRi intensity was observed, as shown in Fig. 4(b). The average ΔTSPRi intensities of the substrate from channels with concentrations of 20, 40, 60, and 80 wt.% were 2.70, 7.82, 14.35, and 19.35, respectively (TSPR intensities from at least 15 pixels were averaged). To calibrate the sensor sensitivity, the ΔTSPRi intensity was plotted as a function of the refractive index of the EG solution (the EG concentration range that we used corresponded to refractive indices ranging from 1.35 to 1.41),[Reference Fogg, Hixson and Thompson33] as shown in the inset of Fig. 4(b). The sensitivity obtained from the slope of the calibration curve was 282/RIU. These promising results strongly indicated that the TSPR imaging technique employing a smartphone camera can be exploited in sensor applications.
(a) TSPR images of substrate developed while injecting different concentrations of EG. (b) ΔTSPRi intensity (TSPRi[water] − TSPRi[EG]) of different concentrations of EG solutions. Red solid and green dashed lines in (b) are ΔTSPRi intensities at wavelengths of 500 and 675 nm, respectively. Inset shows a typical calibration plot of the ΔTSPRi intensity versus the refractive index of EG solutions.

Conclusions
We successfully developed a TSPR substrate that provided TSPR excitation in the visible light region. The correlation between the TSPR spectra and corresponding TSPRs detected with a sCMOS detector and smartphone camera were observed. A smartphone camera was capable of detecting changes in the refractive index of an environment. This technique shows high potential with respect to further development of portable sensing devices using a smartphone camera as a detector.
Supplementary material
The supplementary material for this article can be found at https://doi.org/10.1557/mrc.2018.141.
Acknowledgments
This work was supported by JSPS KAKENHI Grant Numbers JP16K13662 and JP17H03231, and Niigata University U-go grant. The microfluidic cells and mounting device for smartphone used in this work were supported by Shin-Etsu Polymer Co. Ltd. Japan.