1. INTRODUCTION
Future development trend of indoor positioning promises that everyone will have access to location information (Shim, Reference Shim2012). Wireless technologies have been developed or have evolved to play an indispensable role in the positioning field (Chen et al., Reference Chen, Eric and Jin2014). The development of wireless technologies initially was associated with outdoor terrestrial systems such as the satellite-based global positioning system (GPS). Such systems calculate positions either from the determination of range based on time-of-flight measurements or more commonly by the application of pseudo-ranges estimated from time-of-arrival (TOA) measurements. A pseudo-range is the Euclidean distance between a transmitter-receiver pair and an unknown offset common to all the TOA measurements.
In indoor environments, GPS does not work well, as satellite signals are blocked by buildings and, typically, non-line-of-sight multipath conditions predominate. The design of indoor positioning systems is challenging as the rich, indoor, multipath radio-propagation environment makes accurate TOA measurements difficult.
More recently, various wireless outdoor localisation technologies have been extended to indoor environments for applications such as Bluetooth Low Energy, RFID (radio frequency identification), ZigBee and UWB (ultra-wide band) (Fang and Wang, Reference Fang and Wang2012; Martin and Markus, Reference Martin and Markus2013; García et al., Reference García, Poudereux, Hernandez, Urenna and Gualda2015; Zhu et al., Reference Zhu, Luo and Chen2015; Benjiaming et al., Reference Benjiaming, Eneko and Carlos2018). The WLAN network particularly, based on the IEEE 802·11 (Ahmed et al., Reference Ahmed, Abubakr and Chris2017) communication protocol, is widely deployed in indoor environments. Therefore, the Wi-Fi fingerprinting method has developed rapidly. The main idea of this technology is to locate an object by the received signal strength (RSS) value obtained from the reference node. A fingerprint database is established for the indoor environment, the final positioning result is then obtained by matching the RSS of the estimated position point with the RSS in the fingerprint database. Compared with current indoor localisation methods, the Wi-Fi fingerprinting method achieves higher positioning accuracy. However, to perform well, the fingerprinting method requires a large database of locations. This requires an extensive initial deployment effort. Furthermore, if the indoor environment changes, the database needs to be reconstructed (Kwon et al., Reference Kwon, Dundar and Varaiya2005).
On the other hand, cellular network location technology uses the communication infrastructure of the wireless cellular network to locate the position (Liu et al., Reference Liu, Qiu and Chen2016). Several mobile communication base stations have been built by different operators to ensure full coverage of an area. Considering the wide coverage of cellular networks, which are able to support a variety of Internet services, with no requirement to update mobile terminal hardware, cellular positioning technology is more commonly used. The cell-ID of a cellular network is used to estimate the location of an object, which utilises the cellular network knowledge serving for users. Depending on the coverage of the cell, accuracy is usually within the range of several hundred metres, which is relatively low.
In various wireless access technologies, Wi-Fi and cellular networks are widely used in indoor environments. Because of the complexity of the indoor environment, the signal propagation of a Wi-Fi network can be blocked by barriers such as walls, doors and windows, which can lead to significant fluctuation of signal intensity values measured at the same point, and subsequently result in errors in positioning results. The cellular networks is known to have a wider coverage indoors compared with Wi-Fi, and is being developed to play an indispensable role in indoor positioning. Therefore, in areas the Wi-Fi network cannot cover, such as stairwells, basements, toilets, the cellular network can be used to assist positioning and increase the reliability and robustness of indoor positioning results.
Sadhukhan et al. (Reference Sadhukhan, Sen and Das2010) proposed a hybrid indoor positioning algorithm based on a cellular network and Bluetooth to further improve positioning accuracy. Users can connect more conveniently through Bluetooth base stations. However, the construction costs of Bluetooth base stations are very high (Subramanian et al., Reference Subramanian, Sommer, Schmitt and Rosenstiel2007). Li et al. (Reference Li, Wang and Sun2015) proposed a hybrid indoor positioning algorithm for sparse wireless networks. By combining RSS values from hybrid networks, the positioning system was able to access sufficient location information. An efficient cost function-based algorithm was also proposed in the paper to improve the accuracy of fingerprint matching.
In this paper, two kinds of new indoor positioning schemes based on a cellular- and Wi-Fi network are proposed. In our schemes, the Wi-Fi fingerprinting method was taken as the main technology and the cellular network was used to improve the positioning accuracy and reduce system complexity. In Scheme 1, a new fingerprint database was established, combining the different types of cellular network- and Wi-Fi network signals; the Manhattan-weighted K-nearest neighbour (WKNN) algorithm was then used to calculate the coordinates of the estimated position node. Scheme 2 was performed in two steps: firstly, the cellular network was used to realise pre-positioning. After pre-positioning, the positioning area could be reduced; as a result, the number of reference nodes in the positioning area could also be decreased. Furthermore, in the online stage, the estimated position node only needed to match with the reference node in the pre-positioning area, which reduced positioning time. The Manhattan-WKNN algorithm of the Wi-Fi network was subsequently used to realise the final positioning.
The rest of this paper is organised as follows. Section 2 reviews the Wi-Fi fingerprinting method. In Section 3, two kinds of new indoor positioning schemes are described in detail. In Section 4, a series of simulations and experiments are presented. Finally, Section 5 draws conclusions and outlines future work.
2. OVERVIEW OF Wi-Fi FINGERPRINTING SCHEME
In this section, the overview of the Wi-Fi fingerprinting scheme is provided.
The Wi-Fi fingerprinting scheme is based on the RSS from the different access points (APs) and the coordinates of the reference point (RPs). The fingerprint of the RP is constituted by the RSS from different APs and its coordinate. The fingerprint database includes the fingerprints from all the RPs. There are two stages in the fingerprinting method: the offline and the online stage (Yang et al., Reference Yang, Wu and Liu2012; Chen et al., Reference Chen, Pei, Kuusniemi, Chen, Kroger and Chen2013). During the offline stage, the RPs are arranged in the indoor environments. A fingerprint database of the location coordinates and the corresponding RSS from nearby APs is then constructed. During the online stage, real-time RSS from APs are measured by the mobile terminal and matched with the location fingerprint stored in the fingerprint database. The final estimated location is obtained by a Wi-Fi fingerprinting algorithm. The most frequently used algorithm is the K-nearest neighbour (KNN) algorithm and the WKNN algorithm (Zhou et al., Reference Zhou, Xu and Ma2010; Oussalah et al., Reference Oussalah, Alakhras and Hussein2015), the details of which are as follows.
Suppose that there are M RPs and N APs in the considered indoor environment. The RSS of the i-th RP from the NAPs is denoted as
 $$\mbox{RSS}_i=\left(\mbox{RSS}_{i1},\mbox{RSS}_{i2},\ldots,\mbox{RSS}_{iN}\right),\quad i=1,2,\ldots,M$$
The RSS of the estimated position node from the N APs is denoted as
 $$\mbox{RSS}_{un} =(\mbox{RSS}_1,\mbox{RSS}_2,\ldots,\mbox{RSS}_N)$$
Then the Minkowski distance between the estimated position node and the i-th RP can be obtained as
 $$D_i=\left(\sum_{j=1}^N |\mbox{RSS}_{ij}-\mbox{RSS}_j|^q\right)^{1/q},\quad i=1, 2,\ldots,M$$
When q = 2, the calculated distance is the Euclidean distance:
 $$D_i=\sqrt{\sum_{j=1}^N (\mbox{RSS}_{ij} -\mbox{RSS}_j)^2},\quad i=1,2,\ldots,M$$
When q = 1, the calculated distance is the Manhattan distance:
 $$D_i=\sum_{j=1}^N |RSS_{ij}-RSS_j|,\quad i=1,2,\ldots,M$$
Suppose the coordinates of the closest K RPs are C 1, C 2, …, C K, and C i = (x i, y i), i = 1, …, K. Using the KNN algorithm, the coordinate (x un, y un) of the estimated position node is obtained as
 $$x_{un}=\frac{1}{K}\sum_{i=1}^K x_i, y_{un}=\frac{1}{K}\sum_{i=1}^K y_i$$
Using the WKNN algorithm, (x un, y un) is calculated as
 $$x_{un}=\sum_{i=1}^K w_i x_i,y_{un} =\sum_{i=1}^K w_i y_i$$
where w i denotes the weight of C i. In the WKNN algorithm (Oussalah et al., Reference Oussalah, Alakhras and Hussein2015), the reciprocal of the Euclidean distance between the estimated position nodes and RPs is used as the basis of the weight calculation. In this way, the smaller the distance between the RP and the estimated position node to be measured, the larger the weight assigned by the corresponding RP. More specifically, w i is given by
 $$w_i=\frac{1/D_i}{\sum_{j=1}^K (1/D_j)},\quad i=1,2,\ldots,K$$
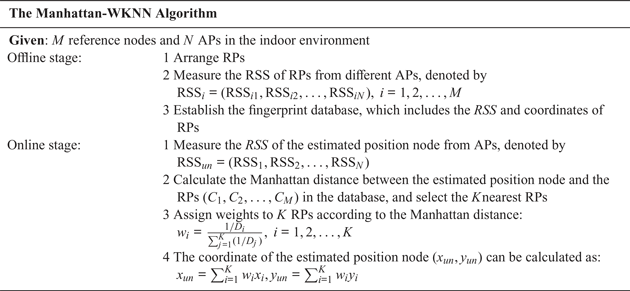
Although of low complexity, the accuracy of the Euclidean-WKNN algorithm is still relatively low (Xue et al., Reference Xue, Hua and Li2018). This is because the weights are calculated using the reciprocal distance between the estimated position node and the RPs. As a result, some of the closest RPs will not be assigned the largest weight, and the estimated location will shift to the geometric centre of the K nearest the RPs. In our study, the Manhattan distance was used to calculate the weights in the WKNN algorithm. In order to prove the rationality of the Manhattan distance, a series of simulation experiments were carried out (see Section 4). Based on Equation (5), the process of the WKNN algorithm using the Manhattan distance is shown in Table 1.
The process of Manhattan-WKNN algorithm.

3. PROPOSED POSITIONING SCHEME
In this section, the proposed schemes are described. Specifically, the intervals of the RPs are discussed to determine optimal selection, and two kinds of new positioning schemes are described in detail.
3.1. Different intervals of RPs
In indoor environments, AP coverage is limited due to signal attenuation. Therefore, in a large building, it is almost impossible to detect all APs within the building. Although the nearby fingerprint database stores all the information of the location grid, the fingerprinting algorithm tends to choose the local optimal fingerprint. Moreover, due to the variability of radio channel characteristics, random signal fluctuations cannot be ignored. In order to improve the accuracy of the positioning, RP intervals need to be small. This ensures that the fingerprint contains adequate location-related information and thus provides a more precise mapping relationship. However, as the number of RPs increases, the size of the fingerprint database expands, which in turn increases the calculating time for locating the estimated position node. In order to address these issues, the intervals of the RPs were optimised in our internal work (Li et al. Reference Li, Qiu and Liu2017).
The analytic hierarchy process (AHP) based on the entropy weight method (EWM) was used to determine optimal selection. The indexes include positioning accuracy, positioning time and the conversion ratio between RP intervals and accuracy, and the decision objects are different of RPs, which is the parameter of the AHP algorithm.
In order to reduce the subjectivity of determining weight by AHP, the EWM was introduced. First, the data of each index are normalised and expressed as Y ij. Then, the information entropy of each index is obtained according to the definition of information entropy. The information entropy of the i-th index can be expressed as
 $$E_i=-\frac{\sum_{j=1}^n {p_{ij} \ln p_{ij}}}{\ln (n)}$$
where  $p_{ij}=Y_{ij}/\sum_{j=1}^{n} Y_{ij}$.
The weight of EWM can be expressed as
 $$w_i=\frac{1-E_i}{k-\sum {E_i}},\quad i=1,2,\ldots,k.$$
The weight of AHP and EWM are combined to calculate the final weight. Suppose that the weight calculated by the AHP and EWM are w 1 and w 2. The final weight, expressed as w, is obtained by weighting the two weights together, given by
 $$w=(w_1+w_2)/2$$
The comprehensive weights of each indicator calculated are multiplied by the standardised indicator parameters, and the comprehensive evaluation scores of each scheme are obtained, which are expressed as z i. The final evaluation results, Z, can be expressed as follows:
 $$Z=\sum_{i=1}^k {w_i z_i}$$
A series of simulation are carried out to optimise the intervals of the RPs in Section 4.1.2.
3.2. Fusion network positioning algorithm
In this subsection, two hybrid network indoor positioning schemes based on a cellular network and a Wi-Fi network are proposed.
In a cellular network, there can be significant inaccuracy in indoor positioning because of the wide coverage of the base station. Due to the complexity of the indoor environment, signal intensity fluctuates. In addition, current mobile terminals support multi-standard networks, and each network is able to achieve full coverage of the indoor environment. At the same time, the base stations of each type of network are not deployed at the same place, meaning cellular networks of different formats have different signal strength distributions. These constant values result in the inadequate discrimination of the location area, which increase the positioning error. However, the addition of cellular networks can increase the discrimination of location areas. Based on the distribution characteristics of the cellular network signal in the indoor environment, Scheme 1 constructs a hybrid fingerprint database with a cellular and Wi-Fi network. The Manhattan-WKNN algorithm is then used to calculate the coordinate of the estimated position node.
Scheme 2 is a two-step fusion positioning that uses the cellular network to obtain the a priori location of the estimated position node, which then uses the Manhattan-WKNN algorithm to further improve accuracy. The limitation that each AP node is unable cover the whole area of an indoor environment can be effectively solved. Moreover, this method can reduce both the utilisation rate of the RPs and the calculating time.
3.2.1. Scheme 1: hybrid fingerprint database positioning scheme
Our hybrid fingerprint database combines the signal intensity of a cellular network with the signal intensity of a Wi-Fi network. First, the Wi-Fi network fingerprint database and the cellular network fingerprint database are separately constructed with the same RPs, and the two databases are then merged into one hybrid fingerprint database. Then, in the Manhattan-WKNN algorithm, the weighted average location of the former K (K = 4) the most similar fingerprint was chosen as the estimated location. The details of the hybrid fingerprint database are as follows.
Suppose that there are M RPs and N APs in the considered indoor environment. The Wi-Fi fingerprint database of M RPs is denoted as
 $$\mbox{FB}_{\text{Wi-Fi}} =\left[\begin{matrix} x_1 & y_1 & \mbox{RSS}_{W11} & \ldots& \mbox{RSS}_{W1N} \\ x_2 & y_2 & \mbox{RSS}_{W21} & \ldots& \mbox{RSS}_{W2N} \\ {x_3 } & {y_3 } & {RSS_{W31} } & \ldots &{\mbox{RSS}_{W3N} } \\ \ldots & \ldots & \ldots & \ldots & \ldots \\ {x_M } & {y_M } & {\mbox{RSS}_{WM1} } & \ldots& {\mbox{RSS}_{WMN} } \\ \end{matrix}\right]$$
The cellular network fingerprint database of the same M RPs and six kinds of formats are described as
 $$\mbox{FB}_C =\left[\begin{matrix} {x_1 } & {y_1 } & {\mbox{RSS}_{C11} } & \ldots& {\mbox{RSS}_{C16} } \\ {x_2 } & {y_2 } & {\mbox{RSS}_{C21} } & \ldots& {\mbox{RSS}_{C26} } \\ {x_3 } & {y_3 } & {\mbox{RSS}_{C31} } & \ldots& {\mbox{RSS}_{C36} } \\ \ldots & \ldots & \ldots & \ldots & \ldots \\ {x_M } & {y_M } & {\mbox{RSS}_{CM1} } & \ldots& {\mbox{RSS}_{CM6} } \\ \end{matrix}\right]$$
So the hybrid fingerprint database is expressed as
 $$\mbox{FB}_{\text{Hybrid}}=\left[\begin{matrix} x_1 & {y_1 } & {\mbox{RSS}_{C11} } & \ldots& {\mbox{RSS}_{C16} } &{\mbox{RSS}_{W11} } & \ldots & {\mbox{RSS}_{W1N} } \\ x_2 & {y_2 } & {\mbox{RSS}_{C21} } & \ldots& {\mbox{RSS}_{C26} } &{\mbox{RSS}_{W21} } & \ldots & {\mbox{RSS}_{W2N} } \\ x_3 & {y_3 } & {\mbox{RSS}_{C31} } & \ldots& {\mbox{RSS}_{C36} } & {\mbox{RS}S_{W31} } & \ldots & {\mbox{RSS}_{W3N} } \\ \ldots & \ldots & \ldots & \ldots & \ldots & \ldots & \ldots & \ldots \\ x_M & {y_M } & {\mbox{RSS}_{CM1} } & \ldots& {\mbox{RSS}_{CM6} } &{\mbox{RSS}_{WM1} } & \ldots & {\mbox{RSS}_{WMN} } \\ \end{matrix}\right]$$
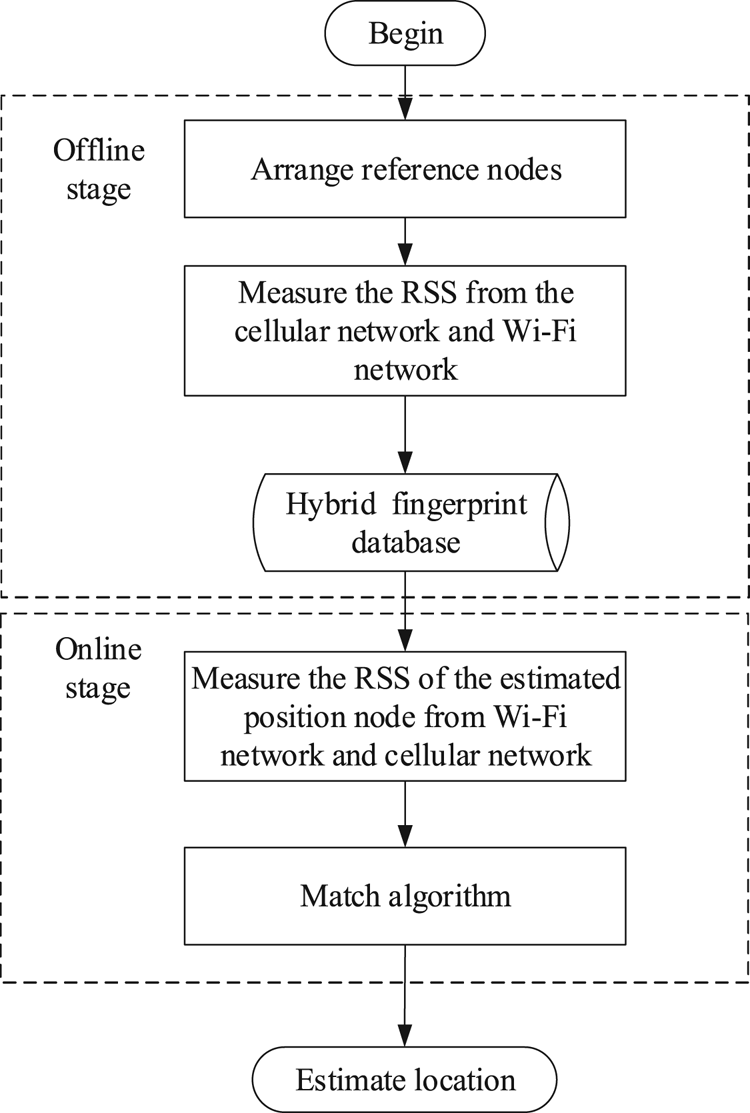
The fusion positioning scheme based on the hybrid fingerprint database is similar to the Wi-Fi network indoor positioning method based on the Manhattan-WKNN algorithm. The process is shown in Figure 1. The differences between our scheme and the Manhattan-WKNN algorithm are as follows. Then, in the Manhattan-WKNN algorithm, the weighted average location of the former K (K = 4) most similar fingerprint was chosen as the estimated location.
The process of the hybrid positioning algorithm.

Firstly, in the offline stage, the signal strength of the Wi-Fi and cellular networks are measured separately, then a fingerprint database for each network is constructed separately, and the two databases are merged into a hybrid fingerprint database.
In the online stage, when the estimated position node signal intensity and fingerprint database are matched, the signal intensity from each AP received by the Wi-Fi network is sorted, and the best AP of the former P signal intensity and the complete cellular network is selected to construct the improved fusion fingerprint database. The value of P (number of signal intensity) is determined by the offline stage according to the actual indoor environment.
3.2.2. Scheme 2: two-step fusion positioning scheme
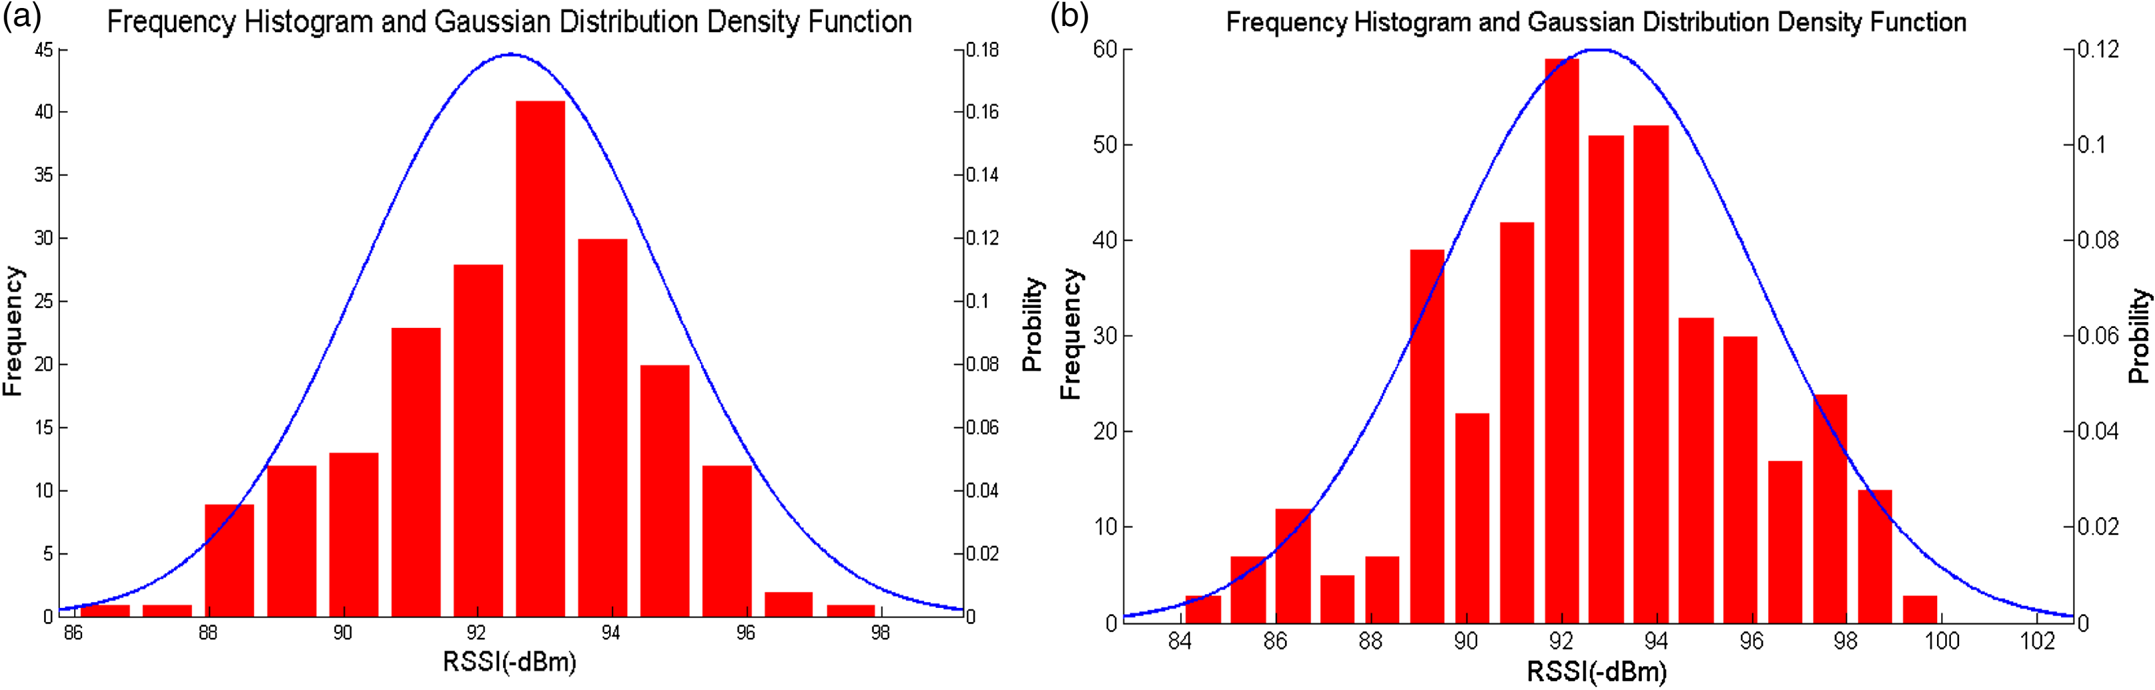
Through multiple sampling of points in the indoor environment, it was found that the signal intensity received at the same point basically satisfies the Gaussian distribution. The time-varying RSS value at a certain point was converted into a histogram, and the histogram shows the RSS fluctuation, as shown in Figure 2.
Distribution of RSS values: (a) FD-LTE, (b) TD-LTE.

The probability density function (PDF) of a Gaussian distribution can be expressed as
 $$f(x)=\frac{1}{\sqrt{2\pi}\sigma}\exp \left(-\frac{(x-\mu )^2}{2\sigma^2}\right)$$
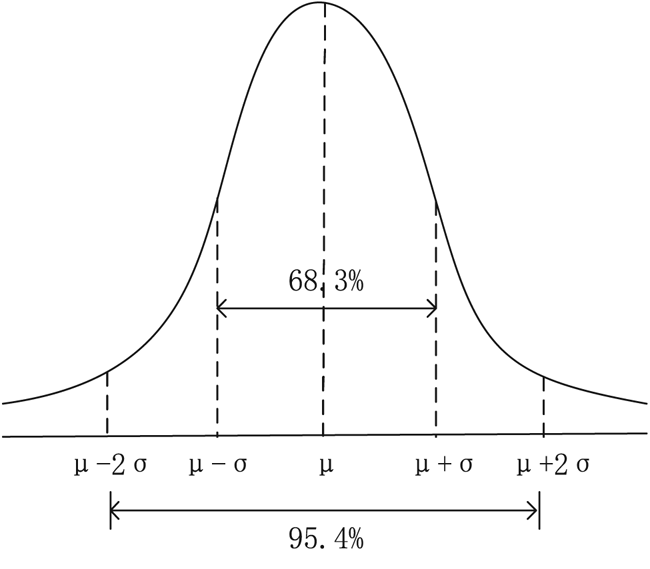
where μ is the average value, and σ is the standard deviation. Figure 3 shows the PDF diagram of the Gaussian distribution.
Probability density function of a Gaussian distribution.

From Figure 3, it can be found that the probability of a Gaussian-distributed random variable falling within interval [μ − σ, μ + σ] is 68·3%, and of the value falling within interval μ − 2σ, μ + 2σ] is 95·4%. Therefore, there is a 95·4% probability that the position satisfying the signal strength of the range will fall in the area [RSS − 2σ, RSS + 2σ] where the real point is located.
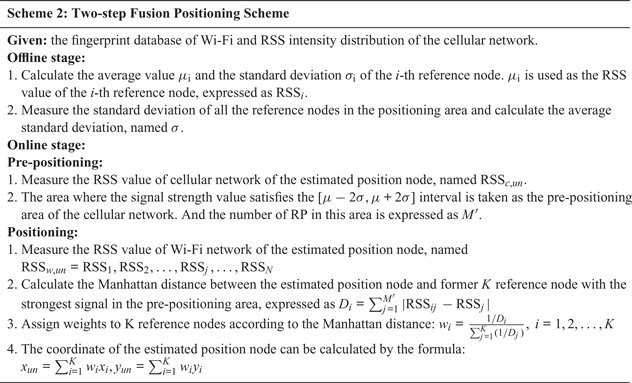
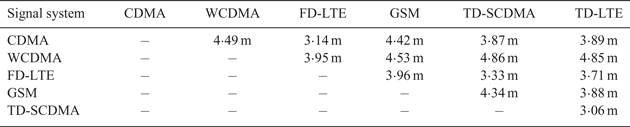
For the pre-positioning of a single cellular network, the pre-positioning range of each cellular network can be obtained by measuring the average standard deviation of each type of network in the indoor environment. The standard deviation of signal fluctuations for different network systems is shown in Table 2. And the process of Scheme 2 is shown in Table 3.
The standard deviation of signal fluctuations for different network systems.

The process of Scheme 2.

4. SIMULATION AND EXPERIMENTAL RESULTS ANALYSIS
In this section, a series of simulations and experiments are presented to show the effectiveness of our proposed schemes.
4.1. Simulation results analysis
4.1.1. Simulation results of the WKNN algorithm
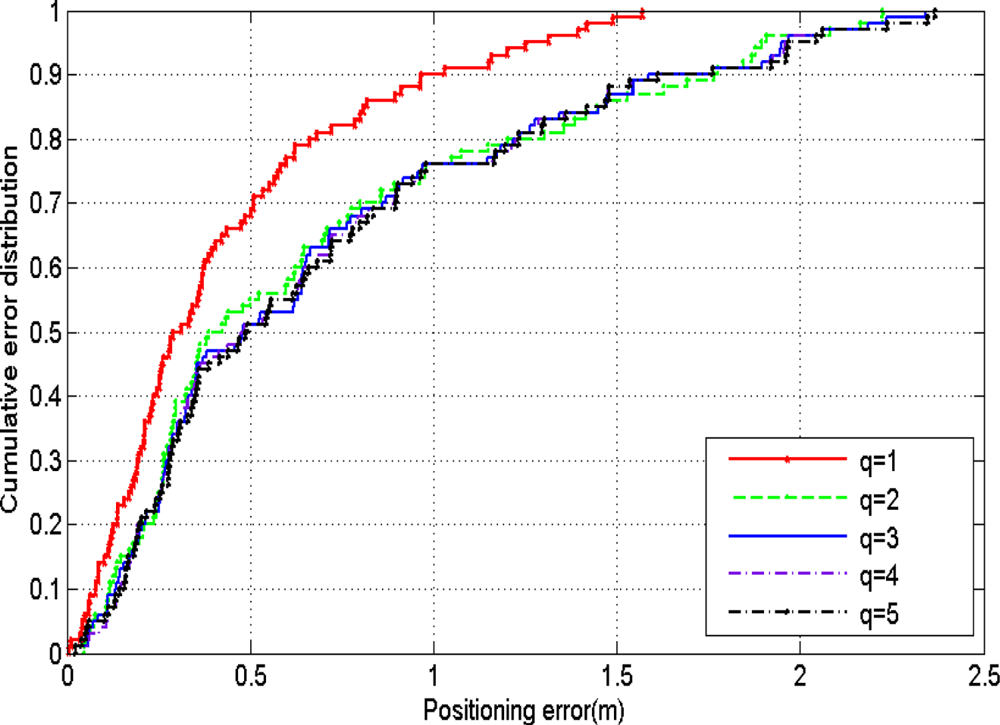
In this subsection, the different values of q (the index of Minkowski distance) are compared, and the cumulative error distribution is shown in Figure 4. In this figure, the simulation environment is considered to be a square with 20-m sides. The intervals of the RPs are 1 m, and the number of estimated position nodes is 100. It was found that when q was taken from 2 to 5, the positioning errors had little change; when q was taken as 1, the performance was better.
The cumulative error distribution with different q.

In order to further verify the rationality of the Manhattan distance, a series of simulations and analyses of the Manhattan- and Euclidean distance are carried out in this section.
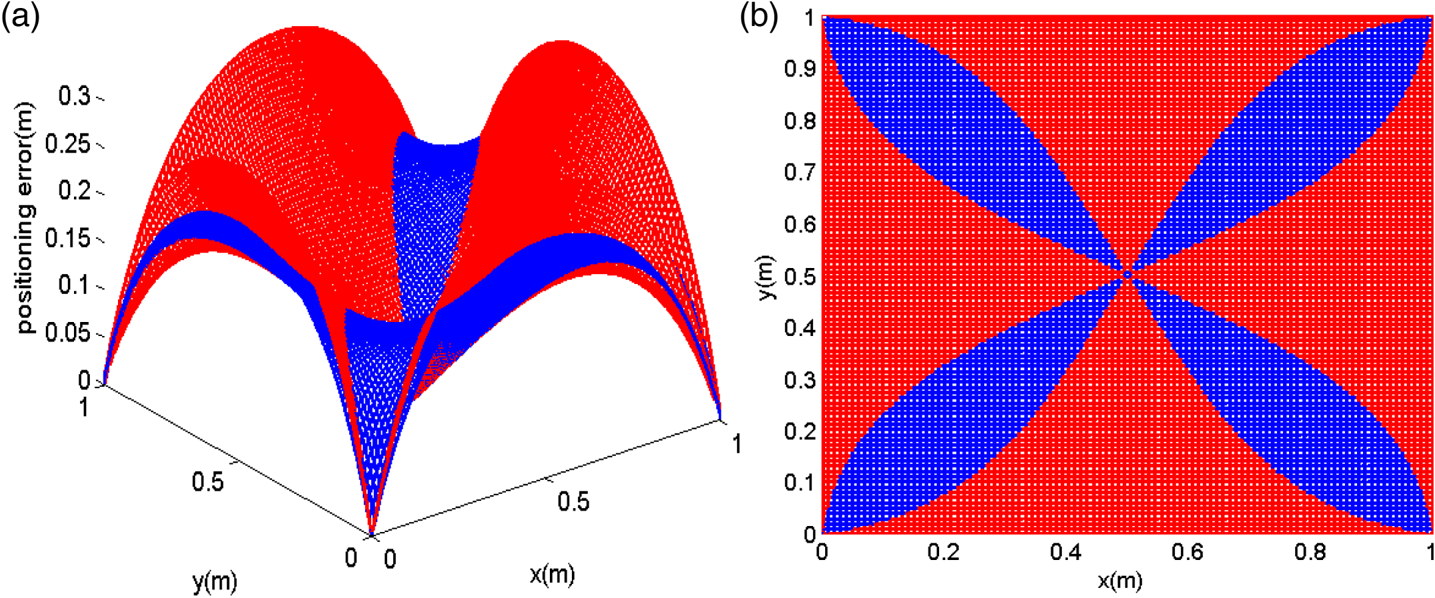
Because the reference nodes in the experimental environment are distributed in square grids, any of them can be used for simulation analysis to analogise the whole area. In this section, a 1 × 1 m square grid region is selected. The reference nodes are arranged on the four vertices of the region, and the K of the WKNN algorithm is 4. The error caused by the unknown nodes distributed in the whole region is analysed, as shown in Figure 5. The red region represents the error distribution using the Euclidean distance, and the blue region represents the error distribution using the Manhattan distance. In Figure 5(a), it can be found that the error reaches the maximum when the estimated position node is in the middle of the four sides of the square with a 0·2-m error of the Manhattan distance and a 0·3-m of the Euclidean distance. In Figure 5(b), when the estimated position nodes are located near the square diagonal, the Euclidean distance performs better, whereas the Manhattan distance performs better in most other regions. Moreover, the average Manhattan distance error is about 0·15 m, while that of Euclidean distance is about 0·16 m, which further proves that the overall positioning accuracy of the Manhattan distance is better than the Euclidean distance.
The error distribution map of Euclidean distance and Manhattan distance: (a) three-dimensional error distribution map, (b) overhead view of error distribution.

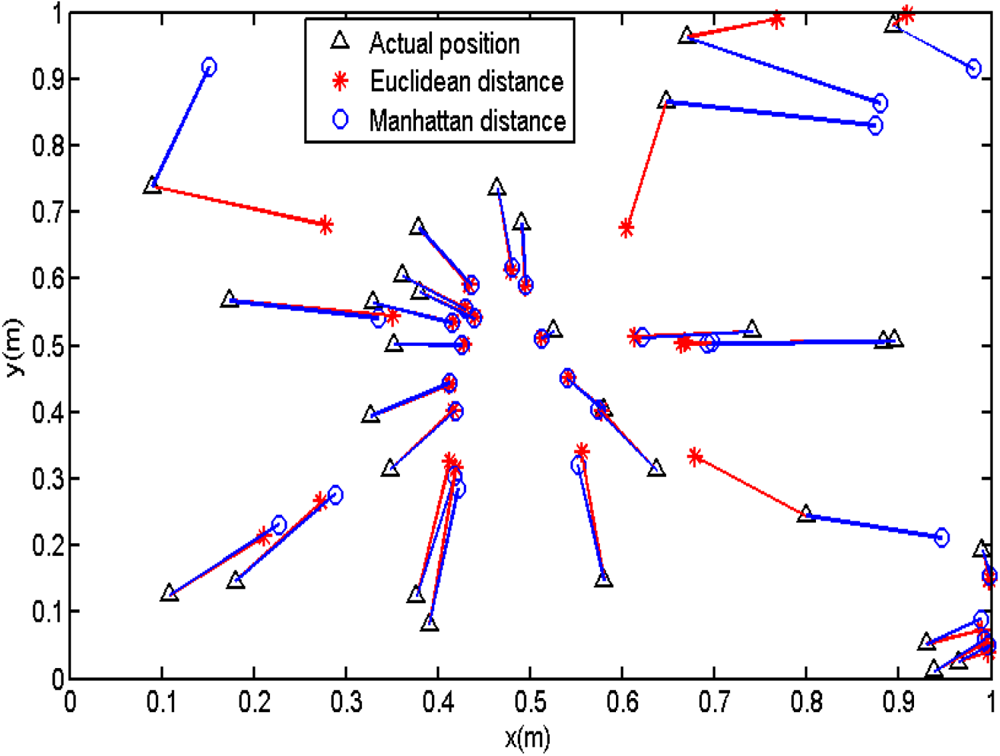
In order to analyse the spatial distribution of the estimated position nodes, there are 30 estimated position nodes randomly distributed in the square's area. The calculated results are shown in Figure 6 by comparing the actual position with the Euclidean and Manhattan distance. The average error of the Euclidean and the Manhattan distance are 0·12 m and 0·11 m, respectively.
Comparisons of actual and calculated positions of the estimated position nodes.

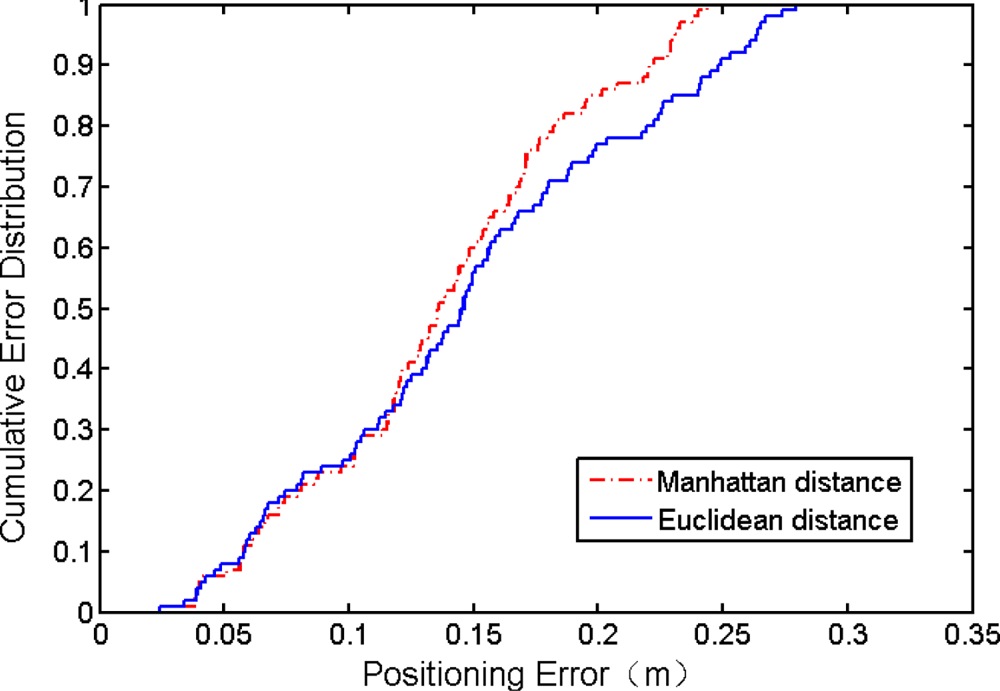
Figure 7 shows that the performance of the Manhattan-WKNN algorithm is better than the Euclidean-WKNN algorithm. A square with 20-m sides is considered in this figure. The intervals of RPs are 1 m, and the number of estimated position nodes is 100. It was found that the performance gap between the Manhattan-WKNN and the Euclidean-WKNN algorithm increased as the positioning error increased, indicating the usefulness of the Manhattan-WKNN algorithm.
The cumulative error distribution.

4.1.2. Simulation results of different intervals of RPs
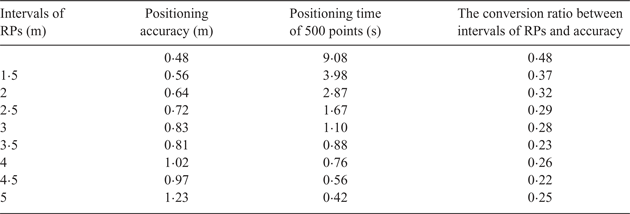
In this subsection, a series of simulations are carried out to optimise the intervals of the RPs. The three indexes calculated by different intervals of RPs when the standard deviation is 2 dBm are shown in Table 4.
Index parameters of different intervals when the standard deviation is 2 dBm.

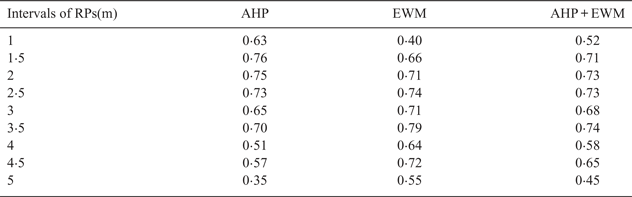
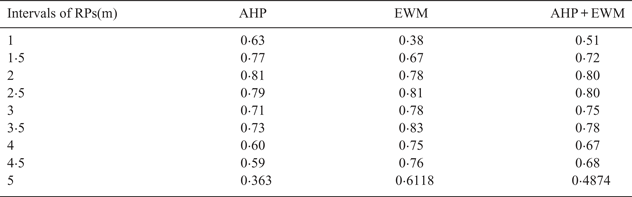
It can be seen in Table 4 that with an increase in the RP intervals, the positioning accuracy tends to decrease, while the positioning time decreases, and the value of the conversion ratio between grid size and accuracy diminishes. The weights of the three indicators are determined by using the AHP and the EWM, as shown in Table 5. The final evaluation results according to the weights of each indicator from Table 5 are shown in Table 6: it is not difficult to see that the trend of results obtained by the three evaluation methods are basically the same, but there are differences in the ranking of individual schemes. When the intervals of the RPs were 3·5 m, the comprehensive evaluation results were best; good evaluation results were also obtained when the interval was 2 m and 2·5 m.
Weight distribution of indexes by different methods with a standard deviation of 2 dBm.

Comparison of evaluation results obtained by the three methods when the standard deviation is 2dBm.

In Table 7, when the standard deviation is 3 dBm, the evaluation result is best at 2·5 m, and good at both 2 m and 3·5 m, which is similar to the evaluation result when the standard deviation is 2 dBm. According to the simulation results, the intervals of the RPs are 2 m in our actual experiment.
Comparison of evaluation results obtained by the three methods when the standard deviation is 3dBm.

4.2. Experiment results analysis
4.2.1. Experiment environment
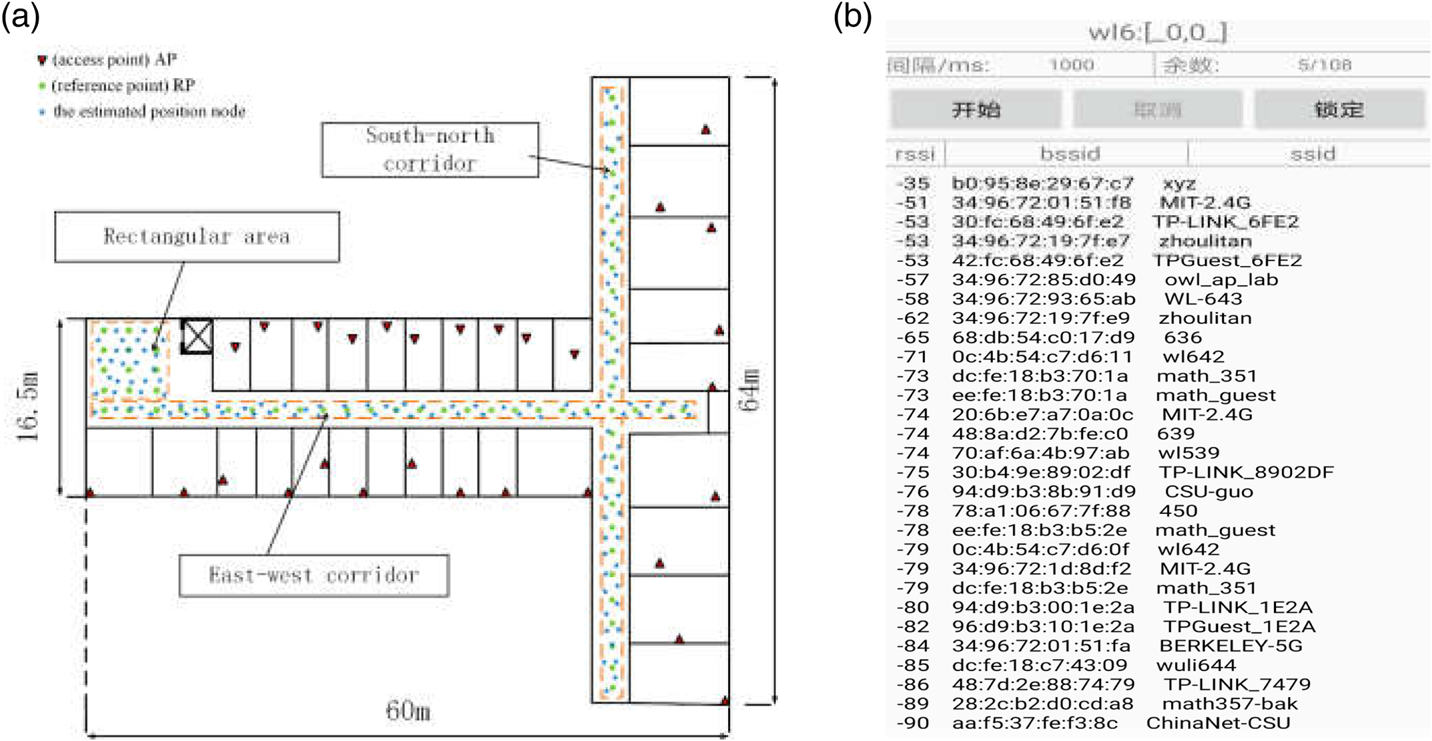
In order to verify the performance of the proposed schemes, a series of experiments were carried out in the School of Physics and Electronics, Central South University. The experimental environment included a rectangular indoor area, east–west corridor, and north–south corridor. The size of the rectangular indoor area was 8·4 m × 6·6 m, and the size of east–west corridor and north–south corridor were 2 m × 60 m and 2 m × 64 m, respectively. There were 30 APs in total, marked with a red triangle, and each room had one AP. The RPs were separated by 2 m, marked with green dots. In the online stage, 126 estimated position nodes were chosen randomly in our experimental environment, marked with blue five-pointed stars. The layout of the experimental environment is shown in Figure 8(a). The value of K in the Manhattan-WKNN algorithm was determined as 4. All data were collected by an Android-powered smartphone. Due to the influence of dynamic factors such as human movement in an indoor environment, the measured signal intensity value fluctuates to a certain extent, which affects the positioning results. To solve this problem, the signal intensity values were collected at various times over different days. Because of the limitation of the Wi-Fi network – that each AP node cannot cover the whole area of an indoor environment – the non-available RSS values were set to a small constant value (such as −120 dBm) (Dong et al., Reference Dong, Zhang and Zheng2015). The mobile app used to collect the received signals was designed by our lab. The interface of this app is shown in Figure 8(b). To reduce the impact of accidental errors on the results, the average result of 10 repeated experiments was used as the result in this section.
(a) Layout of the experiment environment, (b) the interface of APP.

4.2.2. The WKNN algorithm analysis
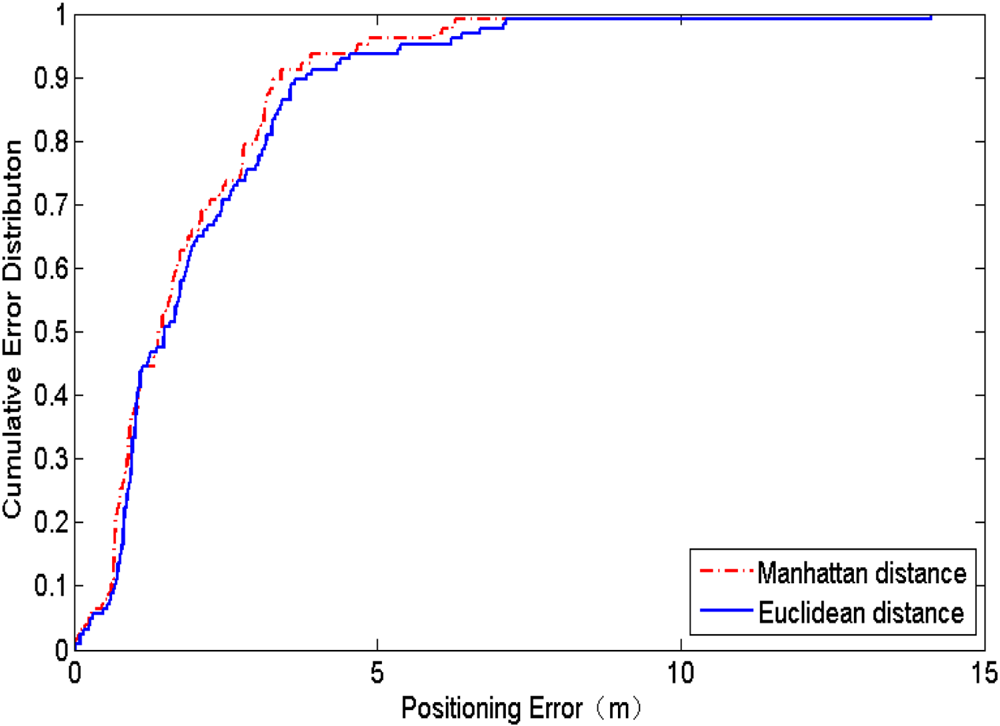
Figure 9 shows the cumulative error distribution of the Euclidean distance and the Manhattan distance. It can be found from Figure 9 that the Manhattan distance has better performance than the Euclidean distance. The mean error and the maximum error of different distances are shown in Table 8. The mean error of the Manhattan- and the Euclidean distance are 1·82 m and 2·05 m, respectively. Compared with the Euclidean distance, the mean error of the Manhattan distance is reduced by 11%.
The CDF with the Euclidean distance and the Manhattan distance.

The mean error and the maximum error of different distance.

4.2.3. Single cellular network signal strength analysis
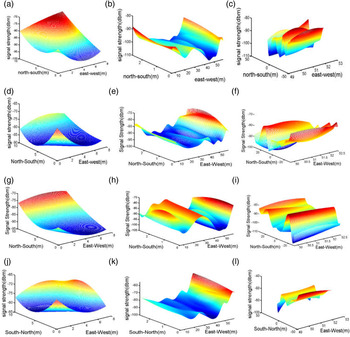
In this experiment, Frequency Division-Long Term Evolution (FD-LTE), Wideband Code Division Multiple Access (WCDMA), Code Division Multiple Access (CDMA), Time Division-Long Term Evolution (TD-LTE), Time Division - Synchronous Code Division Multiple Access (TD-SCDMA) and Global System for Mobile Communication (GSM) signals were collected for experimental analysis, the signal strength distributions of which are shown in Figure 10.
Signal intensity distribution in FD-LTE: (a) rectangular area, (b) east–west corridor, (c) north–south corridor; WCDMA: (d) rectangular area, (e) east–west corridor (f) north–south corridor; TD-LTE: (g) rectangular area, (h) east–west corridor, (i) north–south corridor; GSM: (j) rectangular area (k) east–west corridor (l) north–south corridor.

Due to the different locations of the base stations in different formats, different cellular networks showed different trends in the indoor environments. On the other hand, signal fluctuations of different cellular networks are different; the difference between the strongest and the weakest signal strength received by a signal with a large fluctuation is above 40 dBm, while the difference with small fluctuation is around 30 dBm. Different fluctuation distributions determine that indoor locations using different cellular networks has a theoretical basis.
4.2.4. Scheme 1: hybrid fingerprint database positioning scheme analysis
The distance between the reference nodes in this experiment was 2 m, and 30 AP nodes were distributed in the environment. The cellular network database includes six kinds of signals: FD-LTE, WCDMA, CDMA, TD-LTE, TD-SCDMA and GSM. Every format network is expressed as a one-dimensional vector. More specifically, suppose that there are M RPs in the considered indoor environment. In our cellular network fingerprint database, it can be expressed as
 $$\mbox{RSS}_i =(\mbox{RSS}_{ci1},\mbox{RSS}_{ci2},\ldots,\mbox{RSS}_{ci6}),\quad i=1,2,\ldots,M$$
where RSScij(j = 1, 2, …, 6) means the signal strength of the j-th format of cellular network from the i-th RP. The cumulative error distribution is shown in Figure 11. It was found that Scheme 1 achieved better performance than the cellular- or the Wi-Fi network only. The mean error and the maximum error of different network positioning are shown in Table 9. The mean error and the maximum error of the hybrid network were the smallest among the three types of networks. The average positioning error of Wi-Fi network was 1·82 m, while in Scheme 1 it was 1·60 m, a reduction of 12·0% compared with the Wi-Fi network. The experimental results also proved that the hybrid fingerprint database that combined the cellular- with the Wi-Fi network can significantly improve positioning accuracy.
Cumulative Distribution Functions (CDFs) of different networks.

The mean error and the maximum error of different network positioning.

To further verify the performance of the hybrid network, the existing positioning algorithms were compared with our Scheme 1 algorithm. The improved omnidirectional fingerprint database (IOFPD)-AWKNN algorithm (Bi et al., Reference Bi, Wang and Li2018) consists of two stages: the offline stage and the online stage. In the offline stage, RSS fingerprints are collected at specified locations with four orientations in the test area, and the IOFPD can be obtained after adjusting a cluster based on the transition region. The online stage is composed of cluster matching and the proposed AWKNN algorithm. The AWKNN algorithm contains three parts: KNN, APC (affinity propagation clustering) and IDW (inverse distance weighting). The GSM/WLAN algorithm (Machaj and Brida, 2017) utilises radio signals from both GSM and Wi-Fi networks. Figure 12 illustrates the Cumulative Distribution Functions (CDFs) of the KNN, IOFPD-AWKNN, GSM/WLAN and Scheme 1. The four positioning methods had similar performance when the positioning error was less than 1 m. But Scheme 1 performed better than the other three methods when the positioning error was larger than 1 m. The maximum error, mean error and the root mean square error (RMSE) were utilised for evaluating the performances of different methods (see Table 10).
The Cumulative Distribution Functions (CDFs) of different schemes.

Positioning errors for KNN, IOFPD-AWKNN, GSM/WLAN and Scheme 1.

As shown in Table 10, Scheme 1 is implemented with the maximum error of 5·51 m, a mean error of 1·60 m, a RMSE of 1·96 m, while the other three positioning methods have a larger mean error than the proposed method. Experimental results showed that Scheme 1 was suitable for high accuracy location.
Compared with the IOFPD-AWKNN and GSM/WLAN, our hybrid fingerprint database increased the data of the cellular network, which means a larger signal coverage and data size. It is therefore understandable and acceptable that Scheme 1 had better performance.
4.2.5. Scheme 2: two-step positioning scheme analysis
In our second scheme, the cellular network was used to determine a rough area, the RPs in this area were then matched with the estimated position node using the Manhattan-WKNN algorithm to determine the final position. Usage represents the proportion of reference nodes used in Wi-Fi positioning. The usage of the reference node and positioning error of Scheme 2 are shown in Table 11.
The usage of the reference node and positioning error.

It can be found from Table 11 that the reference node usage rate of the six standard networks has been reduced. The minimum usage rate was WCDMA at 32%, and the highest was CDMA at 48%. At the same time, the positioning error was worse than the hybrid network.
Subsequently, a multi-standard cellular network was used for pre-positioning. Considering that the mobile phone is generally a dual-card system, these six standard cellular networks were combined in pairs for pre-positioning. The usage of the RPs is shown in Table 12.
The usage of RPs in Scheme 2 of the dual-cellular networks.

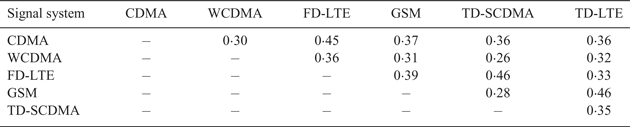
After using the TD-SCDMA- and WCDMA network, the usage rate of the Wi-Fi reference node was the smallest, and the average usage rate was only 26%. The average usage of the 15 dual-cellular network combinations was calculated to be 36%, while the six types of single networks were calculated to be 40%. The mean positioning errors in Scheme 2 of these 15 dual-cellular networks are shown in Table 13.
The mean positioning error in Scheme 2 of dual-cellular networks.

The mean error of Scheme 2 with dual-cellular networks was between the 3 and 5 m, which is similar to the single-standard networks. While reducing the amount of the reference node, the positioning error increased compared with the Wi-Fi network. Table 14 shows the positioning errors and positioning time for KNN, WKNN, Scheme 1 and Scheme 2. Compared with the KNN, WKNN and Scheme 1 method, the positioning time of Scheme 2 was reduced by 53·6%, 69·5% and 67·3%, respectively. The comparison of the Manhattan-WKNN algorithm and Scheme 2 in positioning time is shown in Figure 13. The positioning time of two positioning algorithms increased as the size of the fingerprint database increased, but the growth speed of Scheme 2's positioning time was much less than that of the Manhattan-WKNN algorithm. In addition, Scheme 2 had an average 48·08% reduction in positioning time compared with the Manhattan-WKNN algorithm, showing that Scheme 2 is more suitable for real-time positioning with critical calculation time requirements.
The positioning time of the Manhattan-WKNN algorithm and Scheme 2.

Positioning errors and positioning time of KNN, WKNN, Scheme 1 and Scheme 2.

5. CONCLUSION
In this paper, the Manhattan distance was used in a WKNN algorithm to improve positioning accuracy. To reduce the complexity of the system, intervals of the RPs were optimised. Meanwhile, two hybrid network indoor positioning schemes based on cellular- and Wi-Fi networks were proposed to improve positioning accuracy. In Scheme 1, cellular- and Wi-Fi networks were used to build a hybrid fingerprint database. In Scheme 2, a two-step positioning method was proposed to reduce the calculating time. The cellular network was used to locate the node a priori, and the Wi-Fi network was used to further determine the position of the estimated position nodes. Simulation results showed that the Manhattan-WKNN algorithm had better performance and the RP intervals were chosen as 2–2·5 m. Experimental and numerical results showed that the average positioning error of Scheme 1 was 1·60 m, a reduction of 12% compared with the Manhattan-WKNN algorithm. It was also shown that Scheme 2 could reduce the usage of the RPs of the Wi-Fi network by 60% when a single cellular network was used. Moreover, when double cellular networks were used, the usage of the RPs was reduced by 64%, and the calculating time for locating the estimated position node was 0·24 s, a reduction of up to 69·5%.
However, because of the limitation of the Wi-Fi network (that AP nodes cannot cover areas like toilets and stairwells), the lack of a Wi-Fi fingerprint database led to inaccurate positioning. Therefore, in our future work, we will focus on how to further improve the accuracy of indoor positioning in such places. Several interpolation methods will be considered in rebuilding the fingerprint database to increase the number of reference nodes. However, a larger experiment area will also increase the cost of the fingerprinting database and the positioning time, therefore, how to decrease the size of the fingerprinting database will be another focus of our future work.