I. INTRODUCTION
Among the novel nanocarbons of recent origin, Reference Baughman, Zakhidov and de Heer1,Reference Compton and Nguyen2 carbon quantum dots (CQDs) constitute a new class of zero-dimensional nanostructures with a diameter of ∼10 nm. CQDs are stable, biocompatible, and exhibit characteristic photoluminescence (PL). They are easy to functionalize and are superior in some respects to the traditional semiconductor quantum dots. Reference Li, Kang, Liu and Lee3–Reference Meier, Hwang and Campbell6 Doping in semiconductor materials is generally done to introduce defects which down the carrier lifetime and device performance. Introduction of a high level of defects would affect the distribution of energy levels within the band gap, by acting as recombination centers. Reference Michalet, Pinaud, Bentolila, Tsay, Doose, Li, Sundaresan, Wu, Gambhir and Weiss5,Reference Meier, Hwang and Campbell6 Doping of nanocarbons with heteroatoms such as nitrogen allows one to alter their electronic, chemical, and surface properties. Reference Gong, Du, Xia, Durstock and Dai7–Reference Panchakarla, Govindaraj and Rao9 For example, N-doped carbon nanotubes show highly effective electrocatalytic activities for the oxygen reduction reaction. Reference Yu, Zhang and Dai10,Reference Wang, Yu and Dai11 Similarly, N-doped graphene exhibits a band gap and may have applications in semiconducting devices, Reference Wang, Li, Zhang, Yoon, Weber, Wang, Guo and Dai12 electrocatalysis, Reference Qu, Liu, Baek and Dai13 supercapacitors, Reference Jeong, Lee, Shin, Choi, Shin, Kang and Choi14,Reference Gopalakrishnan, Moses, Govindaraj and Rao15 and electrochemical biosensing. Reference Wang, Shao, Matson, Li and Lin16 There are a few reports on the synthesis methods of N-doped carbon quantum dots (N-CQDs) such as hydrothermal method, Reference Zhang, Ma, Zhuang, Zhang, Chen, Hong, Yan, K.Yu and Huang17,Reference Hu, Liu, Yang, Cui, Huang, Wang, Yang, Wang, Xiao and Rong18 ultrasonication, Reference Ma, Ming, Huang, Liu and Kang19 and microwave (MW) treatment Reference Zhai, Zhang, Liu, Bai, Li, Dai and Liu20 by using an apparent carbon source in the presence of a nitrogen precursor such as ammonia or amines. Pyrolysis of nitrogen-containing carbon precursors has also been used to obtain N-CQDs. Reference Ming, Liu, Feng, Yin, He and Zhang21 Nitrogen-doped graphene quantum dots have been synthesized by solution chemistry as well as by electrochemical means. Reference Li, Zhang, Dai and Li22 The N/C atomic ratio in the CQDs reported so far was in the range of 2–18%, most of them with a low content of less than 10%.
In search of a simple new method of preparing N-CQDs, we have carried out the decomposition of glucose in the presence of urea under hydrothermal conditions as well as by MW irradiation. Here, the decomposition of urea gives ammonia which acts as the nitrogen source, a reaction that has been used to synthesize various nitrides, as well as N-doped graphene. Reference Sardar and Rao23−Reference Gopalakrishnan, Govindaraj and Rao27 We have characterized the N-CQDs so prepared and studied some of their properties. These N-CQDs, possessing high nitrogen doping content with N/C ratios of 18–22%, exhibit good aqueous stability and tunable PL. The N-CQDs show the characteristic blue emission in the 400- to 500-nm region. We have examined the interaction of both N-doped and undoped CQDs with graphene, tetrathiafulvalene and tetracyanoethylene. N-CQDs exhibit superior visible light induced catalytic activity for the photodegradation of methylene blue compared to undoped CQDs. It is noteworthy that mixtures of N-CQDs with ZnO and graphene oxide in proper proportions emit white light.
II. EXPERIMENTAL
A. Synthesis
Method 1: glucose (0.1 g) and urea (1 g) were dissolved in 5 mL distilled water. The solution was kept in Teflon-lined autoclave of 23-mL capacity and heated at 150 °C for 1 h.
Method 2: we have placed the glucose–urea solution (1:10 mass ratio) in a domestic MW oven (600 W) and heated for 7 min. The yellow colored solutions obtained from both the methods were dialyzed (10,000 Da dialysis membrane) for 3 days and dried under freeze drying. We have synthesized CQDs by the literature-reported method. Reference Wang, Qu, Xu, Ren and Qu28 CQDs were prepared by MW heating glucose with few drops of dilute NaCl solution in 5-mL distilled water. The rest of the procedures were the same as for the synthesis of N-CQDs.
B. Characterization
UV-vis absorption spectra were recorded using a Perkin Elmer lambda 650 spectrometer (UV/VIS/NIR spectrometer), and PL measurements were carried out by Horiba Jobin Yvon Spectrometer (iHR 320). X-ray photoelectron spectroscopy (XPS) was recorded with Mg Kα (1253.6 eV) x-ray source to analyze the composition of samples. Transmission electron microscopy (TEM) images were recorded with an FEI Technai T20 instrument at an accelerating voltage of 200 kV. Atomic force microscopy (AFM) measurement was carried out on a Bruker Innova Microscope instrument in tapping mode using antimony n-doped Si tip of 10-nm resolution. FT-IR characterization was carried out on a Bruker IFS 66v/S instrument.
C. Interaction study with electron donor and acceptor molecules
We have added different concentrations of TCNE (conc. in the range of 10−4–10−2 M), TTF (conc. in the range of 10−4–10−2 M), N,N-dimethyl aniline (0.1–1 M) with the same amount of N-CQDs, and pristine CQDs individually in ethanol solution (final volume 3 mL). We have freeze dried the CQD solution to get dry CQD sample and redispersed it again in ethanol to make a solution of the concentration of 0.2 mg/mL. Finally, 1 mL of this solution of CQDs/N-CQDs was diluted to 3 mL in the presence of the required concentration of donor/acceptor molecules in ethanol (molar extinction coefficient of CQDs is ∼2 × 10⁵ M−1 cm−1). In the case of grapheme, 1 mg/mL concentration of exfoliated graphene solution in ethanol has been obtained by mild sonication. Then it was added to CQD and N-CQD solution to achieve the concentration in the range of 0.005–0.05 M. We have sonicated the final solution for 15 min and recorded the luminescence spectrum.
D. White light emission
ZnO nanoparticles with an average size of 5 nm were prepared by the procedure described in the literature. Reference Pacholski, Kornowski and Weller29 Aqueous dispersion of ZnO (conc. 1 mg/mL) was made by 1-h sonication. Different amounts of aqueous N-CQD solution (0.1–1.2 mL) were mixed with 3 mL dispersion of ZnO, sonicated for 15 min, and PL emission was recorded at an excitation wave length of 325 nm. Aqueous GO solution was prepared by constant sonication for 1 h. N-CQDs were admixed (0.05 mL, 0.1 mL) with 3 mL GO solution, sonicated for 15 min, and PL emission was recorded at an excitation wave length of 350 nm.
E. Photodgradation
Photodegradation of methylene blue (MB) was monitored using absorption measurement. In a typical measurement, 5 mL of N-CQDs was mixed with 10 ppm of aqueous MB solution (5 mL), transferred to a quartz vessel, and stirred under dark for 30 min. Under vigorous stirring, the reaction vessel was exposed to 300-W xenon lamp (equipped with λ < 400-nm cutoff filter) which was placed 12 cm away from the reaction vessel. Reaction was monitored by recording the changes in absorption of MB (at absorption maxima 664 nm) at each 5-min interval. The same experiments were carried out with as prepared CQDs for comparison.
III. RESULTS AND DISCUSSION
Urea is known to release NH3 upon heating, and this reaction helps to incorporate nitrogen in the carbon matrix of graphene.23−27,Reference Sun, Wang, Tian, Tan, Xie, Shi, Li and Fu30 In the present study, hydrothermal conditions with high autogenous pressure and temperature or MW irradiation with localized superheating enable the rapid dehydration of glucose in the presence of NH3 released by the decomposition of urea, to form N-CQDs with high nitrogen content. Reference Walton31 Generally, C–N bond formation occurs in the nucleation step, followed by further carbonization and growth to generate N-CQDs. Reference Ma, Ming, Huang, Liu and Kang19,Reference Tang, Ji, Cao, Lin, Jiang, Li, Teng, Luk, Zeng, Hao and Lau32 Moreover, ammonia acts as both the N-dopant as well as a surface passivator without the addition of any external capping agent. Reference Zhai, Zhang, Liu, Bai, Li, Dai and Liu20 Interestingly, in the absence of urea, carbonization of glucose does not occur under the same reaction conditions, which is also confirmed by controlled PL and TEM studies. Previously, CQDs are formed at 150 °C by the decomposition of carbohydrate after much longer reaction times. Reference De and Karak33 The rapid formation of N-CQDs in the present synthesis may be due to the presence of ammonium and hydroxyl ions from aqueous ammonia, which are known to catalyze the carbonization of carbohydrates. Reference Wang, Qu, Xu, Ren and Qu28,Reference Yu, Cui, Li, Li, Yu, Antonietti and Colfen34
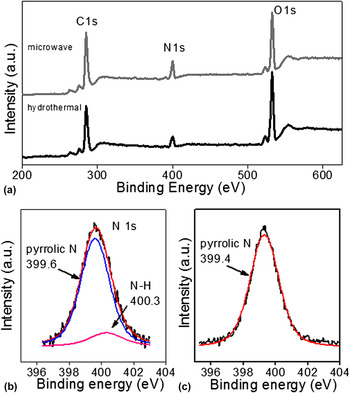
XPS measurements were carried out to establish the elemental composition of N-CQDs (Fig. 1). The survey scan spectrum indicates a pronounced N 1s peak at ∼399.5 eV, a predominant C 1s peak at ∼284 eV, and an O 1s peak at 532 eV (Fig. 1), which indeed confirms the successful formation of N-CQDs by both hydrothermal reaction and MW irradiation. The N/C atomic ratio was calculated to be ∼18% for hydrothermally produced N-CQDs, whereas for MW synthesis, it is ∼22%, which is higher than that of previously reported N-CQDs. Reference Zhang, Ma, Zhuang, Zhang, Chen, Hong, Yan, K.Yu and Huang17,Reference Ma, Ming, Huang, Liu and Kang19,Reference Li, Zhang, Dai and Li22 The high resolution N 1s spectrum of N-CQDs synthesized by the hydrothermal method reveals the presence of both pyrrolic (399.6 eV) and N–H like (400.3 eV) N atoms [Fig. 1(b)], whereas the N-CQDs formed under MW irradiation show only pyrrolic N at 399.4 eV [Fig. 1(c)]. In addition, the high resolution C 1s spectrum of N-CQDs further confirms the presence of C–C (284.5 eV), C–O (288.3 eV), and most importantly C–N (285.8 eV) bonds (Fig. SI, supporting information). Fourier transform infrared (FTIR) spectra demonstrate the presence stretching vibrations of N–H (from 3500 to 3150 cm−1), C=C (1604 cm−1), and aromatic C–N heterocycles (from 1500 to 1150 cm−1) (Fig. SII, supporting information). Reference Zhang, Ma, Zhuang, Zhang, Chen, Hong, Yan, K.Yu and Huang17 The predominant presence of C compared to N was further confirmed by elemental analysis which shows the N content to be comparable with XPS results (Table SI, supporting information).
(a) X-ray photoelectron survey spectra of N-CQDs prepared by hydrothermal and microwave methods. N 1s signal of N-CQDs prepared by (b) hydrothermal and (c) MW methods.

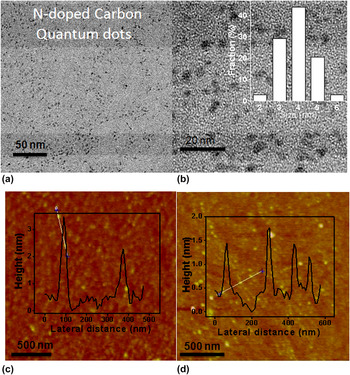
We have characterized the N-CQDs by TEM and AFM (Fig. 2). Figure 2(a) and its inset show the TEM images of N-CQDs synthesized by hydrothermal reaction and MW irradiation, respectively. In Fig. 2(b), high-magnification TEM images show a relatively narrow size distribution (3–5 nm) of hydrothermally prepared N-CQDs with an average diameter of ∼4 nm. N-CQDs synthesized by MW irradiation have the average diameter of ∼4.5 nm. Figures 2(c) and 2(d) show typical AFM images of N-CQDs synthesized by hydrothermal and MW irradiation, respectively. The topographic height distributions are in the range of 2–3 and 1–2 nm for N-CQDs synthesized by the hydrothermal and MW treatment, respectively. The respective average heights are ∼2.5 and ∼1.5 nm, which suggest that most of them consist of 1–5 graphene layers.
(a, b) TEM images of N-CQDs prepared by the hydrothermal method with size distribution. AFM images of N-CQDs prepared by (c) hydrothermal and (d) MW methods. Insets show height profiles.

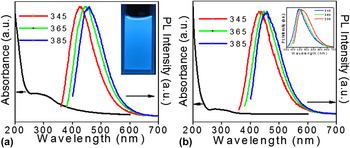
We have recorded absorption and PL spectra of the N-doped CQDs prepared by us (Fig. 3). Typical UV-vis spectra of the N-CQDs synthesized by the two methods show a broad absorption band in the 250- to 350-nm region with a tail extending to the visible region, characteristic of a polycyclic aromatic π system [Figs. 3(a) and 3(b)]. Reference Xie, Huang and Zheng35 PL spectra show an excitation wave length dependent intense PL emission [Figs. 3(a) and 3(b)]. The PL emission band shifts from 428 to 456 nm [Fig. 3(a)] and from 432 to 457 nm [Fig. 3(b)] for N-CQDs synthesized by the hydrothermal and MW methods, respectively, on changing the excitation wave lengths in the range of 345–365 nm. Bright blue light is emitted when N-CQDs are irradiated under UV light [photograph in Fig. 3(a)]. N-CQDs also show strong-excitation dependent down-converted PL emission [see Fig. SIII(b) in supporting information]. The exact origin of the intense PL emission and the mechanism behind its excitation wave length-dependent emission is not understood properly, Reference Li, Kang, Liu and Lee3,Reference Baker and Baker4 although the luminescence is suggested to arise from a π–π* transition, due to emissive traps or free zigzag sites and/or edge states. Reference Li, Kang, Liu and Lee3,Reference Baker and Baker4,Reference Cao, Meziani, Sahu and Sun36 We observe a slight blue-shift in the PL band position of N-CQDs compared to that of undoped CQDs. Reference Li, Zhao, Cheng, Hu, Shi, Dai and Qu37 Similar blue-shifts in the PL emission band of N-CQDs have been reported by Li et al. Reference Li, Zhao, Cheng, Hu, Shi, Dai and Qu37 and Zhang et al. Reference Zhang, Ma, Zhuang, Zhang, Chen, Hong, Yan, K.Yu and Huang17 We have also measured the quantum yield of N-CQDs prepared by both the hydrothermal and MW methods using coumarin 102 as the reference (Table SII, supporting information). The quantum yields of N-CQDs prepared by hydrothermal and MW methods are 0.7 and 1% respectively. Absence of any external surface passivating agent in the as-prepared N-CQDs may be the reason of the low quantum yield, though it is comparable with the values reported in the literature. Reference Qiao, Wang, Gao, Li, Dai, Liu and Huo38−Reference Liu, Ye and Mao40 N-CQDs prepared by the hydrothermal reaction and MW irradiation show PL decay (measured at 385-nm excitation) with average lifetimes of 2.6 and 2.5 ns, respectively (Table SIII, supporting information).
UV-Vis and PL spectra (recorded at different excitation wavelengths) of N-CQDs prepared by (a) hydrothermal and (b) microwave methods. Inset in (a) shows a photographs of N-CQDs illuminated under UV light (b) PL spectra of undoped CQDs.

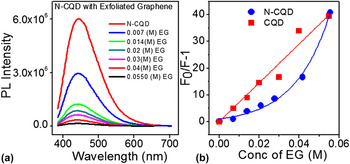
Graphene is reported in the literature to be a good PL quencher for fluorescent dyes, conjugated polymers, and semiconductor dots. Reference Chen, Berciaud, Nuckolls, Heinz and Brus41−Reference Matte, Subrahmanyam, Rao, George and Rao44 The origin of quenching is considered as resonance energy transfer, electron transfer, or dipole–dipole coupling in between graphene and the fluorescent species. Reference Chen, Berciaud, Nuckolls, Heinz and Brus41−Reference Matte, Subrahmanyam, Rao, George and Rao44 Recently, fluorescence resonance energy transfer from amine-functionalized CQDs to reduced graphene oxide has been studied to sense metal ions. Reference Wei, Xu, Ren, Xu and Qu45 We have observed quenching of PL emission of both N-CQDs and pristine CQDs by graphene (Fig. 4). Small size CQDs can easily adsorb on the basal plane of graphene through noncovalent π–π interaction. There can be photoinduced energy transfer from N-doped or undoped CQDs to graphene through the mutual overlap of their π cloud. Besides, the defect sites, emissive traps, dangling bonds, and functional moieties present in the CQDs and graphene surface may be expected to play a role as the PL quencher of CQDs. A linear Stern–Volmer plot has been observed in the case of pristine CQDs upon interaction with graphene unlike the case of N-CQDs which shows positive deviation from linearity [Fig. 4(b)]. The linear Stern–Volmer plot in the case of CQDs indicates dynamic quenching, whereas the nonlinear curve observed in the case of N-CQDs suggests that the quenching process follows both static and dynamic energy transfer. Reference Airinei, Tigoianu, Rusu and Dorohoi46,Reference Lakowicz47 The quenching rate constants (k q) for both CQDs and N-CQDs are similar (Table SIV, supporting information).
(a) PL emission spectra (365-nm excitation) and (b) Stern–Volmer plots for quenching of luminescence of N-CQDs and undoped CQDs in ethanol in the presence of exfoliated graphene.

We have examined the quenching of PL of the CQDs in the presence of N,N-dimethyl aniline, which is known to be an excellent fluorescence quencher (Fig. SIV, supporting information). The k q values obtained from the linear Stern–Volmer plots are in the range of 109 M−1 s−1, which agrees well with the literature reported values. Reference Wang, Cao, Lu, Meziani, Heting, Gang, Bing, Harruff, Kermarrec and Sun48 The exact mechanism of the interaction of all these quenchers with undoped and N-doped CQDs is not fully understood and needs further investigation.
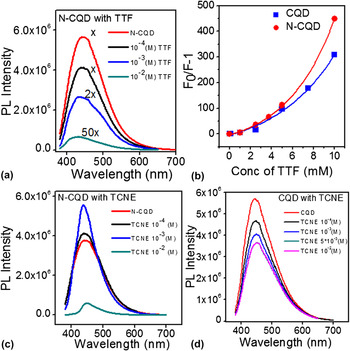
Tetrathiafulvalene (TTF) and tetracyanoethylene (TCNE) are known for their charge transfer interaction with aromatics including graphene. Reference Voggu, Das, Rout and Rao49,Reference Rao and Voggu50 In the case of undoped and N-doped CQDs, electron-donating TTF shows significant quenching of luminescence [Fig. 5(a)]. We observe a nonlinear Stern–Volmer plot [Fig. 5(b)] with a quenching constant of 6.1 × 10¹² and 2.6 × 10¹² M−1 s−1 for N-doped and undoped CQDs, respectively (Table SIV, supporting information). The high values of quenching constant indicate a possible binding interaction between the fluorophore and the quencher. Reference Lakowicz47 Unlike TTF, electron-accepting TCNE interacts differently with N-doped and undoped CQDs [Figs. 5(c) and 5(d)]. Undoped CQDs show a gradual decrease in luminescence on increasing the TCNE concentration, whereas N-doped CQDs show enhancement in the PL intensity up to a moderate concentration of TCNE [Fig. 5(c)]. A decrease in the full-width-half-maximum (FWHM) of the PL band occurs on addition of TCNE to N-CQDs. To understand this behavior, we have deconvoluted the broad PL emission spectrum into multiple Gaussian functions, which indicate the presence of more than one emissive site (Fig. SV, supporting information). Reference Yu, Wen, Toh and Tang51 The initial addition of TCNE (1 mM) may quench surface-related emission (bands 2 and 3 in Fig. SV) of N-CQDs resulting in a decrease in the FWHM of the PL band. The quenching of surface-related emission increases the core-related emission intensity [Fig. 5(c)]. We speculate that the electron acceptor TCNE occupies some of the surface-emissive sites containing N-atoms in the CQD lattice. At high concentrations of TCNE, sharp quenching in PL emission along with the red shift in PL suggests agglomeration of N-CQDs or chemical reaction. Reference Dey, Das, Voggu, Nag, Sarma and Rao52 We note that specific interaction of TCNE with N-CQDs is to be expected since these CQDs can act as electron donors while TCNE is an electron acceptor.
PL emission spectra (365-nm excitation) of N-CQDs in ethanol in the presence of (a) TTF and (c) TCNE and of (d) undoped CQDs in the presence of TCNE. (b) Stern–Volmer plots for the quenching of luminescence in the presence of TTF in ethanol.

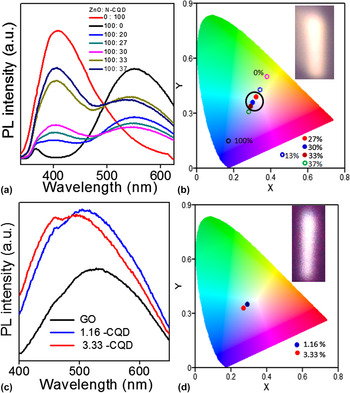
Defects in ZnO give rise to a characteristic broad emission in the green–yellow region. A combination of blue-light-emitting materials with ZnO or graphene oxide (GO) to generate white light is reported in the literature. Reference Kumar, Panchakarla, Bhat, Maitra, Subrahmanyam and Rao53−Reference Son, Kwon, Park, Seo, Yi, Angadi, Lee and Choi55 There are reports where CQDs or N-CQDs have been used as color converters to emit white light from blue LEDs. Reference Walton31,Reference Kwon, Do, Lee, Hwang, Kim and Rhee56 We find that admixing N-CQDs with ZnO in proper proportions gives rise to white light emission (Fig. 6). In Fig. 6(a), we show typical PL spectra of ZnO with different amounts of N-CQDs. ZnO shows a broad defect-related emission in the visible region centered around 550 nm. As the amount of N-CQDs increases, the PL emission spectrum covers the entire visible region. The PL spectra corresponding to 27%, 30%, and 33% of N-CQDs mixed with ZnO (v/v) have CIE coordinates of (0.32, 0.39), (0.30, 0.36), and (0.29, 0.34) respectively, which are in the white region of the CIE (Commission Internationale de L’Eclairaged) 1931 diagram [Fig. 6(b), light] (excitation 325 nm). In Fig. 6(c), we show the proper admixture of yellow-emitting filled balls marked by a circle. 57 In the inset of Fig. 6(b), we have presented the photograph of emitted white graphene oxide (GO) with blue-emitting N-CQDs and also shows white light emission [inset of Fig. 6(c)] with CIE coordinates of (0.29, 0.35) and (0.27, 0.33) [Fig. 6(d)].
PL spectra of (a) ZnO + N-CQDs mixture and (c) graphene oxide + N-CQDs mixture in water (excitation 325 and 350 nm, respectively). CIE 1931 color diagrams for the admixture of N-CQDs with (b) ZnO and (d) GO. Filled dots indicate the compositions close to white light emission. Inset shows the photograph of the white light emitted.

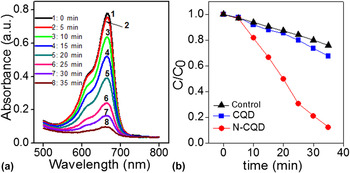
We have studied the catalytic activity of the CQDs for the photodegradation of methylene blue (MB) under visible light irradiation (Fig. 7). Figure 7(a) shows the time-dependent changes in the absorbance of MB under visible light irradiation. We observe that in the presence of N-CQDs almost complete degradation (∼88%) of MB is achieved upon irradiation for 30 min [Fig. 7(b)], whereas in the presence of pristine CQD, MB degrades only up to 32% [Fig. 7(b)]. MB undergoes negligible self-degradation (24%) under visible light (control experiment). The rate constants (k) of degradation of MB in the presence of N-CQDs and undoped CQDs were calculated using the Langmuir–Hinshelwood rate equation (supporting information). The values of k for N-doped and undoped CQDs are 0.048 and 0.009 min−1 respectively. Clearly, N-CQDs are more effective in the photodegradation of MB than undoped CQDs. Such superior performance in the photodegradation of methyl orange has been noted in the case of N-CQDs. Reference Ma, Ming, Huang, Liu and Kang19 N-doping can generate local disordered structure and can affect the local electronic structure of CQDs, which favors the formation of transient intermediates by enhancing the binding of ions present in solution and results in the formation of active OH·, which is responsible for photodegredation of the dye. Reference Li, Zhao, Cheng, Hu, Shi, Dai and Qu37,58−61 We should note that N-CQDs would be n-type semiconductors unlike undoped CQDs.
(a) Absorption spectra of methylene blue on interaction with N-CQDs at different irradiation times. (b) Photocatalytic degradation of MB (normalized concentration) with the irradiation time in the presence of undoped and N-doped CQDs.

IV. CONCLUSIONS
In conclusion, we have synthesized N-CQDs of 2- to 5-nm diameter and high N content by hydrothermal reaction as well as by MW irradiation of glucose in the presence of urea. Here, glucose acts as the carbon source, whereas urea decomposes to release NH3. Besides comparing the PL property of N-CQDs with that of pristine CQDs, we have investigated the quenching of PL by graphene, with nonlinear Stern–Volmer plots which suggest that the quenching process involves both static and dynamic energy transfer. Unlike electron-donating tetrathiafulvalene, electron-withdrawing tetracyanoethylene (TCNE) interacts differently with N-CQDs. This is likely because the N-doped quantum dots are n-type conductors. N-CQDs also exhibit enhanced activity for the photodegradation of methylene blue dye. It is noteworthy that white light emission can be obtained by mixing the blue-light emitting CQDs with yellow light emitters such as ZnO nanoparticles or graphene oxide.
Supplementary Material
Supplementary materials can be viewed in this issue of the Journal of Materials Research by visiting http://journals.cambridge.org/jmr.
ACKNOWLEDGMENTS
S. Dey thanks CSIR for a fellowship. K. Biswas greatly appreciates the support of the DST Ramanujan fellowship.