Implications
Fermentation of a heat-treated wheat/barley-based diet with microbial phytase seems to provide a great potential for improvements in apparent total tract digestibility (ATTD) of plant phosphorus (P), and thereby a potential for complete elimination of inorganic P supplementation resulting in reductions in P excretion. Likewise, it would be interesting to study whether fermentation of a non-heat-treated wheat/barley-based diet will improve ATTD of plant P to the same extent, as did the fermentation of the heat-treated diet with microbial phytase in this study.
Introduction
Phytate (myo-inositol hexakisphosphate, InsP6), the main storage form of phosphorus (P) in plant feedstuffs, is poorly digested by pigs (Eeckhout and De Paepe, Reference Eeckhout and De Paepe1994; Steiner et al., Reference Steiner, Mosenthin, Zimmermann, Greiner and Roth2007). Major efforts have therefore been made to improve the apparent total tract digestibility (ATTD) of InsP6–P in pig diets by means of microbial phytase. However, cereals like rye, triticale, wheat and to a lesser extent barley also contain high phytase activities (Eeckhout and De Paepe, Reference Eeckhout and De Paepe1994; Zimmermann et al., Reference Zimmermann, Lantzsch, Langbein and Drochner2002; Steiner et al., Reference Steiner, Mosenthin, Zimmermann, Greiner and Roth2007). In Northern Europe, wheat and barley are typical constituents of pig diets that are prepared on the farm as meal (non-heat-treated) or on commercial plants as pellets requiring heat-treatment, often at temperatures above 81°C. The ATTD of plant P in a non-heat-treated wheat/barley-based diet, fed dry and without any inorganic P is about 40% to 60% (depending on the relative inclusion of wheat and barley and cultivars of cereals), whereas ATTD of plant P decreases to about 30% to 50% in heat-treated diets depending on the extent of inactivation of plant phytase (Jongbloed and Kemme, Reference Jongbloed and Kemme1990; Skoglund et al., Reference Skoglund, Larsen and Sandberg1997b; Poulsen and Johansen, Reference Poulsen and Johansen2004). Addition of microbial phytase to dry fed wheat/barley-based diets (heat-treated or not) for growing–finishing pigs only increases ATTD of plant P to a maximum of 60% to 65% (e.g. Näsi and Helander, Reference Näsi and Helander1994; Poulsen et al., Reference Poulsen, Blaabjerg and Feuerstein2007; Kim et al., Reference Kim, Sands, Mullan and Pluske2008). Liquid feeding systems may, however, result in further improvements in ATTD of plant P compared with traditional dry feeding systems, because these systems may function as a kind of ‘pre-digestion’ before feeding. The proximal part of the small intestine is the main site for phosphate absorption (Moore and Tyler, Reference Moore and Tyler1955; Partridge, Reference Partridge1978). Thus, in theory degradation of InsP6 has to be optimised before digesta enters the small intestine. In dry fed pigs InsP6 is mainly degraded by phytase in the stomach (Kemme et al., Reference Kemme, Jongbloed, Mroz and Beynen1998; Rapp et al., Reference Rapp, Lantzsch and Drochner2001), where the retention time of the diet is limited and thereby the time for InsP6 degradation. On the other hand, when feed and water are mixed before feeding, InsP6 degradation by phytase is initiated (Carlson and Poulsen, Reference Carlson and Poulsen2003; Blaabjerg et al., Reference Blaabjerg, Carlson, Hansen-Møller, Tauson and Poulsen2007), and may continue in the pig’s stomach. Thus, it is hypothesised that the prolonged contact between InsP6 and phytase in liquid feed compared with dry feed will result in an increased InsP6 degradation and an improved ATTD of InsP6–P.
The aim of the study was to investigate the degradation of InsP6 and formation and further degradation of lower inositol phosphates (myo-inositol pentakisphosphate–myo-inositol bisphosphate, InsP5–InsP2) at the terminal ileum and to determine the apparent ileal digestibility/degradability (AID) of P, InsP6–P and calcium (Ca) and ATTD of P and Ca in pigs as affected by the dietary treatments: heating, microbial phytase addition and feeding strategy (dry feeding v. fermented liquid feeding). Formation and degradation of lower inositol phosphates were studied to verify if InsP6 degradation leads to a concurrent accumulation of lower inositol phosphates.
Material and methods
Animal and surgical procedures
Four crossbred castrated male pigs (Large White × Landrace) with an average initial live weight of 42 ± 2 kg were used. The pigs were subjected to surgery after being deprived of feed for 16 h.
The animals were sedated with an intramuscular injection in the neck with a mixture of 1.88 mg tiletaminchdrochlorid, 1.88 mg zolazepamhydrochlorid (Zoletil 50 Vet., Virbac S.A., Cedex, France), 0.38 mg butorphanoltartrat (Fort Dodge Veterinaria S.A., Girona, Spain), 1.88 mg Ketaminhydroclorid (Ketaminol® Vet., Intervet Danmark AS, Skovlunde, Denmark), 1.88 mg xylazin (Rompun® Vet., Bayer Health Care, AG, Animal Health Division, Leverkusen, Germany) per kilogram body weight (BW). After 20 min, the pigs were subjected to general anaesthesia by intravenous injection of 10 mg propofol (Propofol, Frensenius Kabi AB, Uppsala, Sweden) and 25 μg Fentanyl (Haldid™, Janssen Pharmaceutica, Beerse, Belgium) per kilogram BW per hour. Furthermore, the animals were intubated and ventilated with a mixture of O2 : atm air (1 : 1, v/v) and given an intravenous supply of isotonic NaCl-solution during surgery.
Each pig was fitted surgically with a T-shaped cannula for total collection from the ileum at a location of about 15 cm anterior to the ileal-caecal junction on the right flank. The inserted tube fitted tightly to the inner wall of the small intestine and permitted digesta only to pass through the tube. To prevent digesta flow between cannula and intestine a double velour patch fabric designed for use in cardiovascular surgical procedures was formed and sutured around the cannula and intestine (Bach Knudsen and Jørgensen, Reference Bach Knudsen and Jørgensen2007). A tubular cylindrical stopper was inserted inside the outlet of the T-cannula, whereby the total flow of digesta passed through the tubular cylindrical stopper after which it was collected directly. When digesta was not sampled, the outlet of the T-cannula ensured normal passage of digesta.
The pigs were allowed a 14-days post-surgical period to recover and regain full appetite. To alleviate possible post-operative pain, the pigs were given an intramuscular injection in the neck of 10 mg meloxicam per kilogram BW (Metacam®, Boehringer Ingelheim, Labiana Life Sciences S.A., Terrassa, Spain) and 0.3 mg buprenorphinum (Temgesic®, Schering-Plough Europe, Brussels, Belgium) at 8 h intervals for 3 days. The animals were housed in a temperature-controlled room (20°C to 22°C) in individual 4 m2 smooth-walled pens with a rubber mat and no further bedding. The pigs were washed each day with soapy water and smeared with a lanolin-based zinc oxide cream around the cannula to minimise skin irritation. The experimental protocol was approved by the Ministry of Justice, Danish Animal Inspectorate, Copenhagen, Denmark.
Experimental design and housing
The experiment was designed as a 4 × 4 Latin square with four pigs fed four different diets during 8 consecutive weeks. Each experimental period lasted for 2 weeks: 8 days of adaptation, followed by 3 days of total collection of faeces and 3 days of total collection of ileal digesta. The pigs were housed in the same 4 m2 pens during the adaptation period as used during the post-surgical period, whereas they were housed in individual stainless-steel metabolic crates during the sampling period.
Experimental diets and feeding
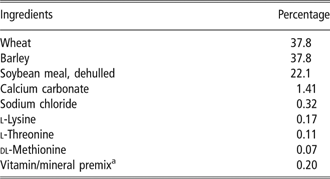
A basal diet was formulated (Table 1) to meet the current Danish recommendations for growing–finishing pigs (45 to 105 kg) except for P as no inorganic P was added. Calcium was adjusted by supplementing calcium carbonate to meet a concentration of 6.8 g/kg as fed. Chromic oxide (Cr2O3) was included in the diet at 0.5 g/kg as fed as an indigestible marker.
Composition of the basal diet
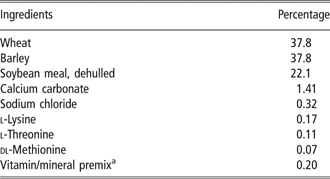
aProviding per kilogram : 50 mg iron; 80 mg zinc; 27.7 mg manganese; 20 mg copper; 0.2 mg iodine; 0.3 mg selenium; 60 mg α-tocopherol; 2.2 mg vitamin K3; 2.2 mg vitamin B1; 4 mg vitamin B2; 3.3 mg vitamin B6; 11 mg d-pantotenic acid; 22 mg niacin; 0.06 mg biotin; 0.02 mg vitamin B12; 4400 IU vitamin A; 1000 IU vitamin D3.
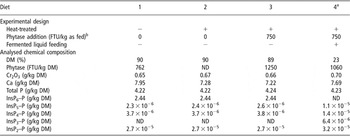
The basal diet was ground and three quarters of the batch were steam-pelleted at about 90°C. Then the pellets were crunched and supplemented with 0 or 750 FTU/kg as fed (powder, Aspergillus niger, Natuphos 5000, BASF, 3 phytase (EC 3.1.3.38)). The four diets are presented in Table 2. Diet 4 was prepared as fermented liquid feed by mixing feed and water (20°C) in the ratio 1 : 2.75 (w/w) in a closed tank kept at a room temperature of about 20°C. The mixture was stirred for 30 s every half an hour (day and night). At each feeding (0800 and 1430 h), 50% of the content was removed from the tank and replaced by an equal amount of fresh feed and water. Consequently, the liquid diet was fermented for 17.5 h (night time) and 6.5 h (daytime) before it was fed to the pigs in the morning and afternoon, respectively. All ileal samples were collected after feeding the morning meal. To initiate the fermentation process, the 50% feeding change was not made until 3 days after fermentation and feeding started at day 5. The dry diets (diets 1, 2 and 3) were mixed with water (10°C) at a ratio of 1 : 2.75 (w : w) immediately before feeding, whereas no water was added to the fermented liquid feed. During the collection period, the pigs had no access to water between feedings, whereas during the adaptation period, additional water was available ad libitum. The pigs were fed the same diet for 2 weeks with two equal daily portions at 0800 and 1430 h. The daily feed intake was 800, 900, 1000 and 1100 g during period 1, 2, 3 and 4, respectively.
Experimental design and analysed chemical composition of the diets (mean; n = 3 for diet 1, 2, 3 and n = 4 for diet 4)

ND = not detectable.
aChemical composition of the fermented liquid diet after 17.5 h of fermentation.
bAspergillus niger, Natuphos, BASF.
To determine whether the collected ileal digesta originated from the morning or afternoon meal, carminic acid (1 g/kg as fed) (C22H20O13, Natural Red 4, Sigma-Aldrich, EEC Number 215-023-3) was added to the morning meal during each period at the last day of ileal digesta collection. Carminic acid is an indigestible marker which colours the digesta, whereby it is possible to visually follow the arrival of a particular meal at the ileal cannula (Bacon, Reference Bacon1980).
Collection of faeces and ileal digesta
Faeces were collected twice daily for 3 days and stored at +4°C. At the end of the collection period, the total amount of faeces for each pig was mixed and representative samples were taken. The ileal digesta was collected during three consecutive days (0800 to 1600 h) during four consecutive time intervals: 0800 to 1000, 1000 to 1200, 1200 to 1400 and 1400 to 1600 h. The collection was initiated when the pigs were fed the morning meal and was performed by leading the digesta from the outlet of the T-cannula through a tube-formed plastic bag attached to the cannula with a clamp. As soon as the digesta became visible, it was pressed down by hand to the closed end of the plastic bag, which was placed on ice to cool the digesta immediately to stop further degradation. After each collection time interval (2 h), digesta was weighed, mixed and pH-measured. To collect one representative sample for analyses the same relative amount of collected digesta was sampled on each of the 3 days in the same container and frozen. This procedure was carried out for each of the individual time intervals.
Analyses
All analyses were performed in duplicate. The samples of diets, faeces and ileal digesta were analysed for dry matter (DM), P, Ca and Cr2O3. DM was determined after freeze-drying. Phosphorus was analysed by the vanadomolybdate colorimetric procedure (Stuffins, Reference Stuffins1967) and Ca by atomic absorption spectrophotometry (Atomic Absorption System SP9, Pye Unicam Ltd, Cambridge, CB12 PX, UK). Analyses of Cr2O3 were performed on wet materials as described by Schurch et al. (Reference Schurch, Lloyd and Crampton1950). In addition, diets and ileal digesta were analysed for inositol phosphates (InsP6–InsP2) according to Blaabjerg et al. (Reference Blaabjerg, Hansen-Møller and Poulsen2010). Finally, the diets were assayed for phytase activity by the method of Engelen et al. (Reference Engelen, Vanderheeft, Randsdorp and Smit Ed1994), where one FTU is the amount of enzyme which liberates 1 μmol inorganic orthophosphate per minute from 0.0051 mol/l sodium phytate at pH 5.5°C and 37°C.
Every second week, the pH and temperature of the fermented liquid diet fed in the morning were measured and a sample was taken to analyse the concentrations of DM, Ca, P, InsP6–InsP2–P and phytase activity as described above. In addition, concentrations of short-chain fatty acids (SCFA), lactic acid and succinic acid were measured by the method of Jensen et al. (Reference Jensen, Cox and Jensen1995) with some modifications as described by Canibe et al. (Reference Canibe, Højberg, Badsberg and Jensen2007). Ethanol was determined according to Beutler (Reference Beutler1984).
Calculations
The recovery of Cr2O3 in ileal digesta was calculated for each time interval as:

where DMrecov (kg) is the amount of DM recovered from the ileum during the specific time intervals, Crileum is the concentration of Cr2O3 (g/kg DM) in the recovered dry matter, DMdiet (kg) is the amount of ingested DM and Crdiet is the concentration of Cr2O3 (g/kg DM) in the diet (morning meal).
The AID of dietary nutrients (X) based on Cr2O3 for each time interval and the ATTD of X based on Cr2O3 (ATTDCr) and total collection of faeces (ATTDTotal) were calculated as:

X diet and Crdiet are the concentration of X and Cr2O3 (g/kg DM) in the diet, respectively. X ileal and Crileal are the concentrations of X and Cr2O3 (g/kg DM) in the ileal digesta during the specific time intervals. X faeces and Crfaeces are the concentrations of X and Cr2O3 (g/kg DM) in the faeces. DMfaeces (kg) is the amount of DM collected in the faeces and DMdiet (kg) is the amount of ingested DM (morning meal).
Statistical analysis
Statistical analyses were carried out by the MIXED procedure of SAS version 9.1 (SAS Institute Inc., 2004). Effects were considered significant when P ≤ 0.05. The results presented are least square means (LS means). Standard error of mean is given as a measure for variance.
All results except for ATTD were analysed by the following model:

where Yijkl is the dependent variable; μ the overall mean; αi the fixed effect of diet, i = 1, 2, 3, 4; βj the fixed effect of time, j = 1, 2, 3, 4; αβij the diet and time interaction; γk the fixed effect of period, k = 1, 2, 3, 4; βγjk the time and period interaction; Ulk animal within period was used as repeated measure and the autoregressive order 1 covariance structure (AR 1 process) was fitted, assuming correlations being larger for nearby than far-apart measurements (Littell et al., Reference Littell, Henry and Ammerman1998). Assuming that Ulk∼N(0, σ 2U) and εijkl ∼ N(0, σ 2ε).
Results on ATTD were analysed by the following model:

where Yijl is the dependent variable; μ the overall mean, αi the fixed effect of diet, i = 1, 2, 3, 4; βj the fixed effect of period, j = 1, 2, 3, 4. Assuming that N(0, σ 2ε).
Results
Diets
The analysed chemical composition of the experimental diets is presented in Table 2. The concentrations of Cr2O3 and P were the same in all diets, whereas the Ca concentration differed a little between the diets. The concentrations of InsP6–P, InsP5–P, InsP4–P, InsP3–P and InsP2–P did not differ between dry diets (diets 1, 2 and 3) where InsP6–P averaged about 60% of P, whereas InsP5–InsP2–P averaged about 0.0008% of P (Table 2). In the fermented liquid diet (diet 4) InsP6–P was not present and InsP5–InsP2–P averaged about 0.0015% of P. The non-heat-treated diet (diet 1) showed a considerable plant phytase activity, whereas plant phytase activity of diet 2 was not detectable (below 50 FTU/kg DM) because of heat-treatment. Addition of microbial phytase to the heat-treated diet (diet 3) increased phytase activity markedly, and this activity was reduced by 15% in the fermented liquid diet (diet 4) after 17.5 h of fermentation.
The pH and temperature of the fermented liquid diet were 4.7 ± 0.2 and 22°C±1, respectively, just after addition of fresh feed and water in the afternoon (1430 h) and 4.2 ± 0.1 and 23°C ± 1, respectively, in the morning at feeding (0800 h) (n = 4). The average concentrations of lactic acid, acetic acid, succinic acid and ethanol were 168 ± 17.5, 21 ± 1.9, 1.9 ± 0.4 and 46 ± 17.6 mmol/kg as fed in the fermented liquid diet after 17.5 h of fermentation (n = 4).
Appearance of carminic acid and recovery of chromic oxide in ileal digesta
On the third day of ileal collection, the morning meal was coloured deeply red by addition of carminic acid, whereby the digesta was much darker than when no carminic acid was added. In general, the coloured digesta became visible at the ileum between 1 and 2 h after feeding suggesting that digesta collected from 0 to 2 h after feeding originated from the afternoon meal or was a mix of the afternoon and morning meals. Assuming this, the effects of the dietary treatments were studied at each time interval and summarised from 0 to 8 h and from 2 to 8 h after feeding. After 8 h of collection, the ileal digesta was still coloured dark by carminic acid indicating that more than 8 h are required before all of the morning meal has passed the end of the small intestine.
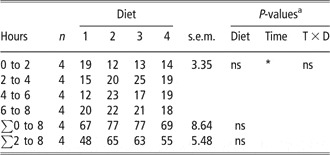
The recovery of Cr2O3 did not differ between diets, but was significantly influenced by time (Table 3). Except for the non-heat-treated diet (diet 1), the recovery was lowest at 0 to 2 h after which it increased to about 20% of intake during the following time intervals. The accumulated recovery of Cr2O3 amounted to 67% to 77% (0 to 8 h) and 48% to 65% (2 to 8 h) and was not affected by the diet.
Recovery of chromic oxide (Cr2O3) in ileal digesta as percentage of intake after feeding (LS means)

LS means = Least square means; ns = non significant.
aP-values shown on the line 0 to 2 h represent the time intervals 0 to 2, 2 to 4, 4 to 6 and 6 to 8 h.
ns = P > 0.05; *P ⩽ 0.05; **P ⩽ 0.01; ***P ⩽ 0.001.
The pH in ileal digesta
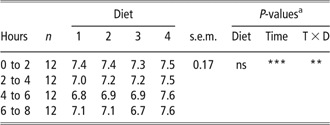
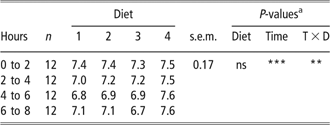
The pH in ileal digesta was affected by the interaction between diet and time (Table 4). At all time intervals, the ileal pH was higher in pigs fed the fermented liquid diet (diet 4) compared with pigs fed the dry diets (diets 1, 2 and 3). Moreover, the ileal pH did not change with time after feeding in fermented liquid fed pigs, whereas the ileal pH decreased with time after feeding in dry fed pigs.
The pH in ileal digesta after feeding (LS means)
LS means = Least square means; ns = non-significant.
aP-values shown on the line 0 to 2 h represent the time intervals 0 to 2, 2 to 4, 4 to 6 and 6 to 8 h.
ns = P > 0.05; *P ⩽ 0.05; **P ⩽ 0.01; ***P ⩽ 0.001.
Concentrations of nutrients in ileal digesta
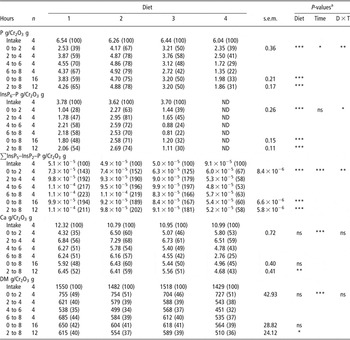
For all diets concentrations of P, InsP6–P and Ca in ileal digesta were higher from 2 to 8 h than from 0 to 2 h (Table 5). The P concentration was significantly affected by the interaction between diet and time. In general, the P concentration was lowest for diet 4 (fermented liquid diet) followed by diets 3, 1 and 2 (dry diets). This clearly reflects the ileal InsP6–P concentration, which was not detectable in pigs fed the fermented liquid diet and decreased with increasing dietary levels of plant or microbial phytase in pigs fed the dry diets. Additionally, the Ca concentration almost mirrors the changes in the P concentration. The total ileal InsP5–InsP2–P concentration was significantly influenced by the diet and time interaction (Table 5). For all diets and time intervals the ileal InsP5–InsP2–P concentration was small and amounted to <0.01% of InsP6–P in dry fed pigs. Within all time intervals, the InsP5–InsP2–P concentration was lower in pigs fed the fermented liquid diet (diet 4) compared with the dry diets of which the InsP5–InsP2–P concentration was highest for diet 1 (non-heat-treated), in-between for diet 2 (heat-treated) and lowest for diet 3 (heat-treated with phytase).
Concentrations of phosphorus (P), myo-inositol hexakisphosphate P (InsP6–P), myo-inositol pentakisphosphate–myo-inositol bisphosphate P (InsP5–InsP2–P), calcium (Ca) and dry matter (DM) per g Cr2O3 (chromic oxide) in diets and ileal digesta after feeding (LS means). In brackets: concentration of the nutrient in ileal digesta relative to the concentration in the diet

LS means = Least square means; ND = not detectable; ns = non-significant.
aP-values shown on the line 0 to 2 h represent the time intervals 0 to 2, 2 to 4, 4 to 6 and 6 to 8 h.
ns = P > 0.05; *P ⩽ 0.05; **P ⩽ 0.01; ***P ⩽ 0.001.
The concentrations of the lower inositol phosphates in ileal digesta were almost constant for the fermented liquid diet (diet 4), while the concentration generally increased with time after feeding for the dry diets (diets 1, 2 and 3) reflecting the breakdown of InsP6–P (Figure 1). The InsP5–P concentration was approximately the same for diets 1 and 2, lower for diet 3 and not present for diet 4. The InsP4–P concentration decreased with increasing diet number and the InsP3–P concentration was highest for diet 3 followed by diets 1, 2 and 4. Of all the lower inositol phosphates, the InsP2–P concentration showed in general the highest concentration for all diets. The InsP2–P concentration was approximately the same for diets 1 and 2 and slightly lower than the concentration for diets 3 and 4.
Concentration of myo-inositol pentakisphosphate (InsP5–P) (----○----), myo-inositol tetrakisphosphate (InsP4–P) (----▪----), myo-inositol trisphosphate (InsP3–P) (----▴----) and myo-inositol bisphosphate (InsP2–P) (---- ----) (g × 10−6/g Cr2O3) in ileal digesta after feeding in pigs fed diet 1 (dry, non-heat-treated), diet 2 (dry, heat-treated), diet 3 (dry, heat-treated with 750 FTU/kg as fed) and diet 4 (liquid, heat-treated with 750 FTU/kg as fed) (LS means; n = 4).

The ileal DM concentration was significantly affected by time, but did not differ between diets (Table 5) although there seems to be a tendency to a lower DM concentration in fermented liquid fed pigs (diet 4). The DM concentration was highest from 0 to 2 h and lowest from 4 to 6 h.
AID and total tract digestibility of nutrients
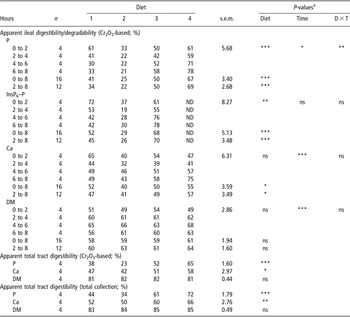
The AID of P was significantly affected by the interaction between diet and time as the differences between the diets increased with time after feeding (Table 6). For all diets, AID of P was higher from 0 to 2 h than from 2 to 4 h after which the AID of P declined for diet 1, increased for diets 3 and 4, and remained constant for diet 2. The overall AID of P from 0 to 8 h and from 2 to 8 h was greatest for diet 4 followed by diets 3, 1 and 2. The AID of InsP6–P almost mirrored the AID of P and was significantly affected by the impact of the diet reflecting the different levels of dietary phytase activity.
Apparent ileal digestibility/degradability of phosphorus (P), myo-inositol hexakisphosphate P (InsP6–P), calcium (Ca) and dry matter (DM) (%) after feeding. Apparent total tract digestibility of P, Ca and DM (%) determined by means of chromic oxide (Cr2O3) (ATTDCr) or total collection of faeces (ATTDTotal), (LS means)

LS means = Least square means; ns = non-significant.
aP-values shown on the line 0 to 2 h represent the time intervals 0 to 2, 2 to 4, 4 to 6 and 6 to 8 h. ns = P > 0.05; *P ⩽ 0.05; **P ⩽ 0.01; ***P ⩽ 0.001.
The AID of Ca was significantly influenced by time, but not by diet (Table 6). For all diets, AID of Ca was higher from 0 to 2 h than from 2 to 4 h after which the AID of Ca increased. The overall AID of Ca from 0 to 8 h and from 2 to 8 h was affected by the diet and was greatest for diet 4, in-between for diets 1 and 3, and lowest for diet 2. Also AID of DM was significantly affected by time but not by diet, although AID of DM in general appeared to be highest for the fermented liquid diet (diet 4). For all diets AID of DM was lowest from 0 to 2 h and highest from 4 to 6 h resulting in a slightly lower overall AID of DM from 0 to 8 h compared with 2 to 8 h.
ATTDCr determined by means of Cr2O3 was lower compared with the corresponding ATTDTotal determined by means of total collection of faeces (Table 6). Irrespective of the method, ATTD of P and Ca was affected by the diet, whereas ATTD of DM did not differ among diets. ATTD of P and Ca was highest for diet 4 followed by diets 3, 1 and 2. The differences between treatments (percentage units) were slightly larger for ATTDCr compared with ATTDTotal.
Discussion
Addition of microbial phytase to the heat-treated diet containing no detectable plant phytase resulted in a higher phytase activity than planned. This may be due to analytical uncertainties or because the activity of the phytase product might have been higher than declared. Microbial phytase was rather stable during the fermentation process and the loss was only 15%. Likewise, no reduction in microbial phytase activity was seen during soaking at 20°C for 24 h (Carlson and Poulsen, Reference Carlson and Poulsen2003; Blaabjerg et al., submitted (a)). The complete InsP6 degradation and the very low concentration of InsP5–InsP2–P in the fermented diet agree with results by Lyberg et al. (Reference Lyberg, Lundh, Pedersen and Lindberg2006) and (Reference Lyberg, Olstorpe, Passoth, Schnürer and Lindberg2008) showing that fermentation is an efficient way to degrade InsP6. On the other hand, Denstadli et al. (Reference Denstadli, Vestre, Svihus, Skrede and Storebakken2006) achieved a 76% reduction in InsP6 when a mixture of wheat and defatted soybeans was soaked for 45 min at 45°C. Thus, the fermentation conditions (temperature, time, residual amount in the tank etc.) need to be studied further to save time and energy expenditure. The pH decrease during fermentation of the diet was caused by production of lactic acid and other organic acids and was close to the pH drop observed in similar studies (Canibe and Jensen, Reference Canibe and Jensen2003; Lyberg et al., Reference Lyberg, Lundh, Pedersen and Lindberg2006). The concentrations of SCFA, lactic acid, succinic acid and ethanol were also in the range of earlier reported values (Canibe and Jensen, Reference Canibe and Jensen2003; Canibe et al., Reference Canibe, Højberg, Badsberg and Jensen2007 and Reference Canibe, Miettinen and Jensen2008) and indicate a well-functioning ecosystem in the fermented diet (Canibe et al., Reference Canibe, Miettinen and Jensen2008). A study by Canibe and Jensen (Reference Canibe and Jensen2003) showed that the counts of lactic acids bacteria in the cecum and mid-colon were lower in pigs fed a fermented liquid diet compared with a dry diet probably because of a reduction in available substrates for microbial fermentation in these segments. This may explain the higher pH at the terminal ileum of pigs fed the fermented liquid diet in this study.
The incomplete recovery of ingested Cr2O3 within 8 h after feeding corresponds with digesta still being coloured by carminic acid 8 h post-feeding. In addition, the lower AID of P, InsP6–P and Ca from 2 to 4 h compared with from 0 to 2 h corresponds with the carminic acid flow showing that the retention time of digesta collected from 2 to 4 h was much shorter than from 0 to 2 h as this digesta partly or completely originated from the former afternoon meal. Interestingly, the ileal DM concentration was higher and AID of DM was lower in digesta from 0 to 2 h than from 2 to 4 h, which may be because this DM being more indigestible.
The higher ATTD values determined by means of total collection compared with chromic oxide demonstrate that the great variation between published results (Johansen and Poulsen, Reference Johansen and Poulsen2003) may to some extent be explained by the use of different methods. Adeola (Reference Adeola2001) also reported higher ATTD values for DM and nitrogen determined by means of total collection compared with chromic oxide. This may indicate that ATTDTotal might in general be overestimated due to incomplete collection of faeces, whereas ATTDCr may be incorrect if the indigestible marker has a different passage rate as the nutrients under investigation. Furthermore, the collection of non-representative samples may also result in incorrect determinations for both ATTDTotal and ATTDCr. In the present study ATTD of the minerals showed considerable differences between the methods, whereas the difference was much smaller for DM. This indicates that sampling and analytical uncertainties might be a bigger problem for the minerals as they are present in much smaller amounts compared with DM.
In general, AID of P and Ca matched ATTDCr of P and Ca confirming that Ca and P absorption primarily takes place in the small intestine (Moore and Tyler, Reference Moore and Tyler1955; Partridge, Reference Partridge1978). Thus, although the collection of ileal digesta was incomplete within 8 h after feeding, it seems that the results were representative for the whole period. The slightly higher AID of P compared with ATTDCr of P in fermented liquid fed pigs may be due to the fact that AID of P solely is based on the morning meal (17.5 h fermentation), whereas ATTD is based on both the morning and afternoon meals (17.5 and 6.5 h fermentation). The AID of DM was approximately 20% units lower than ATTDCr of DM showing that the DM metabolism proceeds after the small intestine.
InsP6 was not present in ileal digesta of fermented liquid fed pigs, whereas the ileal concentration of InsP6–P in pigs fed the three dry diets was closely related to the dietary phytase activity, which agrees with other dry feeding studies (Jongbloed et al., Reference Jongbloed, Mroz and Kemme1992; Skoglund et al., Reference Skoglund, Larsen and Sandberg1997b; Kemme et al., Reference Kemme, Jongbloed, Mroz, Kogut and Beynen1999 and Reference Kemme, Schlemmer, Mroz and Jongbloed2006; Rapp et al., Reference Rapp, Lantzsch and Drochner2001; Schlemmer et al., Reference Schlemmer, Jany, Berk, Schulz and Rechkemmer2001). Consequently, AID and ATTD of P were greatest for pigs fed the fermented diet (diet 4) followed by diets 3, 1 and 2. The negative impact of heat-treatment on AID and ATTD of P is in the range of earlier studies, where wheat or barley dominated diets were steam-pelleted at 80°C to 120°C (Jongbloed and Kemme, Reference Jongbloed and Kemme1990; Skoglund et al., Reference Skoglund, Larsen and Sandberg1997b; Vande Ginste and De Schrijvert, Reference Vande Ginste and De Schrijver1998; Schlemmer et al., Reference Schlemmer, Jany, Berk, Schulz and Rechkemmer2001). The positive impact of fermentation on AID and ATTD of P is in line with results by Lyberg et al. (Reference Lyberg, Lundh, Pedersen and Lindberg2006) using a non-heat-treated wheat/barley-based diet (fermented for 23.5 h at room temperature with 50% residual in the tank). Soaking of wheat/barley-based diets also increases ATTD of P (Näsi et al., Reference Näsi, Helander and Partanen1995; Skoglund et al., Reference Skoglund, Larsen and Sandberg1997b; Lyberg et al., Reference Lyberg, Simonsson and Lindberg2005 and Reference Lyberg, Lundh, Pedersen and Lindberg2006), but the increase seems to be smaller compared with fermentation. This is most likely because of the longer contact time between phytase and InsP6 and the more favourable pH conditions during fermentation.
AID and ATTD of Ca almost mirrored AID and ATTD of P which may be caused by the regulated Ca absorption (Fernandez, Reference Fernandez1995). Therefore, the increase in AID and ATTD of Ca in this study may be indirect as the Ca demand increases to keep pace with the increase in AID and ATTD of P caused by the dietary treatments. In addition, InsP6 forms complexes with cations like Ca2+ (Siener et al., Reference Siener, Heynck and Hesse2001) meaning that any dietary treatment that affects the availability of InsP6 bound P may also affect the Ca availability. The slightly higher AID of DM in pigs fed the fermented diet indicates that fermented liquid feeding may also improve the availability of other nutrients than P and Ca.
InsP6–P degradation taking place prior to feeding (fermented liquid diet) or in the gastrointestinal tract (dry diets) resulted in an extremely small concurrent accumulation of InsP5–InsP2–P. This demonstrates that once the dephosphorylation of InsP6 is initiated, the dephosphorylation of InsP5–InsP2 is rapid which agrees with Rapp et al. (Reference Rapp, Lantzsch and Drochner2001), Kemme et al. (Reference Kemme, Schlemmer, Mroz and Jongbloed2006) and Blaabjerg et al. (submitted (a)). Although the ileal concentration of InsP5–InsP2–P differed between diets, the compounds were considered to be of minor importance for maximization of ATTD of plant P.
It was not possible to detect InsP1 by the method of Blaabjerg et al. (Reference Blaabjerg, Hansen-Møller and Poulsen2010). However, Skoglund et al. (Reference Skoglund, Carlsson and Sandberg1997a) showed that the concentration of InsP1–P was lower than the concentration of the other lower inositol phosphates in ileal digesta. Therefore, the accumulation of InsP1–P was expected to be negligible in this study. According to Greiner and Konietzny (Reference Greiner and Konietzny2006) phosphatases might stimulate the release of phosphate groups from InsP5–InsP1, but this could not be verified in this study as the diets and digesta were not analysed for phosphatases.
Conclusion
In conclusion, heat-treatment (90°C) of the basal diet resulted in a reduction of AID of P, InsP6–P and Ca and ATTD of P and Ca because of inactivation of plant phytase activity. Addition of microbial phytase to the heat-treated diet increased AID of P, InsP6–P and Ca and ATTD of P and Ca, but the increase was greater when the diet was fed as fermented liquid feed compared with dry feed because of complete degradation of InsP6 before feeding. Consequently, it was possible to fulfil the requirement of digestible P in pigs fed the fermented liquid diet without any additions of inorganic P. The accumulation of lower inositol phosphates in ileal digesta of pigs fed the dry or fermented liquid diets was very small, and thus seems to be of minor importance for maximisation of ATTD of plant P.
Acknowledgement
The project was granted by The Danish Food Industry Agency, The Ministry of Food, Agriculture and Fisheries.