


Introduction
The aim of the International Trans-Antarctic Scientific Expedition (ITASE) programme is the study of the spatial variability and evolution over time (last 200 years) of parameters related to the atmospheric system, and recorded in the snowfall and upper layers of the Antarctic ice sheet (Reference MayewskiMayewski and Goodwin, 1999). These data can be used to assess recent environmental changes in the drainage area extending from Dome Concordia (Dome C) to the Ross Sea and the Southern Ocean.
A detailed database is essential for determining the spatial significance of trends in the chemical and isotopic composition of surface snow. This information allows a better understanding of the effects of atmospheric conditions, air mass circulation and the strength and direction of dominant winds on the chemical and isotopic composition of snow. Moreover, such knowledge is essential for interpreting temporal changes in the vertical chemical profiles of deep ice cores drilled in this area. Due to the scarcity of climatological and glaciological data for some interior regions of the Antarctic continent, high-spatial-resolution records from inland sites are extremely important for understanding the chemical–physical processes that determine the concentration of chemical species as a function of altitude, distance from the sea, accumulation rates and other glaciological and climatological conditions.
The concentrations of the main ionic components can provide information about relative contributions of different atmospheric aerosol sources. The study of changes in chemical composition as a function of altitude and distance from the sea allows a better understanding of atmospheric aerosol transport and depositional processes.
Given that accumulation rates can modify the original composition of chemical markers in snow, by dilution (in case of dominant dry deposition: Reference Legrand and MayewskiLegrand and Mayewski, 1997) and post-depositional effects (particularly for volatile and unstable species like HCl, HNO3 and H2O2: Reference McConnell, Bales, Stewart, Thompson, Albert and RamosMcConnell and others, 1998; Reference Röthlisberger, Hutterli, Sommer, Wolff and MulvaneyRöthlisberger and others, 2000; Reference Traversi, Becagli, Castellano, Largiuni, Udisti, Colacino and GiovannelliTraversi and others, 2000), it is necessary to understand if and where these potential palaeomarkers can be used to reconstruct the composition of past atmospheres.
For this purpose, we report the chemical and stable-isotope spatial variability in surface firn collected from Terre Adélie, George V Land, Oates Land and northern Victoria Land by sampling 1 m firn cores and snow pits at high spatial resolution along two north–south transects and one east– west transect. At selected sites, a detailed stratigraphy of the first 2 m of snow deposition was reconstructed with the aim of identifying seasonal patterns and the effects of post-depositional processes on some chemical markers.
Sampling and Analysis
In the framework of the ITASE project, France and Italy carried out a traverse along one west–east (D66–GV5) and two north–south (D59—D85 and GV7–Talos Dome–M4) transects from November 2001 to January 2002 (Fig. 1).
Map of the sampled area. Dots indicate snow-pit sites sampled during the 2001/02 ITASE traverse. The GV7–M4 transect is referred to as transect NS-2, the D59–D85 transect as NS-1, and the D66–GV5 transect as WE. Contour line interval is 250 m. The elevations of Talos Dome and Dome C are 2316 and 3233 m, respectively.
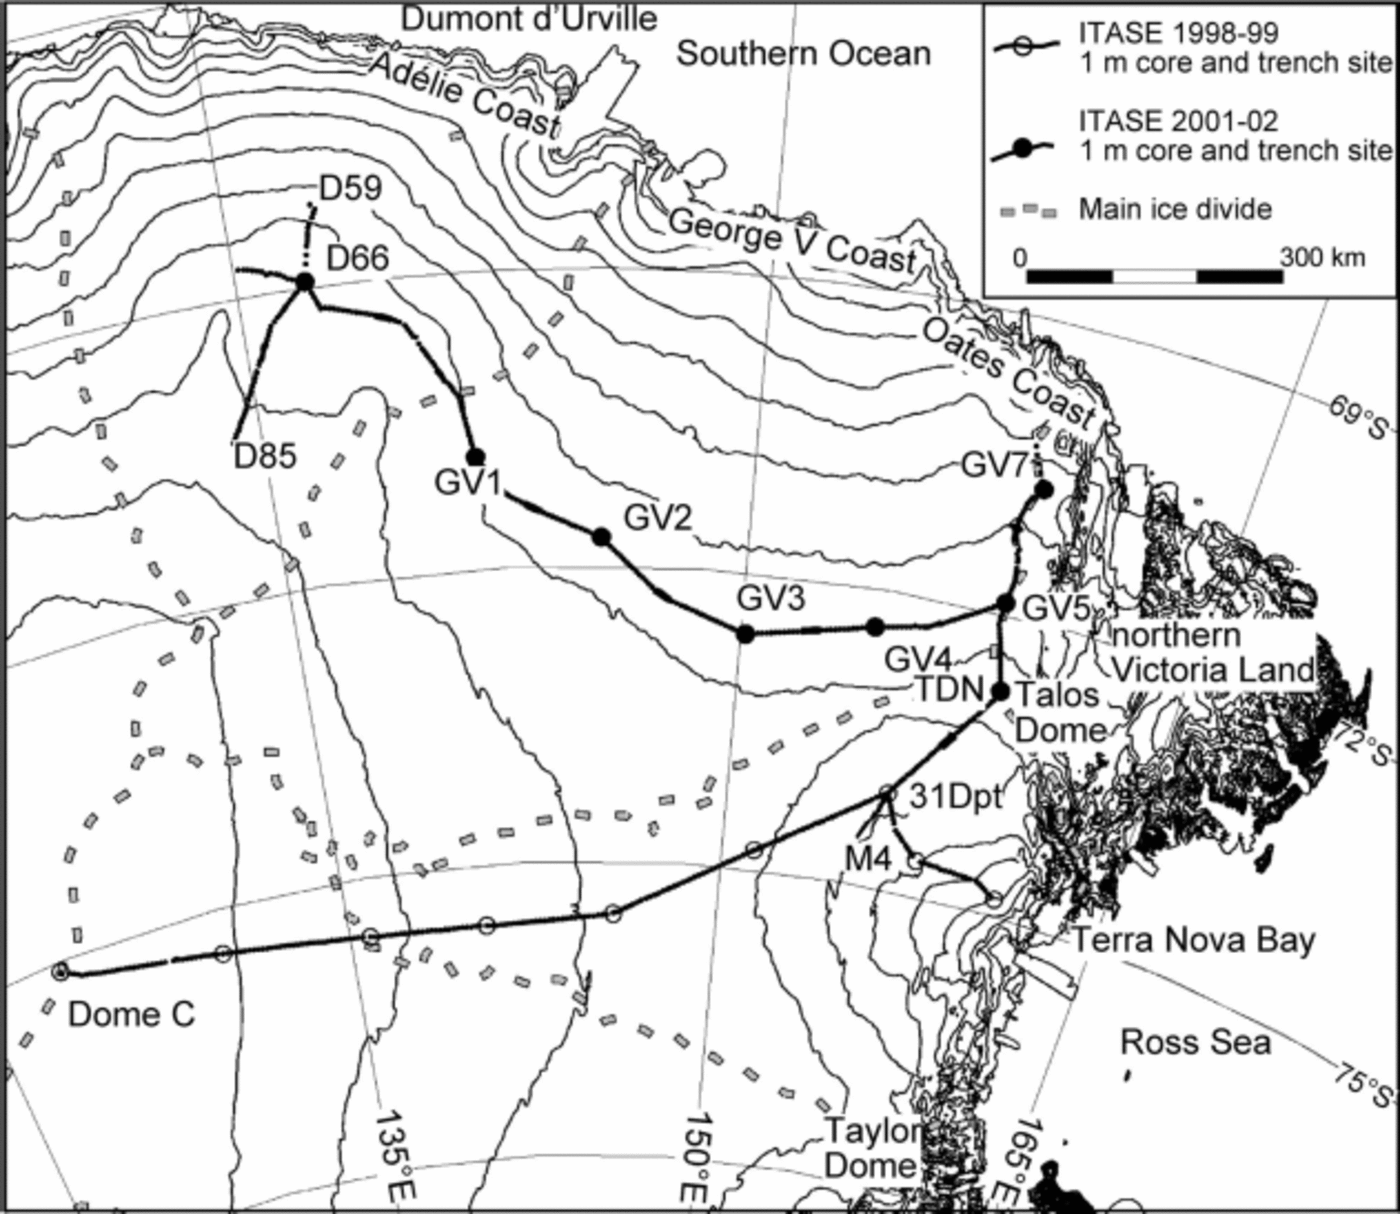
The west–east transect, named WE in the discussion, follows the 2150m contour line, about 400 km from the Adélie, George V and Oates coasts; the first north–south transect (D59–D85, named NS-1) follows the central part of the previous French traverse from Dumont d’Urville to Dome C; the second north–south transect (GV7–Talos Dome–M4, named NS-2) follows the ice divide extending from the Oates Coast to Talos Dome, and then runs along the 2000m contour line in the direction of Taylor Dome.
To limit the impact of wind-driven processes, the eight snow-pit sites (D66, GV1, GV2, GV3, GV4, GV5, GV7, TDN) were chosen in windless areas on the basis of satellite images and a digital terrain model at 1 km resolution provided by Reference Rémy, Shaeffer and LegrésyRémy and others (1999). Field observations revealed that summer melt layers were not present at depth in any of the snow pits.
At site 31Dpt, shown in the map (Fig. 1), snow-pit samples were collected during the 1998/99 ITASE traverse (Reference Frezzotti and FloraFrezzotti and Flora, 2002). The related chemical data (Reference BecagliBecagli and others, 2003) are included in the discussion together with those of the sites along transect NS-2. The nine snow pits were hand-dug and sampled at 2.5 cm resolution up to 1.5–2m depth by workers wearing non-particulating suits, polyethylene gloves and particle masks. Pit walls were cleaned by removing a 5–10cm snow layer with a stainless-steel scraper just before sampling. Pre-cleaned polypropylene vials were inserted in the vertical snow walls; after removal, each sampling vial was labelled and sealed in a double polyethylene bag. Samples were stored below –15˚C until melting immediately prior to chemical analysis. The snow density was determined along the pit wall by collecting horizontal core sections with a known volume and weighing them immediately after retrieval.
Surface snow was sampled every 5km of the traverse (363 samples) down to 1 m by hand auger, then sealed in polyethylene bags and kept frozen. These 1 m cores were cleaned by removing the more external parts with a stainless-steel scraper; each core was then melted (furnishing one sample) and analyzed.
Dionex series instruments were used to analyze major cations (Na+, NH4 +, K+, Mg2+, Ca2+) and anions (Cl–, NO3 –, SO4 2–, F–, MSA) in all samples from snow pits and 1m integrated firn cores. A detailed description of analytical methods is reported by Reference Gragnani, Smiraglia, Stenni and TorciniGragnani and others (1998) and Udisti and others (2004). H2O2 concentrations in snow-pit samples were determined using the peroxidase-based fluorescence method described in Reference Largiuni, Giacomelli and PiccardiLargiuni and others (2002). Stable-isotope (δ18O) and tritium analyses were carried out following the procedures reported in Reference PropositoProposito and others (2002) and Reference StenniStenni and others (2002), respectively. Stable-isotope composition was measured on 2.5 cm samples collected from six snow pits at the following sites: D66, GV1, GV2, GV3, GV5 and GV7. δ18O measurements were carried out on all surface snow samples (1m cores), while tritium activity was measured every four samples due to the time-consuming analytical method.
Results and Discussion
Seasonal pattern and accumulation rates
In order to assess accumulation rate variability in the study area, stratigraphic dating of all snow pits was performed through the analysis of chemical and isotopic parameters with marked seasonal patterns (nssSO4 2–, MSA, H2O2, NO3 – and δ18O). Dating was accomplished through a multi-parametric approach involving the calculation of a normalized profile for the seasonal behaviour of each chemical parameter. A detailed description of the multiparametric dating procedure is reported in Reference UdistiUdisti (1996). The main advantage of this procedure is that it allows comparison of profiles presenting different absolute values and compensation of the time shift in the summer peaking of the different seasonal markers. For instance, year-round aerosol measurements in Antarctic coastal sites show that nitrate maxima occur mainly in spring due to the stratospheric–tropospheric exchanges (Reference Legrand, Wolff and WagenbachLegrand and others, 1999), while nssSO4 2– and MSA peak in full summer (Reference MinikinMinikin and others, 1998). Finally, in order to determine the accumulation rate for each year, the normalized sum profile from each snow pit was compared with the related δ18O profile, and the annual boundary (dashed line in Fig. 2) was put on each maximum identified in the normalized sum profile which is very often coincident with the δ18O corresponding maximum.
Concentration vs depth profile of the chemical parameters used for dating, and the calculated normalized sum (see text for details) compared with the δ18O profile.
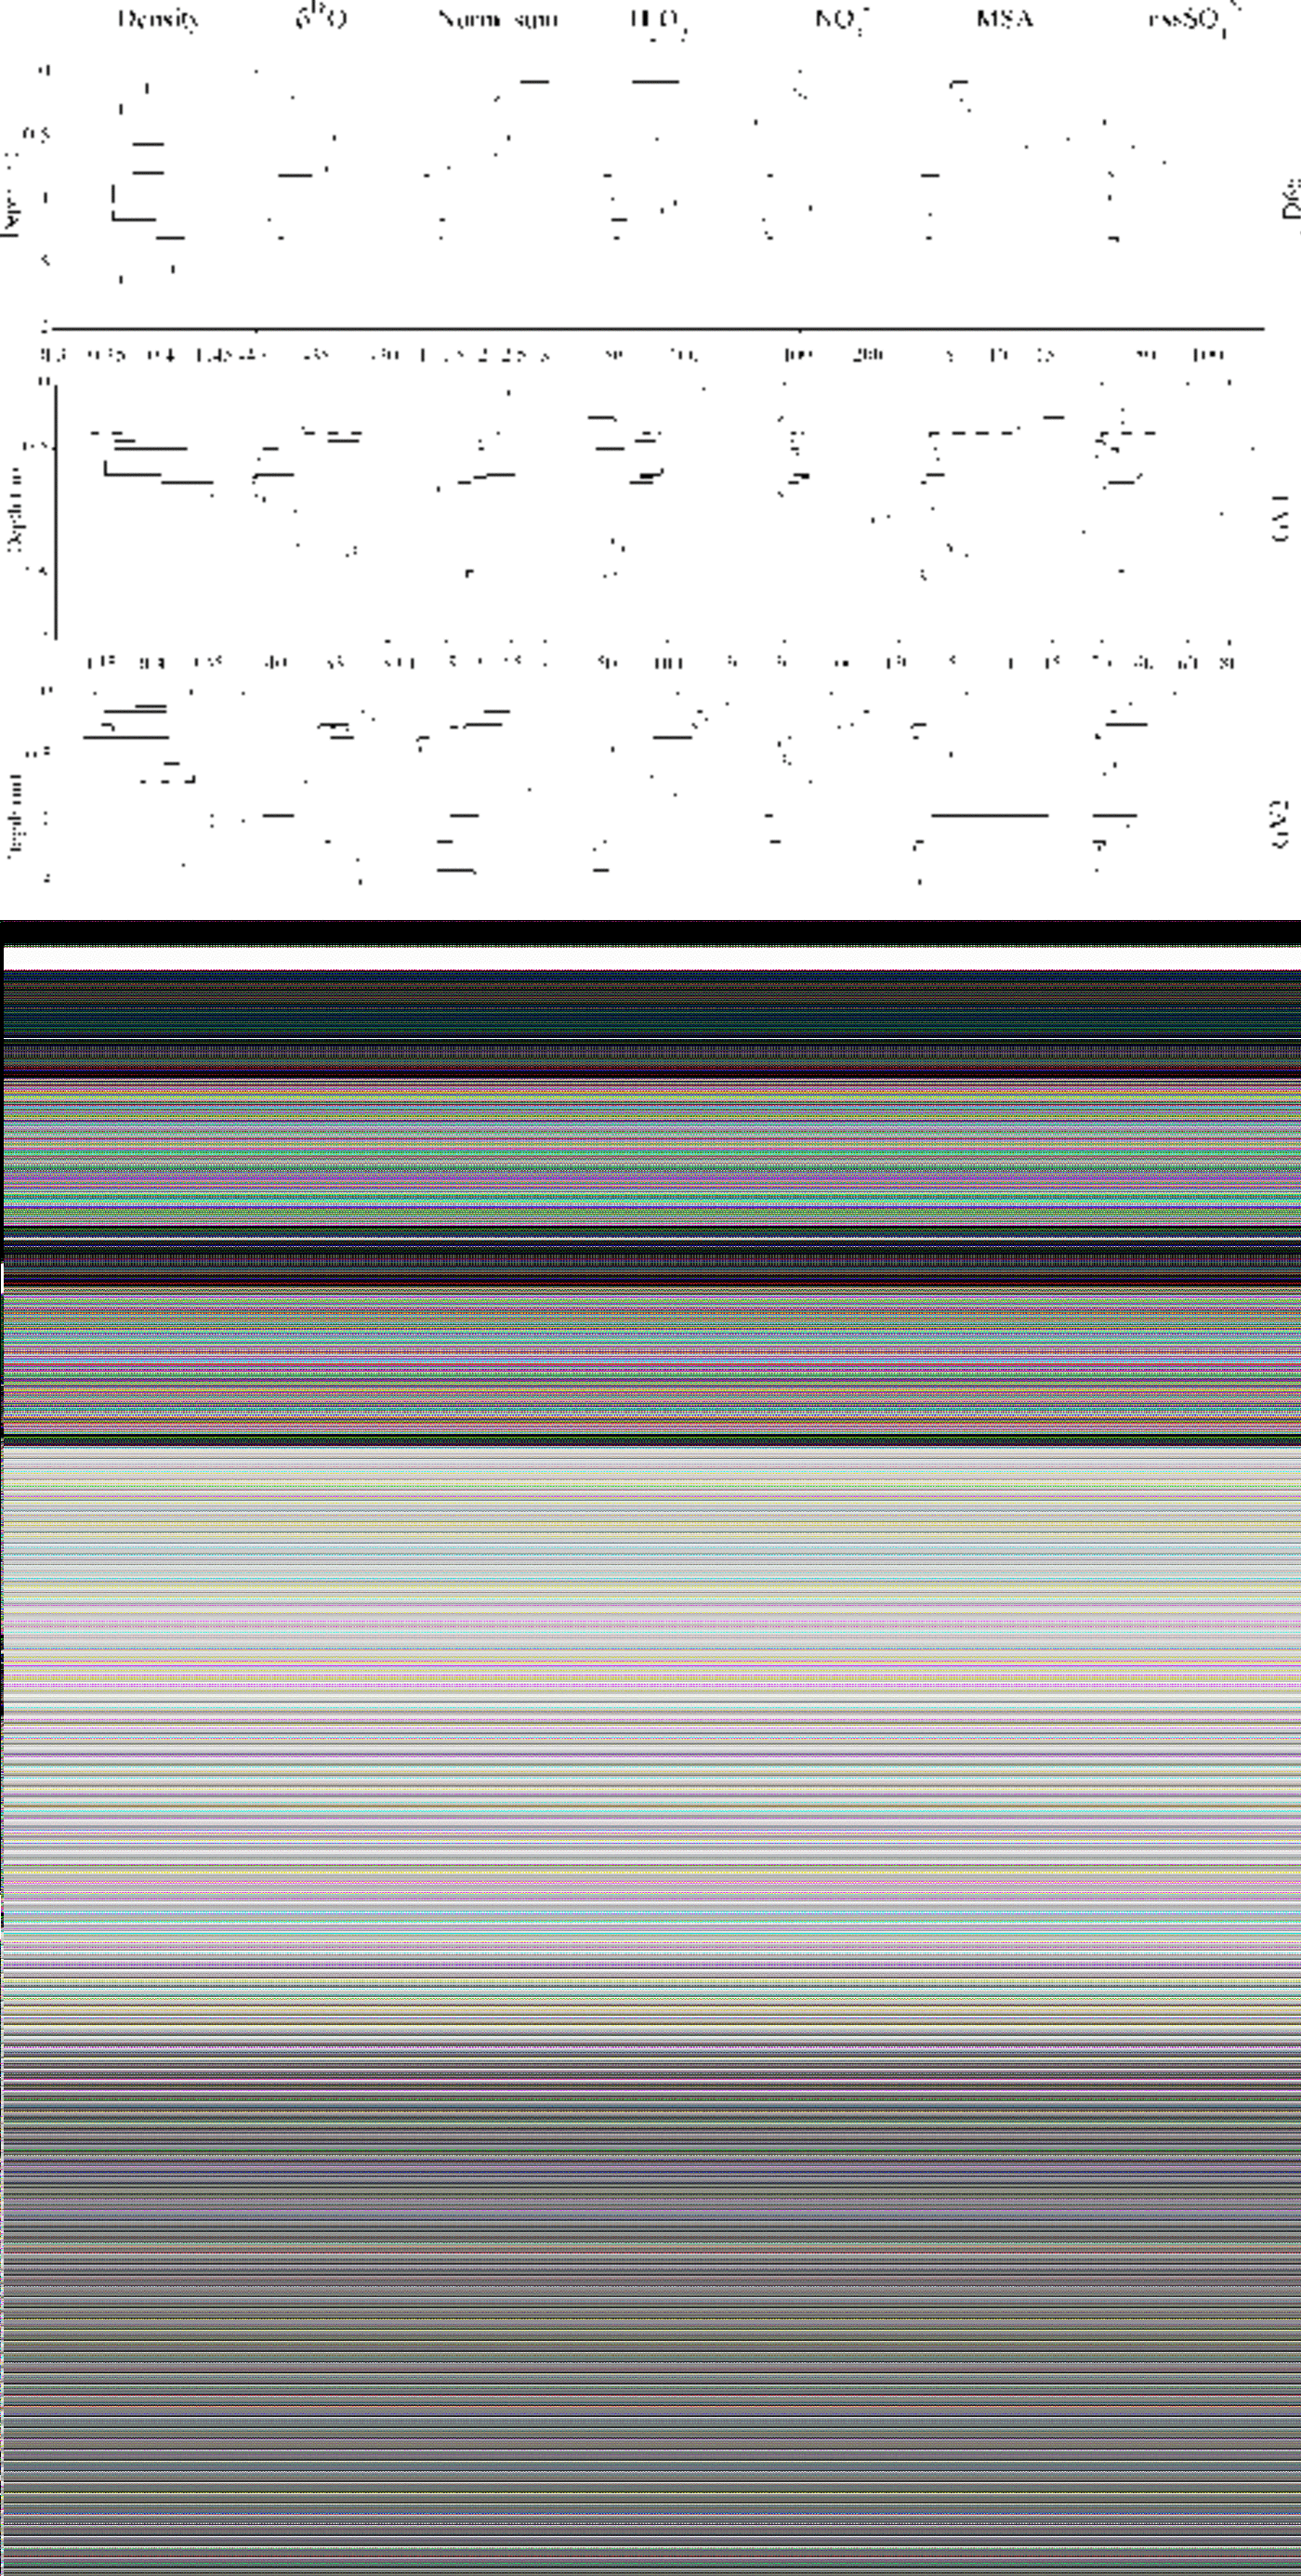
All selected chemical markers for stratigraphic dating show a clear seasonal pattern in the region sampled, with summer maxima and winter minima; a few ambiguities were found in some sites for markers which are affected by post-depositional processes. For instance, H2O2 in most snow pits shows a weakening of the seasonal pattern due to decomposition reactions occurring at the snow surface and/or to post-depositional diffusion in snow layers (Reference Wolff, Wolff and BalesWolff, 1996; Reference McConnell, Bales, Stewart, Thompson, Albert and RamosMcConnell and others, 1998). In particular, H2O2 content at site GV3 shows a gradually decreasing trend with depth, and there is an almost imperceptible seasonal pattern. In some pits (GV2, GV7 and TDN), nitrate also shows a decreasing trend with depth due to HNO3 post-depositional re-emission (Reference Wolff and DelmasWolff, 1995; Reference Wagnon, Delmas and LegrandWagnon and others, 1999; Reference Röthlisberger, Hutterli, Sommer, Wolff and MulvaneyRöthlisberger and others, 2000); nevertheless, the seasonal pattern is still detected over the depth range analyzed. No evidence of post-depositional loss or smoothing of seasonal patterns was observed for nssSO4 2–, known as a conservative species in snow layers. The other biogenic marker (MSA) shows no evidence of movement towards the winter layers, despite some shift with respect to the chosen annual boundary. Such a post-depositional effect was found by Reference Pasteur and R. MulvaneyPasteur andMulvaney (2000) and Reference CurranCurran and others (2002) in shallow firn cores sampled at sites with higher accumulation rate located in the Antarctic Peninsula and at Law Dome.
As for the isotopic profile, a clear seasonal signal can be observed in snow pits D66, GV1, GV5 and GV7, where δ18O and chemical records are in very good agreement. By contrast, at sites GV2 and GV3 post-depositional processes smooth the original seasonal δ18O signal. In particular, the annual boundary at GV2 was chosen only on the basis of the normalized sum profile since δ18O maxima are shifted with respect to all the other chemical markers. At GV2 and GV3, the H2O2 profile is heavily perturbed; this is probably not linked to the accumulation rates at these sites, which are not significantly lower than those at other sites (Table 1), but could be related to the cooler, windier climatic conditions in the central portion of the WE transect, as observed by Reference Magand, Frezzotti, Pourchet, Stenni, Genoni and FilyMagand and others (2004).
Annual accumulation rate (mmw.e. a–1) from snow pits
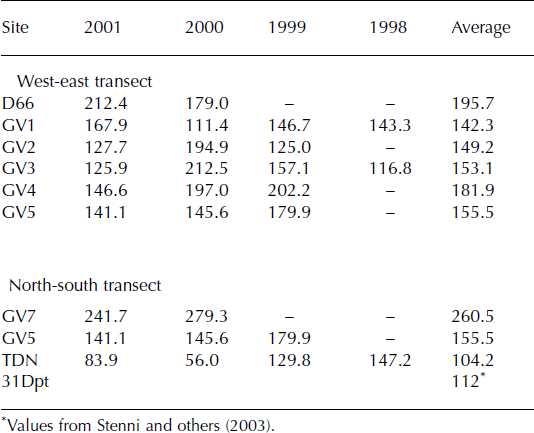
On the basis of the chosen annual boundaries (reported in Fig. 2) and density profile, accumulation rates as mmw.e. were calculated for each year and are reported in Table 1 together with the averaged value for the sampled time interval. The sites are arranged according to their position in the two transects. The mean accumulation rates agree with those obtained from stake measurements and b-counting, taking into account site variability and the different time periods covered by the different methods (Reference Magand, Frezzotti, Pourchet, Stenni, Genoni and FilyMagand and others, 2004).
Along the WE transect, mean accumulation rates appear to be quite homogeneous, with minima in the central portion of the transect (GV1–GV3), located farthest from the Southern Ocean. Along the NS-1 transect instead, the mean accumulation rate decreases from the site closest to the Southern Ocean (GV7) to Talos Dome (TDN), and remains constant moving towards the Ross Sea (31Dpt). A detailed discussion on accumulation-rate variability as a function of site temperature is reported in Reference Magand, Frezzotti, Pourchet, Stenni, Genoni and FilyMagand and others (2004).
Stable-isotope variability
δ18O
The δ18O values obtained from 361 surface snow samples (1m cores) collected every 5 km along two NS transects and one WE transect are presented in Figure 3 as a function of altitude. The relationships between stable isotopes and temperature are discussed in a companion paper by Reference Magand, Frezzotti, Pourchet, Stenni, Genoni and FilyMagand and others (2004). The expected negative correlation between altitude and δ18O is evident along the two NS transects; however, in the case of transect NS-2, this correlation only applies to the sampling sites from GV7 to TDN. After the ice divide, and toward M4, the data do not fall on a straight line, suggesting a different climatic situation and/or a different origin for the moisture sources supplying precipitation to the area. This is confirmed by the lower temperatures observed between TD and M4 (Reference Magand, Frezzotti, Pourchet, Stenni, Genoni and FilyMagand and others, 2004). Elevation gradients of –1.5‰(100 m)–1 and –1.3‰(100 m)–1 were calculated for the NS-1 and NS-2 transects up to Talos Dome, respectively; they are slightly higher than the –1‰(100 m)–1 value observed along the 1998/99 Terra Nova Bay (TNB)–Dome C (DC) traverse (Reference PropositoProposito and others, 2002). This is related to the decrease in temperature with altitude, creating a super-adiabatic lapse rate along the NS transects (Reference Magand, Frezzotti, Pourchet, Stenni, Genoni and FilyMagand and others, 2004), in contrast with the near-dry adiabatic lapse rate of the TNB– DC traverse (Reference Frezzotti, Gandolfi and UrbiniFrezzotti and Flora, 2002). The surface snow samples of the WE transect do not show any correlation with altitude because they were collected along a limited range of altitudes; furthermore, the samples collected at 2100– 2250m (GV1–GV5) exhibit quite a large range of δ18O values as a consequence of the colder, windier conditions characterizing the central sector of this transect (Reference Magand, Frezzotti, Pourchet, Stenni, Genoni and FilyMagand and others, 2004).
Surface snow δ18O values vs altitude for the different transects (GV7–TD: transect NS-2 facing the Southern Ocean; TD–M4: transect NS-2 facing the Ross Sea; D59–D85: transect NS-1; D66–GV5: transect WE). The regression lines for the GV7–TD (northern part of NS-2) and D59–D85 (NS-1) transects are reported. The significance levels of the fits are >99%.

One must bear in mind the following limitations: (i) the snow deposited in a 1 m integrated sample may represent different years, depending on the accumulation rate; (ii) the seasonal distribution of accumulation and its interannual variability may affect mean δ18O values (Reference SchlosserSchlosser, 1999); (iii) wind-scouring phenomena may also introduce a bias in δ18O values.
Tritium
Tritium data from surface snow samples (1m cores) collected along the two NS transects are displayed in Figure 4 as a function of distance from the coast. Data from the 1998/99 TNB–DC traverse (Reference PropositoProposito and others, 2002) are also reported for comparison. In both datasets a positive trend in tritium activity is observed with increased distance inland. The positive correlation between tritium activity and distance from the coast/elevation has been observed in Antarctica by other authors (Reference Merlivat, Jouzel, Robert and LoriusMerlivat and others, 1977; Reference Jouzel, Merlivat, Pourchet and LoriusJouzel and others, 1979, Reference Jouzel, Merlivat, Mazaudier, Pourchet and Lorius1982) and may be related to a more efficient exchange between the stratosphere and troposphere over the more interior part of the continent. Reference Jouzel, Merlivat, Mazaudier, Pourchet and LoriusJouzel and others (1982) suggested that tritium formed at high stratospheric altitudes is brought down within the circumpolar vortex, which is maximum in winter; a rapid exchange of air between the lower polar stratosphere and troposphere may occur during Antarctic winters due to absence of temperature inversion in the South Polar tropopause. Nevertheless, compared to data from the 2001/02 ITASE traverse, results from the TNB–DC 1998/99 traverse for the same distance from the coast show higher tritium concentrations. A probable explanation is that the 1998/99 traverse starts several degrees of latitude south of the 2001/02 traverse, being effectively closer to the interior of Antarctica. This is supported by the more ‘maritime’ condition of the new ITASE traverse, as suggested by the higher accumulation rates. The tritium content of atmospheric water vapour is indeed diluted by fresh oceanic moisture, which is characterized by low tritium activity.
Tritium (TU) values in surface snow vs distance from the coast for the 2001/02 ITASE and 1998/99 TNB–DC traverses. The regression lines for the two datasets are reported. The significance levels of the fits are 95% and 99% respectively.
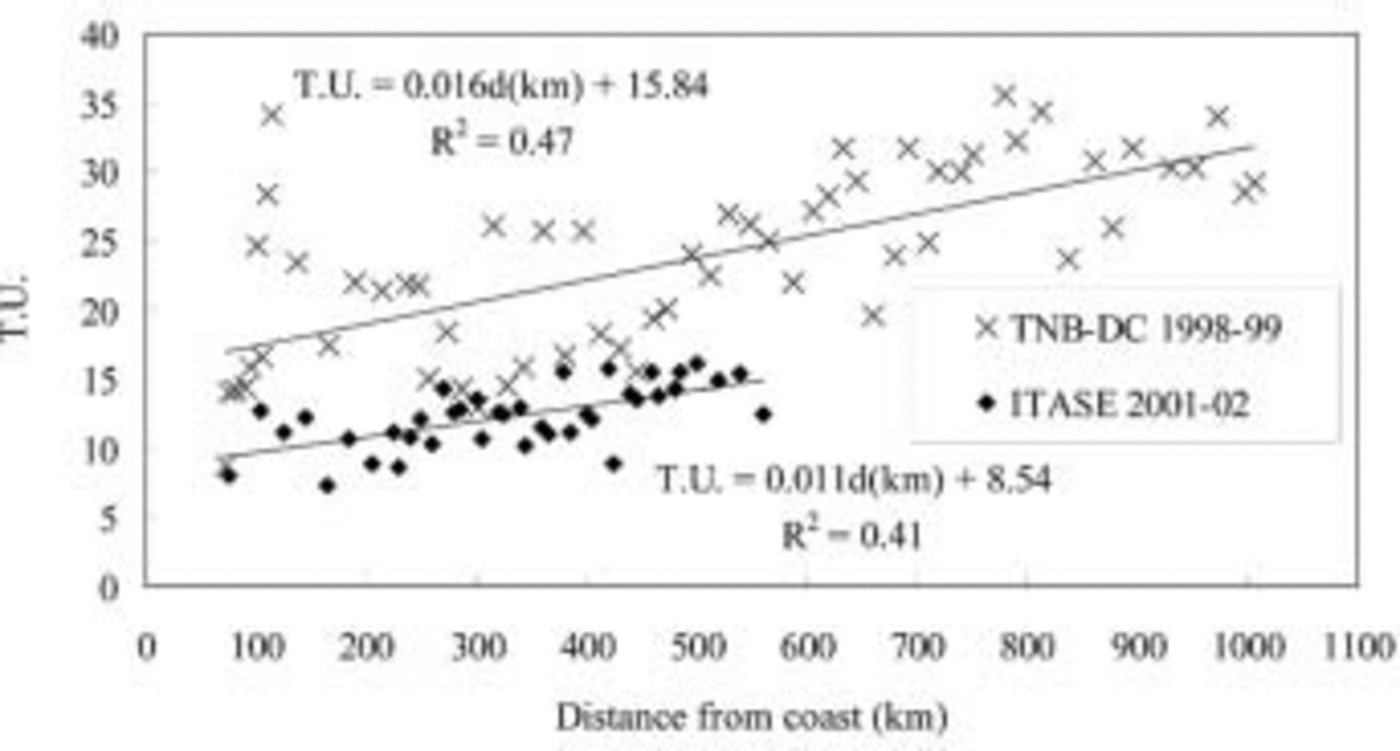
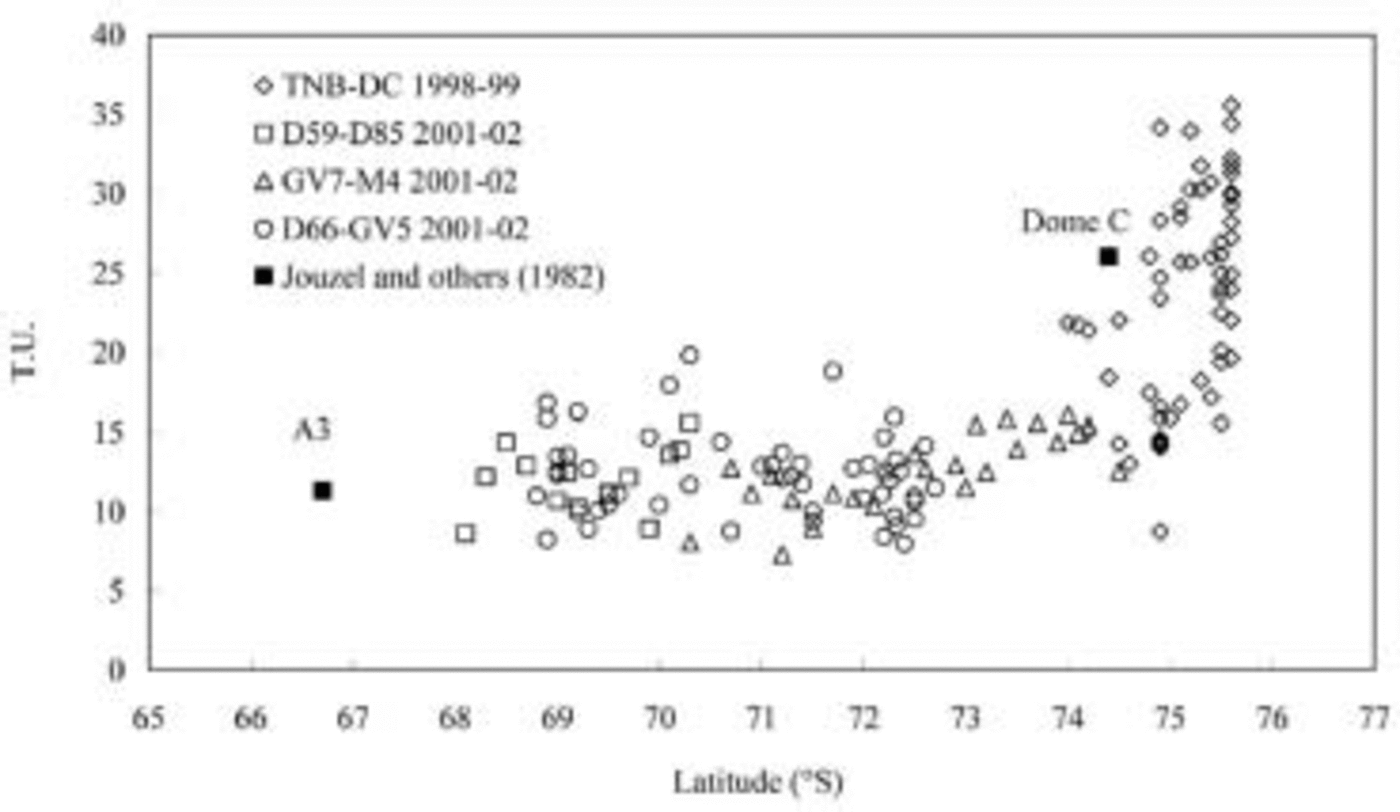
Figure 5 plots all tritium data against latitude and includes those from the WE transect and two points reported by Reference Jouzel, Merlivat, Mazaudier, Pourchet and LoriusJouzel and others (1982) for a coastal site (A3) in Terre Adélie and data from Dome C for the 1940–56 period. These authors showed a strong increase in tritium activity with latitude over Antarctica, with a maximum of 32 TU (tritium units) for the South Pole (outside the represented range).
Tritium (TU) values in surface snow vs latitude for the 2001/02 ITASE and 1998/99 TNB–DC traverses (see legend for symbols). Data from Reference Jouzel, Merlivat, Mazaudier, Pourchet and LoriusJouzel and others (1982) are reported.
Chemical variability
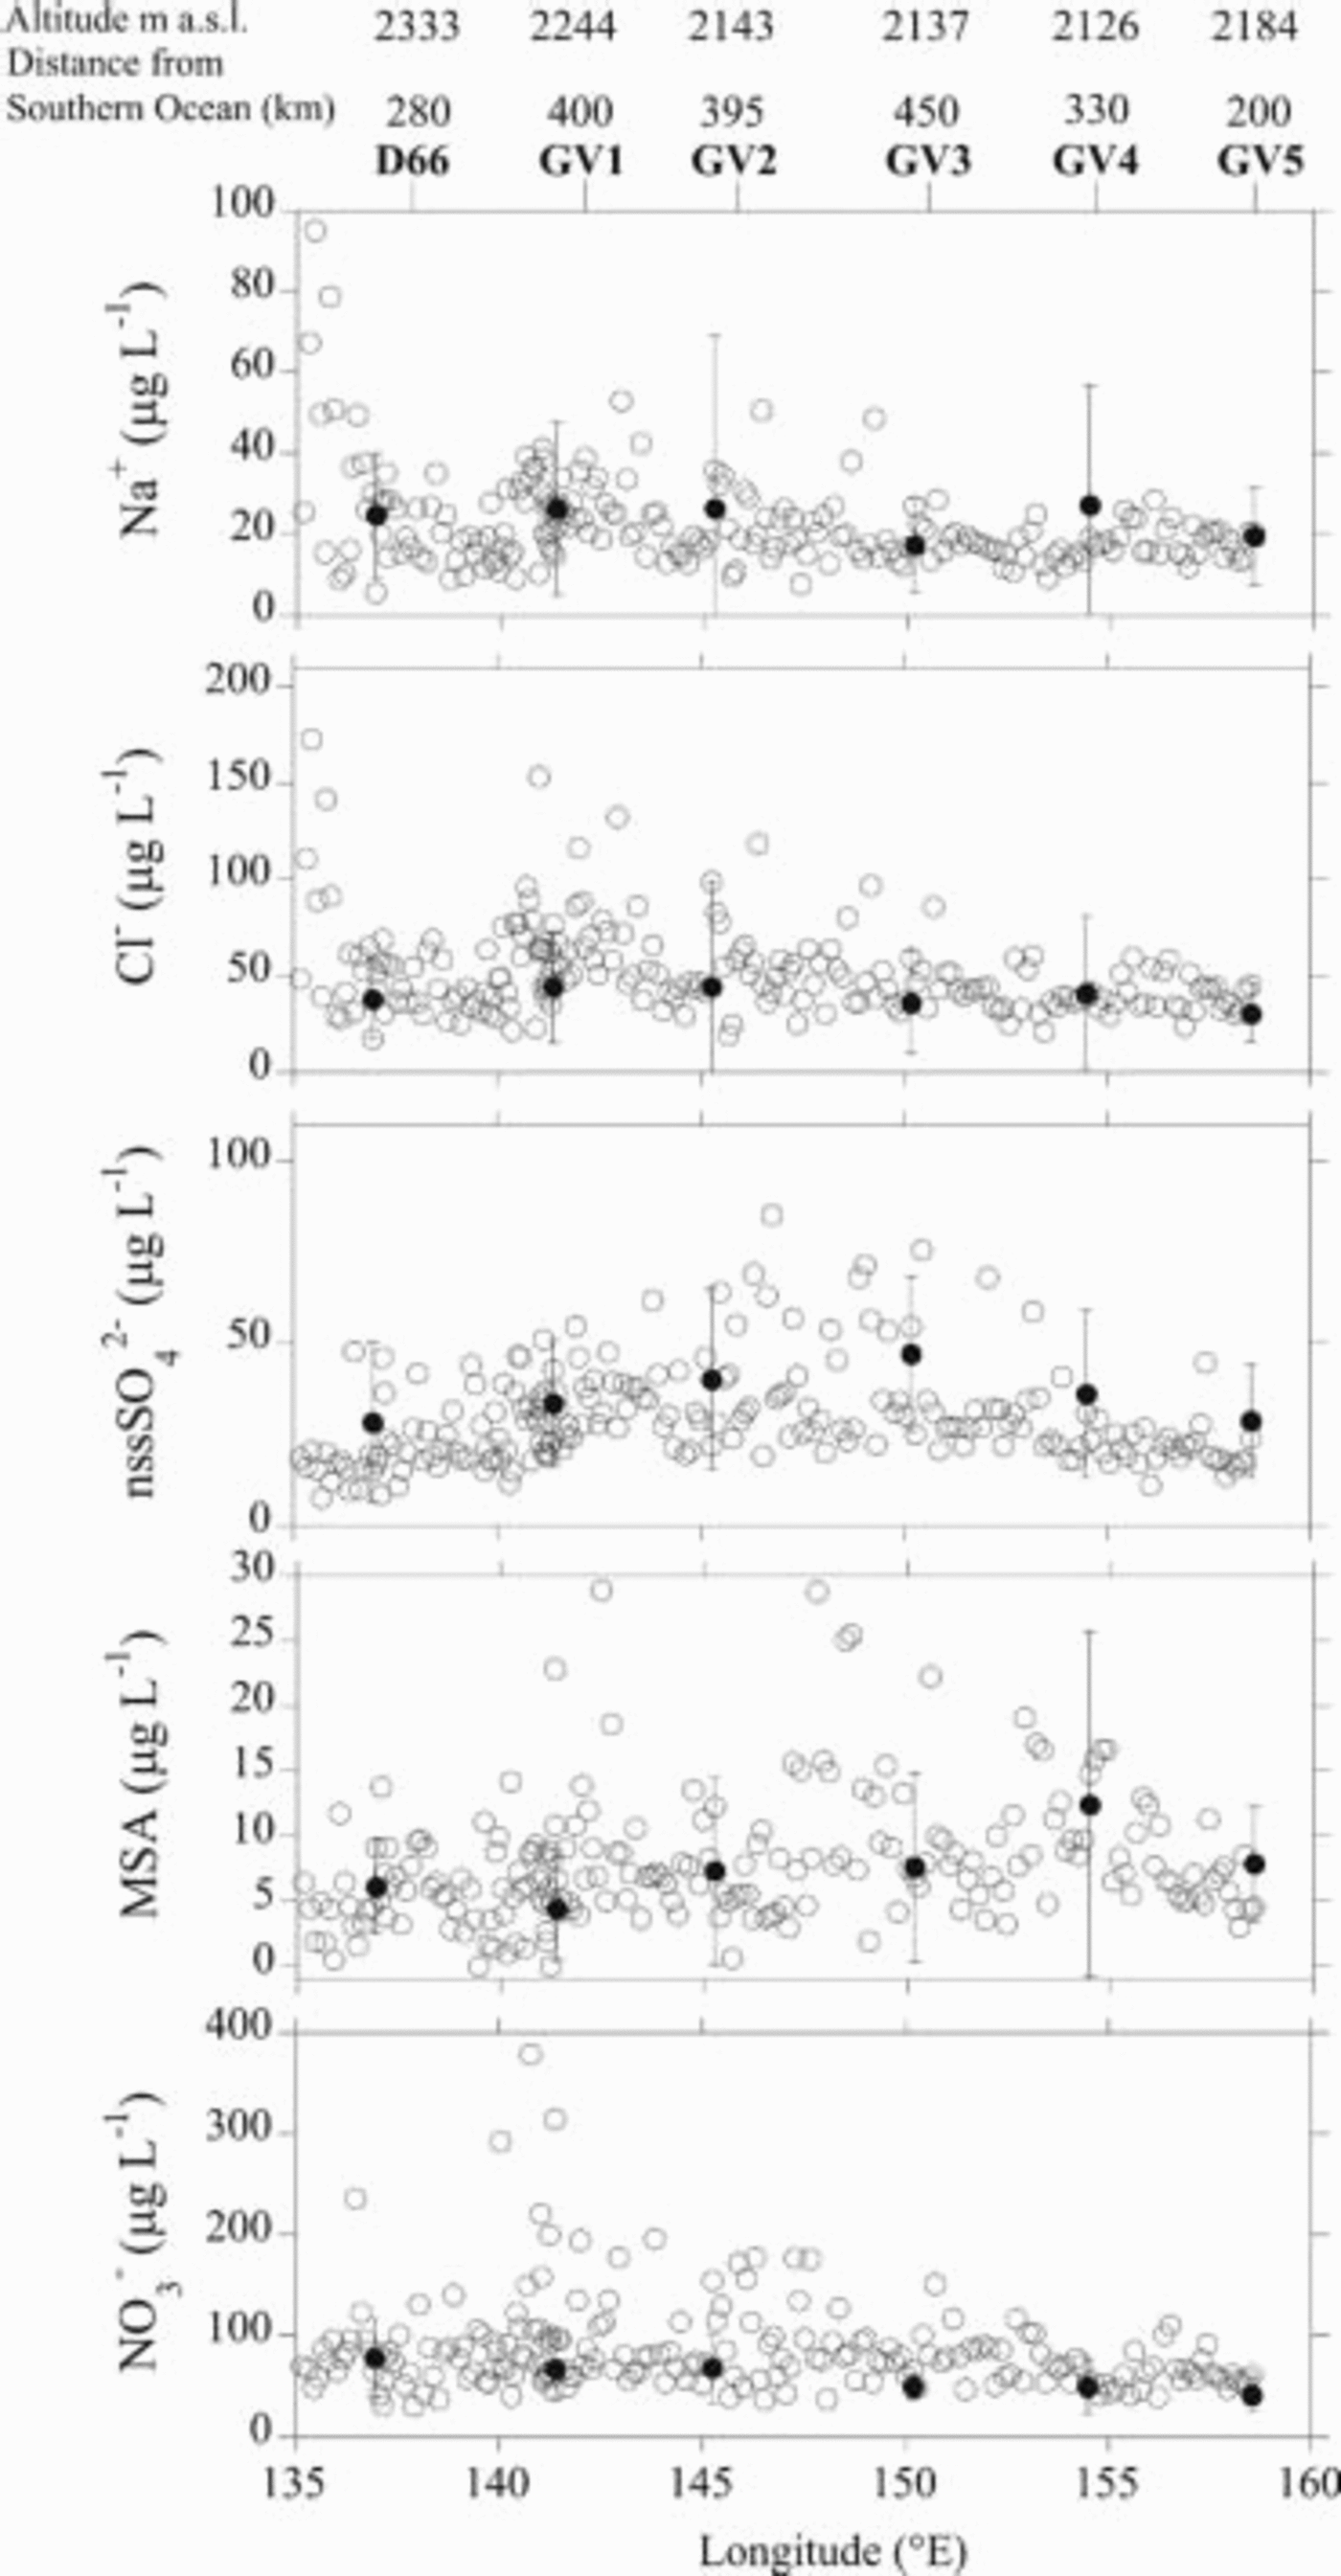
The concentrations of Na+, Cl–, nssSO4 2–, MSA and NO3 – in surface snow are shown in Figures 6–8 for transects NS-1, NS-2 and WE, respectively. Ion concentrations are reported as a function of latitude S for the NS transects, and as a function of longitude E for the WE transect. Whereas elevation and distance from the sea remain fairly constant along the WE transect, they vary substantially along NS-1. NS-2 shows a particular feature: moving south, as the distance from the Southern Ocean increases, proximity to the Ross Sea firstly increases and then remains constant; in the transect, elevation increases up to the ice divide (Talos Dome) and then decreases toward the last site (M4; Fig. 1). Elevation and distance from the Southern Ocean are reported on the top of Figures 6–8. In the same figures, circles are related to 1m firn-core integrated samples, and dots represent mean values calculated from snow-pit samples; the vertical bars indicate the associated standard deviations. The data from the French traverse performed in 1982/83 (Reference Legrand and DelmasLegrand and Delmas, 1985) are shown as triangles in Figure 6.
Sea-spray components
Along transect NS-1 (Fig. 6) the primary sea-spray components (Na+ and Cl–) decrease sharply in the first 50 km from the coast, reaching nearly constant values around 17 and 38 μgL–1, respectively. The French (Reference Legrand and DelmasLegrand and Delmas, 1985) and our profiles show similar data except for a few values at the start of the transect.
Na+, Cl–, nssSO4 2–, MSA and NO3 – concentration distribution along transect NS-1 as a function of latitude S. Triangles represent data from Antarctic traverse DDU–D85 (Reference Legrand and DelmasLegrand and Delmas, 1985). Circles represent data from 1m integrated samples. Dots are mean values from snow pits, and the relative standard deviation is represented as a vertical bar. On the top of the figure, altitude and distance from the Southern Ocean are reported.
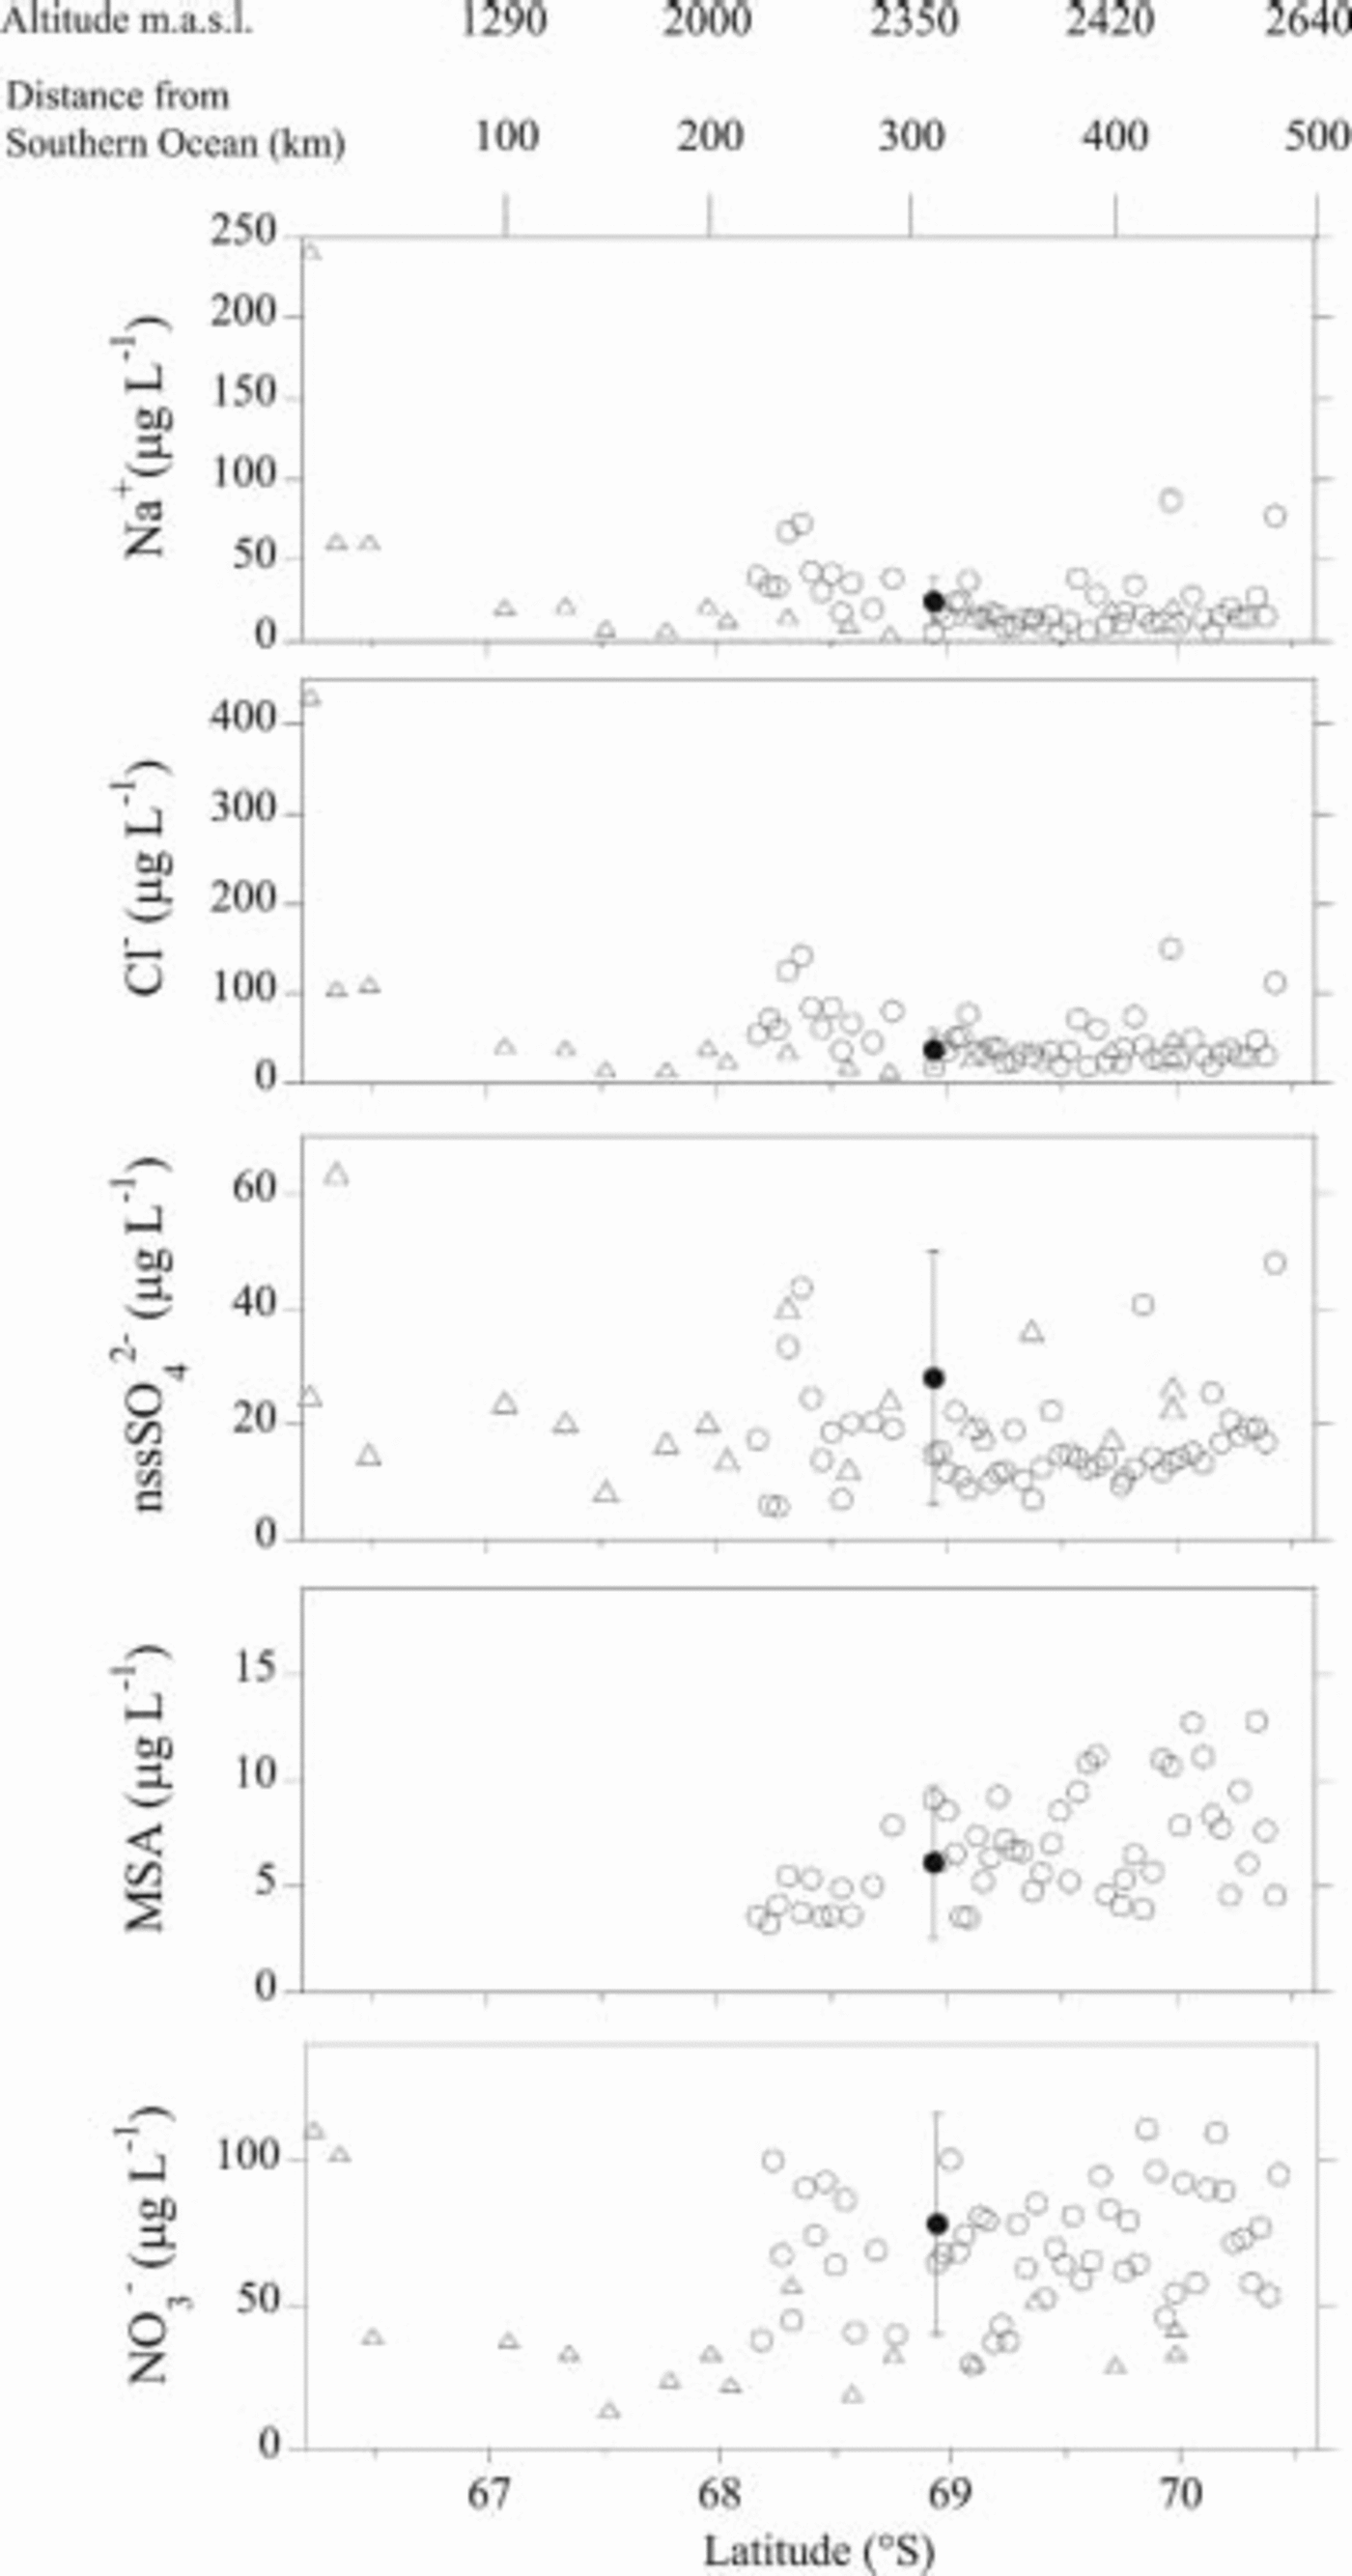
Wind-borne sea-salt particles are coarse and their concentrations rapidly decrease with increasing altitude and distance from the sea. The progressive decrease in Cl– concentrations vs altitude and distance from the coast suggests that these are critical parameters for penetration of sea salt toward inland regions (Reference Minikin, Wagenbach, Graf and KipfstuhlMinikin and others, 1994; Reference Mulvaney and WolffMulvaney and Wolff, 1994; Reference Kreutz and MayewskiKreutz and Mayewski, 1999; Reference Udisti, Becagli, Castellano, Traversi, Vermigli and PiccardiUdisti and others, 1999). The same authors observed that the effect of elevation is more critical than distance from the sea.
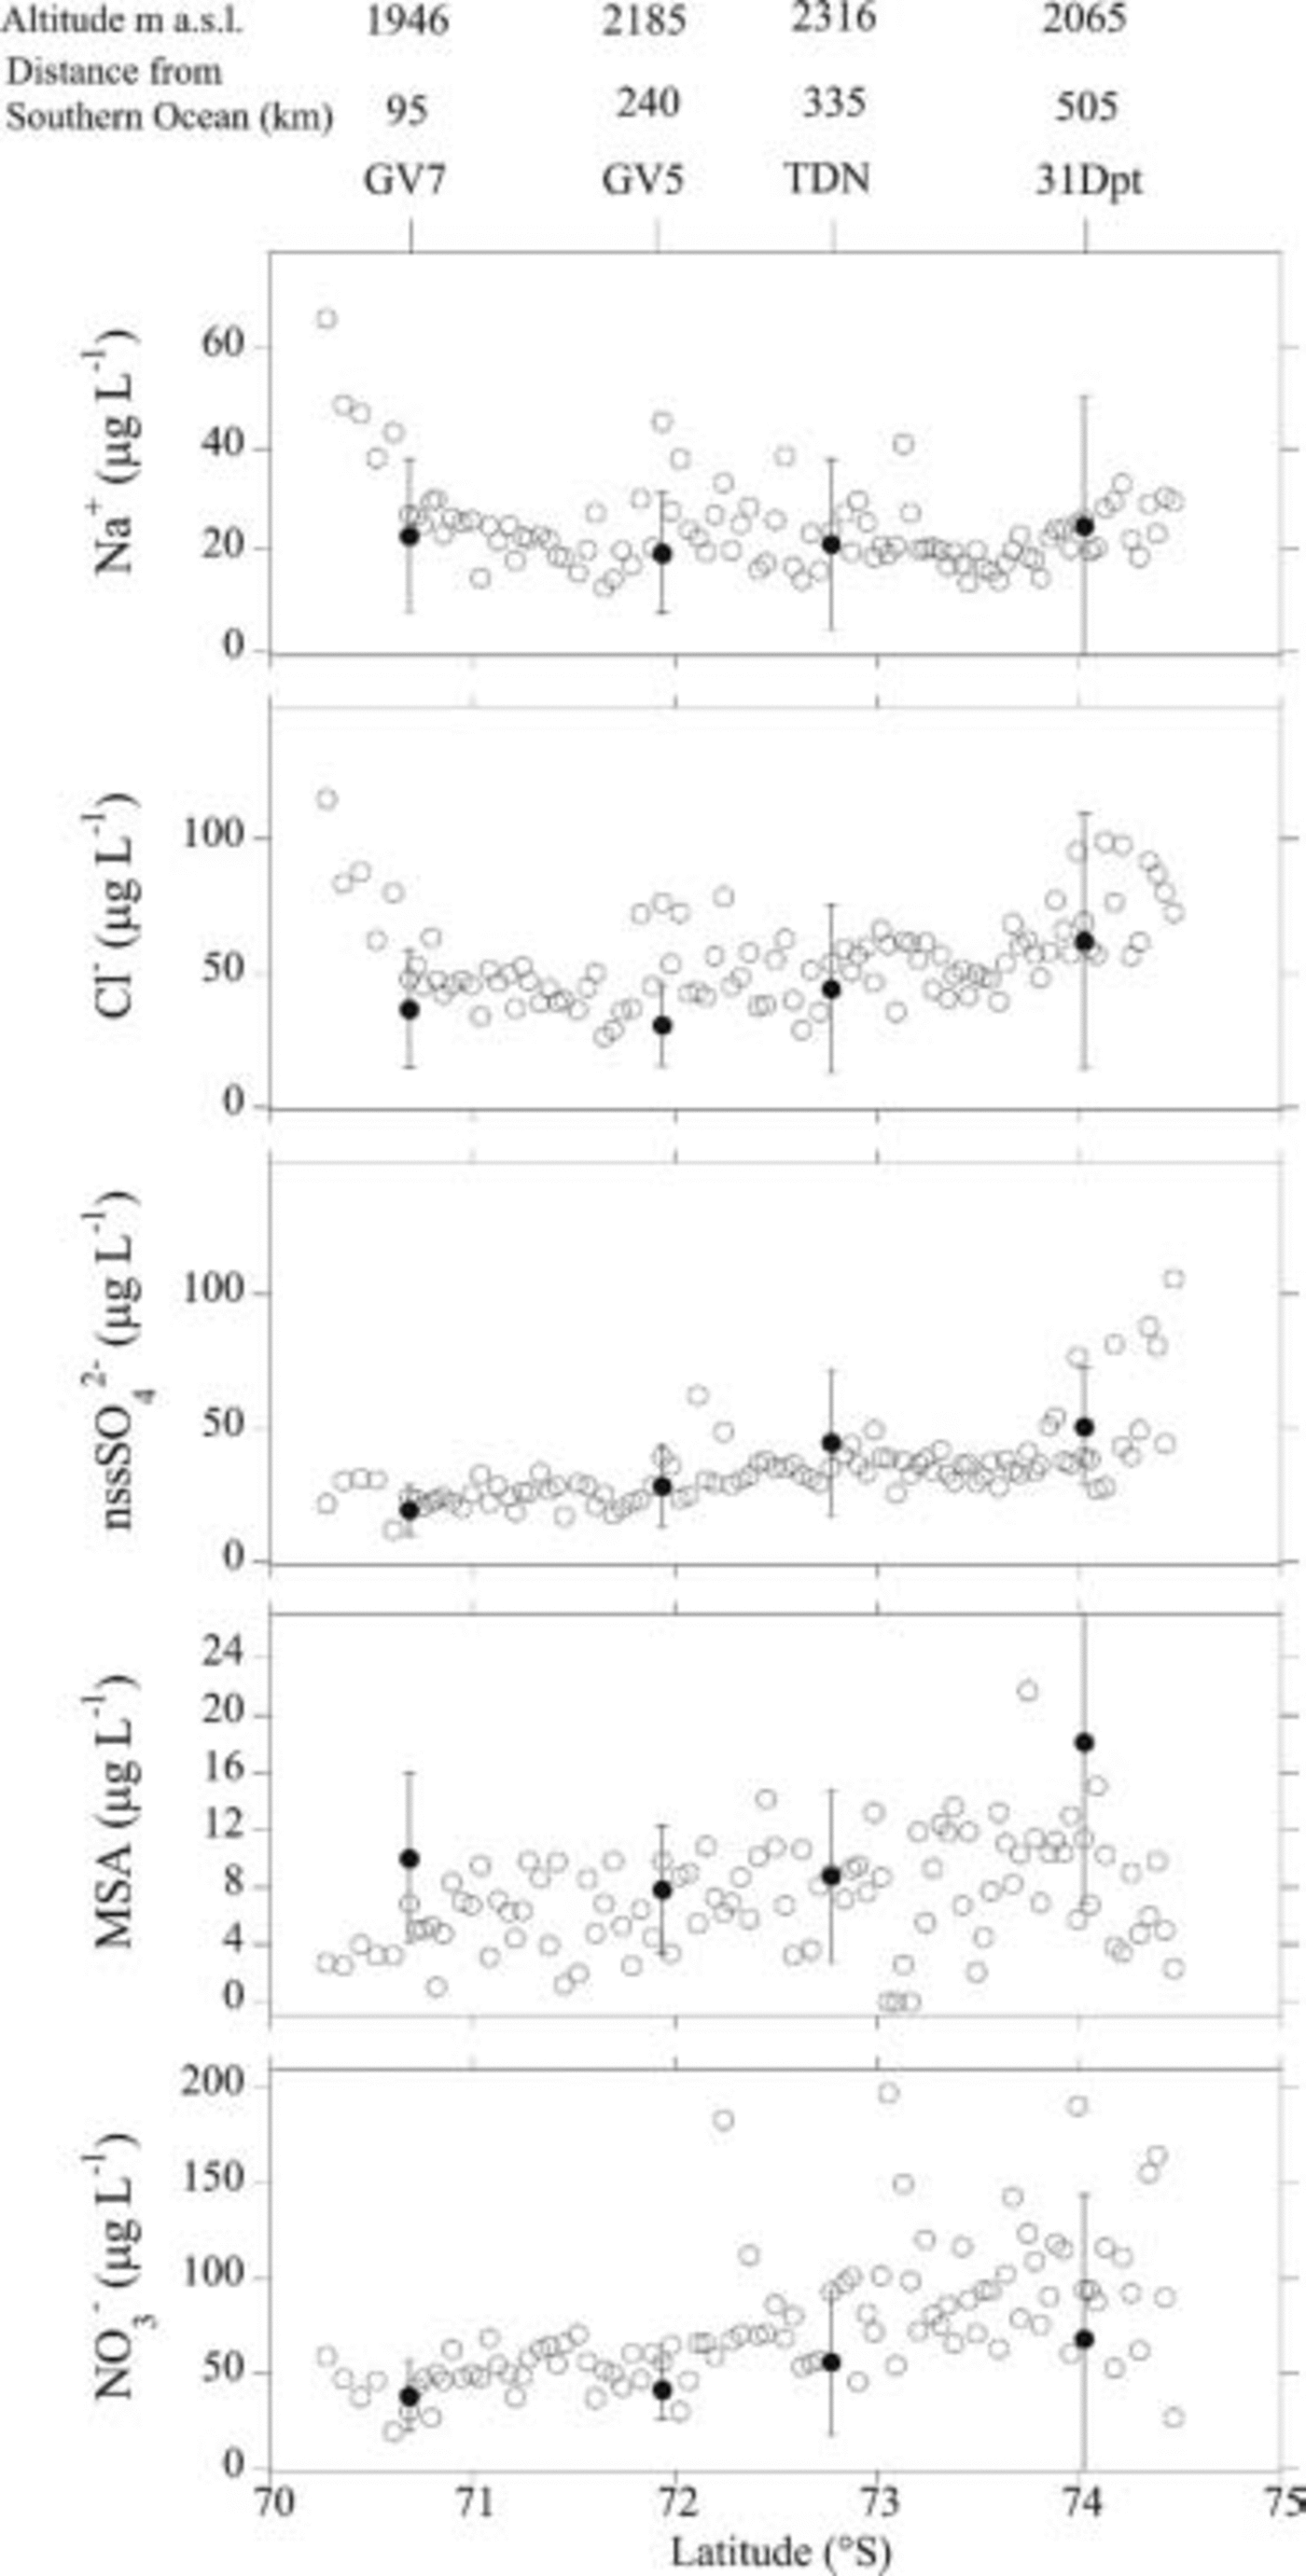
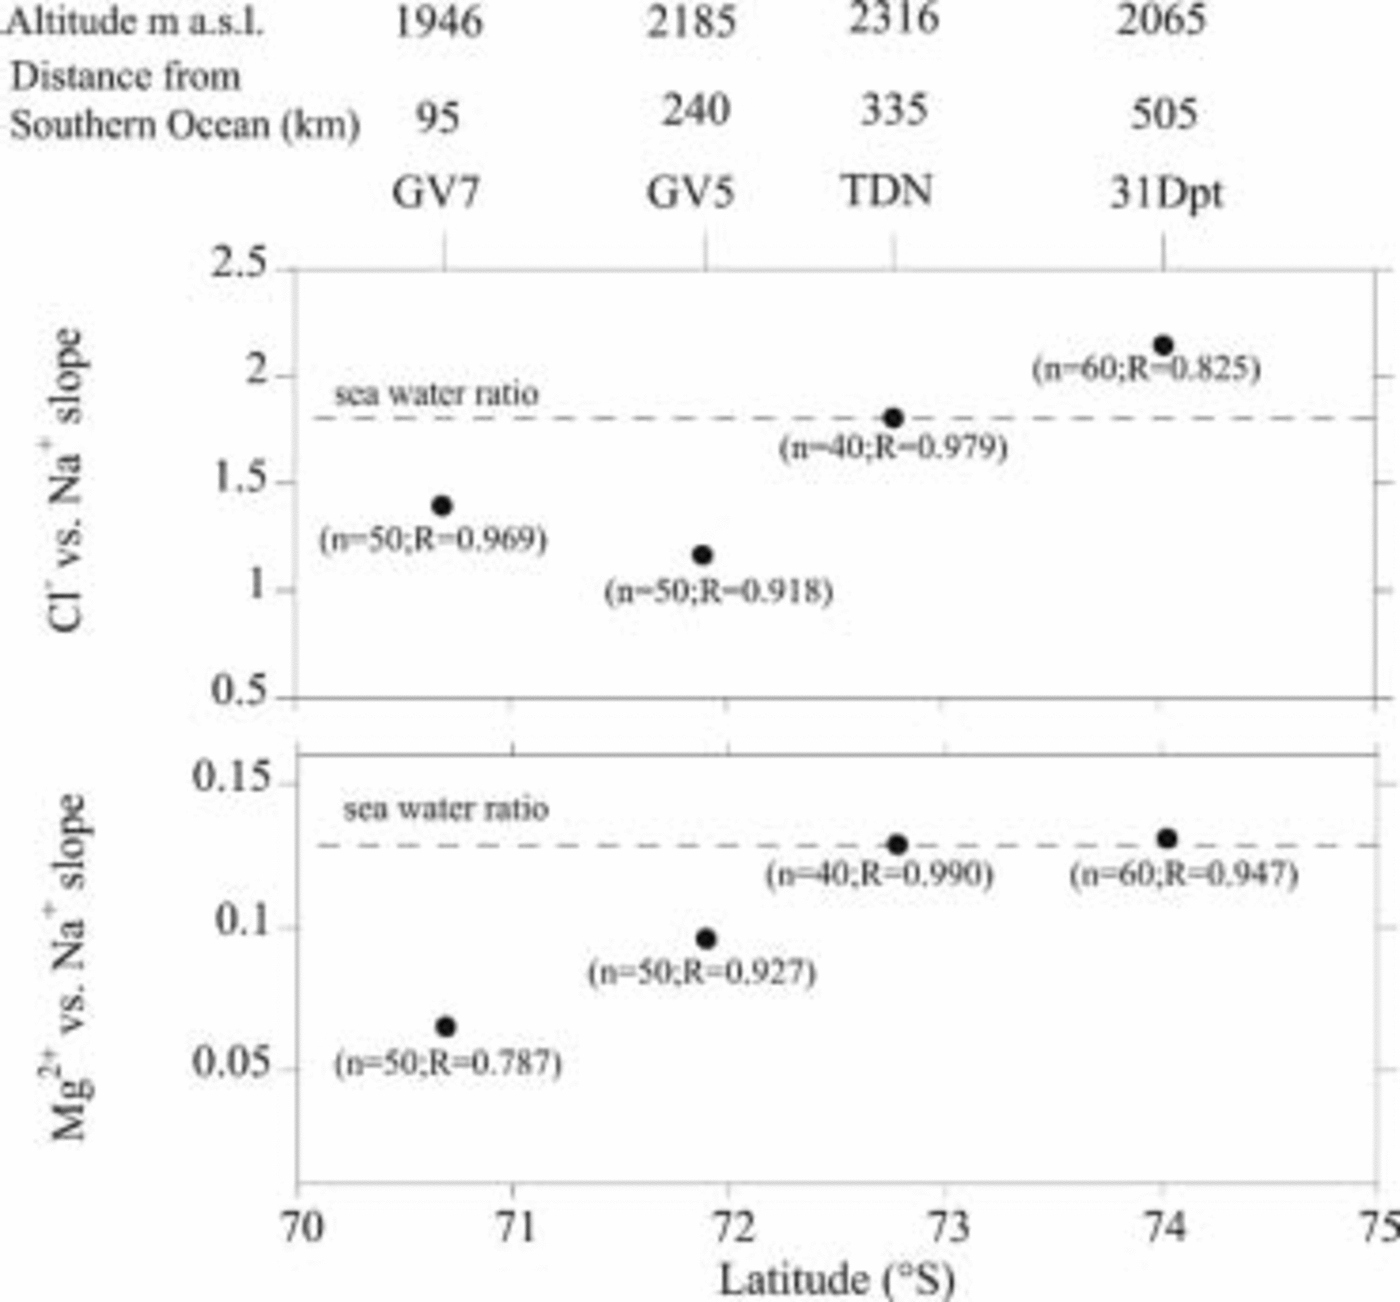
Along transect NS-2 (Fig. 7), Na+ and Cl– quickly decrease between 70 and 130km from the coast, reaching relatively stable values from 71˚30’ to 73˚30’ S, where the highest and most inland sites are located. In the part of the transect facing the Ross Sea, concentrations increase as elevation decreases, and proximity to the sea remains quite constant, suggesting a strong influence of the Ross Sea on the last part of the transect due to atmospheric circulation over this area. A good correspondence is observed between 1m firn cores and snow-pit mean values, with large standard deviations due to intense marine events in the stations which are more affected by the Ross Sea. The snow pits sampled at these stations (31Dpt and TDN) are characterized by good Cl–Na and Mg–Na linear correlations, as demonstrated by the value of the linear regression coefficient (R) reported in Figure 9, with a slope very close to the theoretical sea-water ratio (see dashed line in the plot). By contrast, although the two stations closer to the Southern Ocean (GV7 and GV5) show good Cl–Na and Mg–Na linear correlations, they are characterized by lower Cl/Na and Mg/Na ratios, reflectingdifferent residence times for Cl– and Mg2+ with respect to Na+. The sites located in the area between the Southern Ocean coastline and the ice divide appear to be affected by marine input; however, air masses reaching this area do not come directly from the Southern Ocean, but probably follow a longer pathway along which some species undergo fractionation.
Na+, Cl–, nssSO4 2–, MSA and NO3 – concentration distribution along transect NS-2 as a function of latitude S. Circles represent data from 1m integrated samples. Dots are mean values from snow pits, and the relative standard deviation is represented as a vertical bar. On the top of the figure, altitude and distance from the Southern Ocean are reported for each snow-pit site.
Cl– vs Na+ and Mg2+ vs Na+ slope reported as a function of latitude S along transect NS-2. The number of points (n) and regression coefficients (R) are reported, with significance levels always >99%. On the top of the figure, altitude and distance from the Pacific Ocean are reported for each snow pit site.
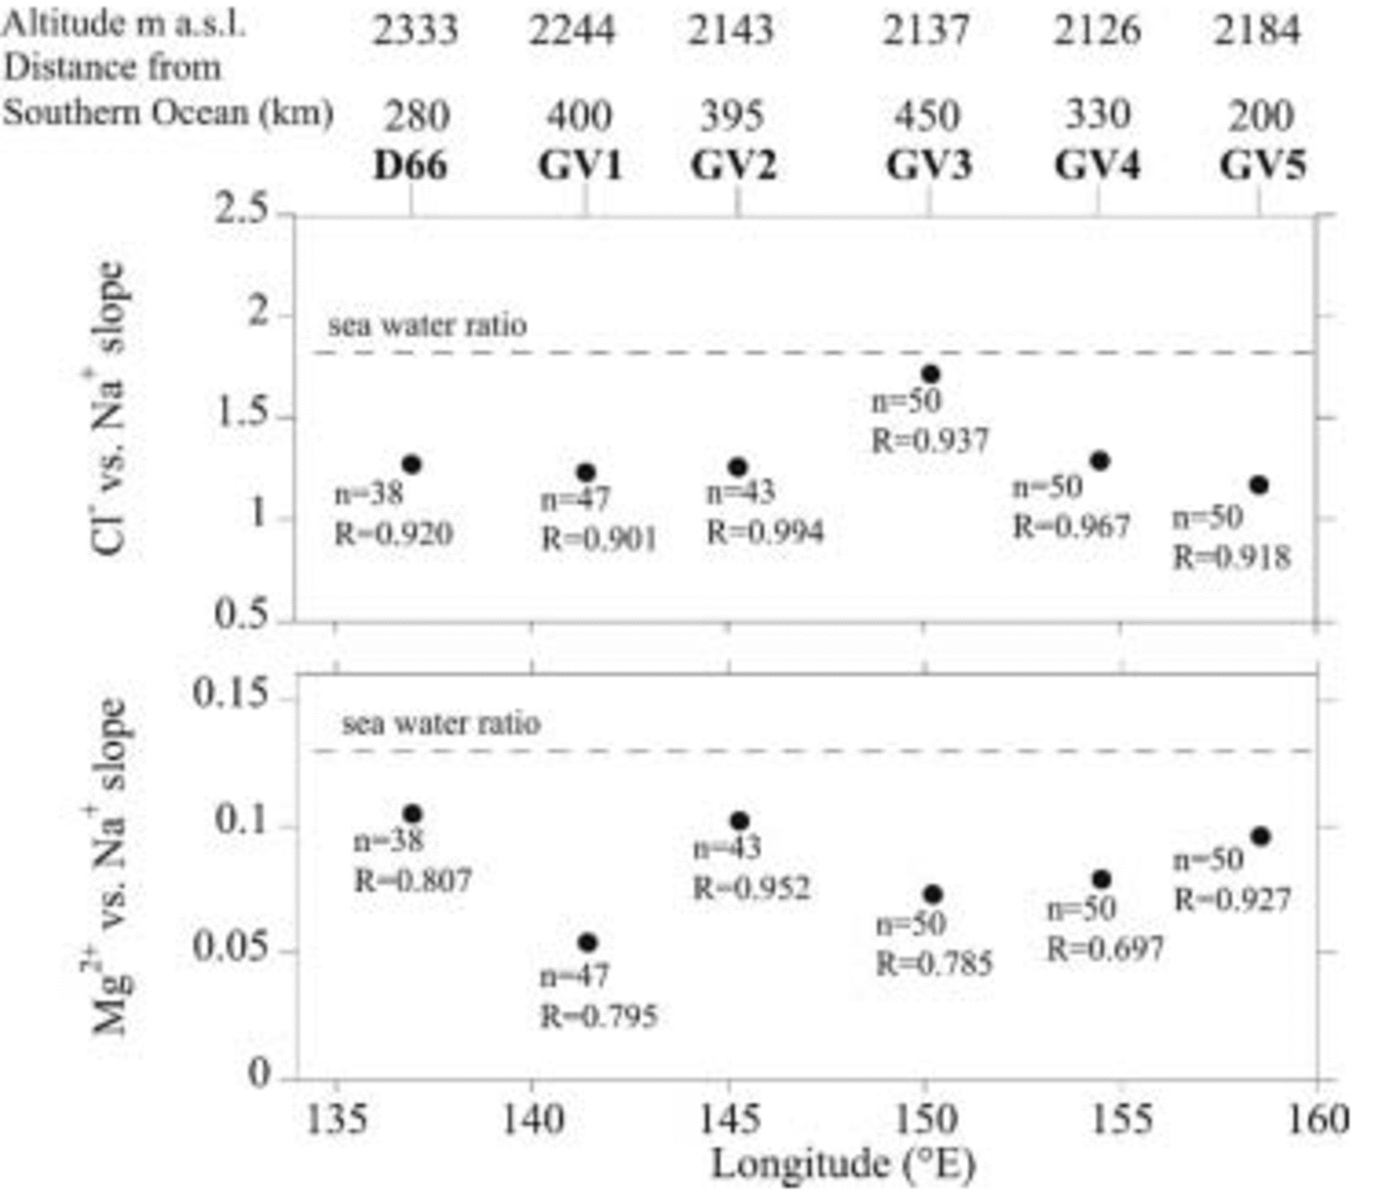
In transect WE (Fig. 8), Cl– and Na+ profiles exhibit a rather flat pattern, and mean values from snow pits fit very well with 1m firn-core values; the high levels recorded around 135˚ E are at sites close to the Southern Ocean and at lower altitudes. Figure 10 illustrates the Cl–Na and Mg–Na linear correlation with respect to longitude E. All sites show good correlations with the slope of the regression line, which is always lower than sea-water ratio, demonstrating that fractionation of Cl– and Mg2+ occurs in the entire study area, and that all the stations behave similarly with respect to primary marine aerosol. This common pattern is due to the relatively constant high altitude and similar distance from the coastline.
Na+, Cl–, nssSO4 2–, MSA and NO3 – concentration distribution along transect WE as a function of longitude E. Circles represent data from 1m integrated samples. Dots are mean values from snow pits, and the relative standard deviation is represented as a vertical bar. On the top of the figure, altitude and distance from the Southern Ocean are reported for each snow-pit site.
Cl– vs Na+ and Mg2+ vs Na+ slope reported as function of latitude S along transect WE. The number of points (n) and regression coefficients (R) are reported, with significance levels always >99%. On the top of the figure, altitude and distance from the Southern Ocean are reported for each snow-pit site.
Sulphur compounds
Principal component analysis (PCA) applied to snow-pit samples revealed that sea-spray components at all sites contribute to the first principal component. Sulphate, partly derived from the sea-spray input, contributes to this factor only at 31 Dpt, the site most significantly affected by the Ross Sea. In the other snow pits, total sulphate always contributes to the second factor together with nssSO4 2–; this means that at all sites except 31Dpt, nssSO4 2– is the most important contribution to the total sulphate budget. The average contributions of nssSO4 2– to the total SO4 2– budget are 70%, 76% and 78% in transects NS-1, NS-2 and WE, respectively. Therefore, only the nssSO4 2– profile is shown in Figures 6–8.
The nssSO4 2– profile for transect NS-1 shows quite constant background values, consistent with measurements performed by Reference Legrand and DelmasLegrand and Delmas (1985), reported as triangles in Figure 6. This pattern is typical of secondary aerosol components, mainly related to fine particles, at sites located at relatively high altitudes and distant from the sea, where biogenic nssSO4 2– reaches quite constant background values (e.g. Reference Minikin, Wagenbach, Graf and KipfstuhlMinikin and others 1994; Reference Udisti, Traversi, Becagli and PiccardiUdisti and others, 1998; Reference BecagliBecagli and others, 2003; Reference Traversi, Becagli, Castellano, Largiuni, Udisti, Colacino and GiovannelliTraversi and others, 2004).
Transect NS-2 (Fig. 7), although starting nearer the coast and at lower altitudes with respect to transect NS-1, shows a constant level of nssSO4 2– at the first station, where a large part of the coarsest sea-salt particles was previously deposited. As distance/altitude from the coast increases, the gas-derived secondary aerosol (nssSO4 2–) becomes the prevailing species because the diameter of particles shifts toward the finest size fraction which is mainly affected by long-range transport.
A gradually increasing trend is observed for nssSO4 2–, as latitude S and distance from the Southern Ocean increase up to the ice divide; constant values were measured from the divide to 31Dpt, after which concentrations sharply increased over the last part of the transect. This behaviour could reflect changes in accumulation rates and in the strength of marine sources. The increase in concentrations between GV7 and TDN could be explained supposing a dominant dry deposition in this area, characterized by a generally low accumulation rate, leading to constant deposition fluxes as accumulation rates decrease. The southern part of the transect is about 250 km from the Ross Sea coast. Despite the relatively long distance from the sea, this part of the transect is strongly influenced by marine air masses (as shown by the Na+ and Cl– pattern) due to the local atmospheric circulation (Reference Cullather, Bromwich and Van WoertCullather and others, 1996), thus causing an increasing concentration trend for nssSO4 2–.
The nssSO4 2– concentration pattern for transect WE (Fig. 8) could also be driven by accumulation rates if a prevailing dry deposition is supposed: the highest concentrations are found in the central portion of the transect where accumulation is lowest (see Table 1), suggesting a constant flux in this area.
MSA concentrations show high variability along the three transects. In particular, they tend to increase slightly southward in the two NS transects. Due to its biogenic marine origin, the MSA distribution should decrease with distance inland and increasing altitude; however, the decrease is slower than that of sea salt because MSA is distributed in the finest size fraction of aerosol particles, thereby allowing MSA to reach the Antarctic Plateau (Reference Legrand and MayewskiLegrand and others, 1992; Reference Udisti, Traversi, Becagli and PiccardiUdisti and others, 1998; Reference Kreutz and MayewskiKreutz and Mayewski, 1999).
The increasing pattern observed in transect NS-1 could be explained by a change in accumulation rates, which decrease moving inland, leading to a decreased dilution factor for the aerosol components deposited on the snow. Instead, in transect NS-2, the pattern is thought to be similar to that of nssSO4 2–, with a gradual increase in concentrations toward the ice divide, again consistent with variations in accumulation rates, and a further increase until 31 Dpt as the Ross Sea is approached. In the very last part of the transect, an anomalous diminishing trend is observed which must be confirmed by further data. The MSA pattern observed in profile WE is similar to that of nssSO4 2–, with accumulation rates controlling MSA concentrations in this area.
NO3–
NO3 – concentrations show different patterns in transects NS-1, NS-2 and NS-3, (Fig. 6–8). NO3 – concentrations in transect NS-1 are fairly constant and in good agreement with the values found in the shallow snow samples collected during the 1982–83 Terre Adélie traverse (Reference Legrand and DelmasLegrand and Delmas, 1985). The NO3 – profile for transect NS-2 shows a progressive increase up to 500 km from the coast. There are many spikes in transect WE, especially in the 140–145˚ E range, which are not reflected in the standard deviation of the corresponding pit samples.
Due to the decreasing trend in NO3 – concentrations with depth observed in some snow pits (see Fig. 2), snow-pit mean values are likely to reach lower values with respect to 1m surficial firn cores. However, mean NO3 – concentrations are quite constant along the WE transect both for 1 m firn cores and for snow pits.
As already described for nssSO4 2–, the NO3 – concentration pattern results from the transport of fine aerosol particles and possible dilution by mean accumulation rates at the sampling site. However, the interpretation of the NO3 – profile is complicated by post-depositional processes (HNO3 re-emission and photochemical decomposition: Reference Wolff and DelmasWolff, 1995; Reference Wagnon, Delmas and LegrandWagnon and others, 1999; Reference Jones, Weller, Wolff and JacobiJones and others, 2000; Reference Röthlisberger, Hutterli, Sommer, Wolff and MulvaneyRöthlisberger and others, 2000) occurring on surficial snow layers in low-accumulation sites. These processes may explain why nitrates in transect WE, unlike other secondary species (especially nssSO4 2–), do not describe a parabola. Indeed, the sites located in the central portion of this transect are characterized by the lowest accumulation rates (see Table 1).
Conclusions
The chemical and isotopic dataset obtained from the traverse through Terre Adélie, George V Land, Oates Land and northern Victoria Land completed during the 2001/02 Antarctic campaign allowed the first detailed analysis of the spatial distribution of chemical tracers and of transport processes affecting this area. The seasonal patterns of nssSO4 2–, MSA, H2O2, NO3 – and δ18O were quite evident in the stratigraphic profiles from snow pits, allowing reliable estimates of age and accumulation rates at all sampled sites. Considering natural site variability, the accumulation rates obtained with different measurements (stake farms and β-counting), as reported by Reference Magand, Frezzotti, Pourchet, Stenni, Genoni and FilyMagand and others (2004), were consistent with our chemical and isotopic data.
The relationship between stable isotopes and altitude was examined for the two NS transects. Elevation gradients of –1.5‰(100 m)–1 and –1.3‰(100 m)–1 were calculated for the NS-1 transect and the northern part of the NS-2 transect, respectively. Stable-isotope data suggest different climatic conditions and/or different origins for the moisture sources supplying precipitation to the sampling sites along the transect from Talos Dome to M4. Surface snow samples from the WE transect show a large range of δ18O values that reflect the colder, windier climatic conditions characterizing the central sector of this transect (Reference Magand, Frezzotti, Pourchet, Stenni, Genoni and FilyMagand and others, 2004).
Tritium concentrations in surface snow samples show a positive trend moving inland, in agreement with data obtained from the previous TNB–DC traverse carried out in the 1998/99 Antarctic campaign (Reference PropositoProposito and others, 2002). However, when considering the same distance from the coast, the 1998/99 traverse data show higher tritium activity compared to data from the 2001/02 traverse. This difference may be ascribed to the difference in latitude, probably linked to the more ‘maritime’ conditions in the area covered by the new ITASE traverse.
As for spatial variability along the three sampled transects, the NS transects highlighted the varying importance of marine sources as distance from the sea increases. In particular, transect NS-1 shows the typical decreasing trend in marine primary compounds with increasing altitude and distance from the sea. Concentrations and spatial patterns are consistent with those obtained along a previous traverse (Reference Legrand and DelmasLegrand and Delmas, 1985).
Transect NS-2 is characterized by two areas of influence: the Southern Ocean sector and the Ross Sea. The latter more strongly affects this area due to the atmospheric transport of marine air masses to the Talos Dome area. These atmospheric conditions are consistent with the modelled flux of moisture into the Ross Sea–East Antarctic region (Reference Cullather, Bromwich and Van WoertCullather and others, 1996).
Much of transect WE is swept by prevailing katabatic winds (Reference Mancini and FrezzottiMancini and Frezzotti, 2003) which probably affect annual accumulation rates, with the lowest rates found at GV3. Moreover, high wind speeds result in more windblown snow and facilitate snowpack ventilation. Windblown snow contributes to scavenging conservative and volatile species, whereas concomitant sublimation may concentrate or release some chemical species. Wind pumping produces an air flux into the snow, favouring chemical exchanges between the atmosphere and snow (Reference Pomeroy, Jones, Wolff and BalesPomeroy and Jones, 1996; Reference Waddington, Cunningham, Harder, Wolff and BalesWaddington and others, 1996). Surface and wind-driven sublimation, controlled by surface slope along the prevailing wind direction, has a huge impact on surface mass balance (Reference Frezzotti and FloraFrezzotti and others, 2002).
Primary and secondary aerosol components along transect WE show no particular distribution patterns, with marine aerosol fractionation and low background values confirming the hypothesis of scarce oceanic input. This could be due to the persistence of higher pressures in this area, which block storms and marine air masses (Reference Magand, Frezzotti, Pourchet, Stenni, Genoni and FilyMagand and others, 2004), and/or to the atmospheric circulation around the low-pressure centre that is located seaward of the Wilkes Land coast (Reference Cullather, Bromwich and Van WoertCullather and others, 1996).
Acknowledgements
This research was carried out within the framework of a project on glaciology and palaeoclimatology of the Programma Nazionale di Ricerche in Antartide (PNRA) and was financially supported by Ente per le Nuove Tecnologie, l’Energia e l’Ambiente (ENEA) through a cooperation agreement with the Università degli Studi Milano-Bicocca. This work is an Italian contribution to the ITASE project. It is a contribution to the European Project for Ice Coring in Antarctica (EPICA), a joint European Science Foundation (ESF)/European Commission (EC) scientific programme, funded by the EC and by national contributions from Belgium, Denmark, France, Germany, Italy, the Netherlands, Norway, Sweden, Switzerland and the United Kingdom. This is EPICA publication No. 90. The authors wish to thank all members of the traverse team, the participants in PNRA 2001/02 who provided assistance at Terra Nova and Concordia stations, and everyone in Italy who helped prepare the traverse. The research was also partially supported by ENEA through a cooperation agreement with the Universities of Venice, in the framework of the ‘Chemical Contamination’ sections of PNRA.



