The population share of grandparents and other elderly is rising around the world as a result of low or falling fertility and rising longevity, a share which, even in today's oldest countries, is projected to double or triple in coming decades. From the perspective of hunter-gatherer societies, these abundant elderly should be a bonanza for “gas guzzling children” and their parents. But a funny thing has happened. The economic role of the elderly has been radically transformed in rich industrial nations relative to contemporary hunter-gatherer groups, with low-income agricultural societies intermediate.
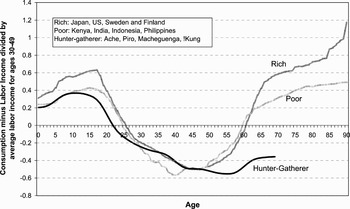
Figure 1 plots the difference between the amount consumed at each age and the amount produced (measured as labor income) for average individuals. This difference is the “life cycle deficit,” or LCD. The hunter-gatherer estimate is an average for the Ache, Piro, and Macheguenga (Kaplan Reference Kaplan1994) and !Kung (Howell, in press). The averages for rich countries (Japan, United States, Sweden, Finland) and for poor countries (Kenya, Philippines, Indonesia, and India) are taken from the international collaborative National Transfer Accounts project (NTA) (see www.NTAccounts.org). This project estimates consumption, labor income, transfers, and asset-based economic activity by age for 30 countries around the world, with complete results currently available for about half of these.
Figure 1.
Data for rich and poor countries taken from the National Transfer Accounts Project (NTA); see NTAccounts.org.
Data for the Ache, Piro, and Macheguenga are from Kaplan (Reference Kaplan1994), and for the !Kung from Howell (in press). Consumption in NTA project countries includes privately purchased goods based on household surveys and publicly provided in-kind transfers (education, health care, long-term care, etc.), and is averaged across males and females. Labor income includes wages and salaries, fringe benefits, and labor's share of self-employment income, including unpaid family labor (see Lee et al. Reference Lee, Lee, Mason, Prskawetz, Bloom and Lutz2008). For hunter-gatherer groups, labor income is food calories acquired (see Kaplan Reference Kaplan1994; Howell, in press).
In the hunter-gatherer groups, adults continue to be net producers (negative LCD) until near time of death, transferring the surplus calories to younger group members, presumably mainly relatives. The elderly are estimated to consume about the same or less than other adults. In poor agricultural societies, adults of all ages consume similar amounts, but production falls off at earlier adult ages; so the elderly rely for their consumption on transfers either from the public sector (although outside Latin America public transfers in poor countries are very limited) or from their younger family members, with whom they often live. In contrast to hunter-gatherer societies, in agricultural societies there are typically property rights and property is disproportionately owned by the elderly. When the elderly own the family farm or business, a share of family income accrues to them as property income, even if they work very little. The greatest contrast is with rich industrial societies that have highly developed welfare states. Consumption by the elderly, particularly the very old, is much higher than consumption by young adults, in part because of publicly provided health care and long-term care. Labor income peaks later in the rich countries, depending more on education and training than on physical exertion, but most workers retire early in response to rising demand for leisure, the availability of pension benefits, and the incentive structure of pensions. Consequently, the old age LCD rises strongly in most rich countries. This reshaped human life cycle, with a long and healthy old age of heavy consumption and little labor effort, is a sea change.
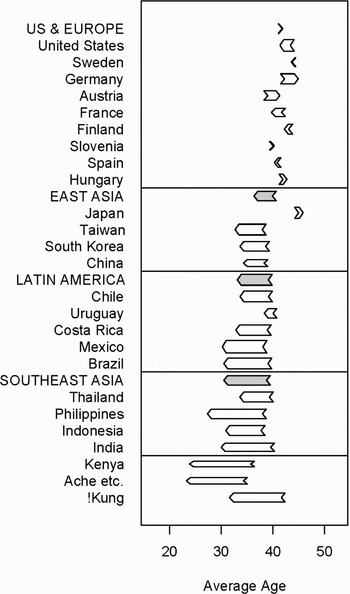
These changes in the economic role of the elderly mean that a potential bonanza of helpful elderly has been transformed instead into economic dependents competing with children for social resources. Throughout history, the net flow of material resources has been downward, from older to younger individuals. Very recently, this direction of net flow has been reversed in some rich countries, and is very likely to be reversed in many more as populations age. Figure 2 illustrates this point by plotting arrows for each society, with the head of the arrow at the average age (population weighted) of consuming and the tail at the average age of producing. The width of each arrow is proportional to the per capita consumption, scaled by average labor income for ages 30 to 49. An arrow pointing to the left indicates resources flowing from older to younger, on average, while an arrow pointing to the right indicates resources flowing on net from younger to older. In hunter-gatherer groups in Kenya, Southeast Asia, Latin America, and East Asia, the regional arrows (shown in gray) and every individual arrow except for Japan point strongly to the left, indicating a net flow of resources to the young. However, in Japan, Hungary, Slovenia, Austria, and Germany, and in the United States and Europe regions as a whole, the arrows now point to the right. This is also a sea change.
Figure 2.
Arrow diagrams showing average ages of consumption and labor income in various populations and per capita flows.
The head and tail of the arrow are the weighted average age of consumption or labor income, with the weights supplied by the population times the per capita consumption or labor income profile at each age. Within each region, countries are ordered by per capita GDP, purchasing-parity adjusted.
Figure 2 combines private transfers, public transfers, and the use of assets to shift consumption. But a similar diagram restricted solely to private transfers shows that these are strongly from older to younger in every one of these societies. It is the public sector transfers that tilt the balance upwards in many rich countries. Furthermore, if we look specifically at transfer patterns of the elderly, we see that in every society outside of East Asia and Thailand, the elderly make private transfers to younger individuals, sometimes out of the public transfers they receive, and sometimes out of their asset income. In addition, the elderly in many countries make substantial bequests, another important route through which resources are transferred to younger generations. The story is complex, but is consistent with a strong motivation of the elderly to assist others privately, even while absorbing massive resources through the public sector.





 You have
Access
The population share of grandparents and other elderly is rising around the world as a result of low or falling fertility and rising longevity, a share which, even in today's oldest countries, is projected to double or triple in coming decades. From the perspective of hunter-gatherer societies, these abundant elderly should be a bonanza for “gas guzzling children” and their parents. But a funny thing has happened. The economic role of the elderly has been radically transformed in rich industrial nations relative to contemporary hunter-gatherer groups, with low-income agricultural societies intermediate.
Figure 1 plots the difference between the amount consumed at each age and the amount produced (measured as labor income) for average individuals. This difference is the “life cycle deficit,” or LCD. The hunter-gatherer estimate is an average for the Ache, Piro, and Macheguenga (Kaplan Reference Kaplan1994) and !Kung (Howell, in press). The averages for rich countries (Japan, United States, Sweden, Finland) and for poor countries (Kenya, Philippines, Indonesia, and India) are taken from the international collaborative National Transfer Accounts project (NTA) (see www.NTAccounts.org). This project estimates consumption, labor income, transfers, and asset-based economic activity by age for 30 countries around the world, with complete results currently available for about half of these.
Data for rich and poor countries taken from the National Transfer Accounts Project (NTA); see NTAccounts.org.
Data for the Ache, Piro, and Macheguenga are from Kaplan (Reference Kaplan1994), and for the !Kung from Howell (in press). Consumption in NTA project countries includes privately purchased goods based on household surveys and publicly provided in-kind transfers (education, health care, long-term care, etc.), and is averaged across males and females. Labor income includes wages and salaries, fringe benefits, and labor's share of self-employment income, including unpaid family labor (see Lee et al. Reference Lee, Lee, Mason, Prskawetz, Bloom and Lutz2008). For hunter-gatherer groups, labor income is food calories acquired (see Kaplan Reference Kaplan1994; Howell, in press).
In the hunter-gatherer groups, adults continue to be net producers (negative LCD) until near time of death, transferring the surplus calories to younger group members, presumably mainly relatives. The elderly are estimated to consume about the same or less than other adults. In poor agricultural societies, adults of all ages consume similar amounts, but production falls off at earlier adult ages; so the elderly rely for their consumption on transfers either from the public sector (although outside Latin America public transfers in poor countries are very limited) or from their younger family members, with whom they often live. In contrast to hunter-gatherer societies, in agricultural societies there are typically property rights and property is disproportionately owned by the elderly. When the elderly own the family farm or business, a share of family income accrues to them as property income, even if they work very little. The greatest contrast is with rich industrial societies that have highly developed welfare states. Consumption by the elderly, particularly the very old, is much higher than consumption by young adults, in part because of publicly provided health care and long-term care. Labor income peaks later in the rich countries, depending more on education and training than on physical exertion, but most workers retire early in response to rising demand for leisure, the availability of pension benefits, and the incentive structure of pensions. Consequently, the old age LCD rises strongly in most rich countries. This reshaped human life cycle, with a long and healthy old age of heavy consumption and little labor effort, is a sea change.
These changes in the economic role of the elderly mean that a potential bonanza of helpful elderly has been transformed instead into economic dependents competing with children for social resources. Throughout history, the net flow of material resources has been downward, from older to younger individuals. Very recently, this direction of net flow has been reversed in some rich countries, and is very likely to be reversed in many more as populations age. Figure 2 illustrates this point by plotting arrows for each society, with the head of the arrow at the average age (population weighted) of consuming and the tail at the average age of producing. The width of each arrow is proportional to the per capita consumption, scaled by average labor income for ages 30 to 49. An arrow pointing to the left indicates resources flowing from older to younger, on average, while an arrow pointing to the right indicates resources flowing on net from younger to older. In hunter-gatherer groups in Kenya, Southeast Asia, Latin America, and East Asia, the regional arrows (shown in gray) and every individual arrow except for Japan point strongly to the left, indicating a net flow of resources to the young. However, in Japan, Hungary, Slovenia, Austria, and Germany, and in the United States and Europe regions as a whole, the arrows now point to the right. This is also a sea change.
Arrow diagrams showing average ages of consumption and labor income in various populations and per capita flows.
The head and tail of the arrow are the weighted average age of consumption or labor income, with the weights supplied by the population times the per capita consumption or labor income profile at each age. Within each region, countries are ordered by per capita GDP, purchasing-parity adjusted.
Figure 2 combines private transfers, public transfers, and the use of assets to shift consumption. But a similar diagram restricted solely to private transfers shows that these are strongly from older to younger in every one of these societies. It is the public sector transfers that tilt the balance upwards in many rich countries. Furthermore, if we look specifically at transfer patterns of the elderly, we see that in every society outside of East Asia and Thailand, the elderly make private transfers to younger individuals, sometimes out of the public transfers they receive, and sometimes out of their asset income. In addition, the elderly in many countries make substantial bequests, another important route through which resources are transferred to younger generations. The story is complex, but is consistent with a strong motivation of the elderly to assist others privately, even while absorbing massive resources through the public sector.