Introduction
To improve the sustainability of hill sheep production systems, research has been underway at SAC to develop and test the optimum selection index for breeds kept in these environments (Conington et al., Reference Conington, Bishop, Grundy, Waterhouse and Simm2001 and Reference Conington, Bishop, Lambe, Bünger and Simm2006a). The resulting multi-trait index, combines both carcass and maternal characteristics with the objective of increasing the overall profitability of hill flocks. After 5 years of selection on this index in Scottish Blackface sheep on two hill farms of contrasting severity, the selected lines showed improved levels of production compared with a control line (Conington et al., Reference Conington, Bishop, Lambe, Bünger and Simm2006a). Overall index scores were significantly higher in the selection line (selected according to highest index score) compared with those in the control line (applying stabilising selection to maintain average index scores) on both farms. This resulted in predicted net differences between the selection and control lines of £3.38 or £2.58 per ewe per year, depending on farm (Conington et al., Reference Conington, Bishop, Lambe, Bünger and Simm2006a). Weaning weights were significantly increased in the selection line lambs compared with those in the control line, with a similar trend for carcass weight. However, subjective carcass grades for fatness and conformation did not differ as a result of 5 years of selection on the index (Conington et al., Reference Conington, Bishop, Lambe, Bünger and Simm2006a).
In the UK, lamb carcasses are graded by trained Meat and Livestock Commission (MLC) assessors using the EUROP classification for conformation (as is used in several other European countries) and a five-point assessment for fatness (Anderson, 2003). These grades, alongside cold dressed carcass weight and category (new and old season lamb, mature sheep) determine the value of the carcass. Conformation and fatness classifications are based on a subjective, visual appraisal of the carcass, which tend to be confounded with each other, and do not directly estimate lean meat yield or lean distribution (Jones et al., Reference Jones, Simm, Dingwall and Lewis1999; Wolf et al., Reference Wolf, Smith, King and Nicholson1981). Conformation grades attempt to assess the shape of the carcass, including ‘blockiness’ and ‘fullness of the legs’, but carcass shape, and therefore conformation grade, is influenced by fatness as well as muscularity (Anderson, 2003).
Objective ways of measuring muscularity, which are independent of fatness, have been considered as methods of improving carcass shape and lean yield (e.g. Purchas et al., Reference Purchas, Davies and Abdullah1991; Purchas and Wilkin, Reference Purchas and Wilkin1995; Navajas et al., Reference Navajas, Lambe, McLean, Glasbey, Fisher, Charteris, Bünger and Simm2007). However, the incentive for breeders to include such methods into breeding programmes to improve carcass quality are likely to be limited under the current grading system, where carcass payments are not directly linked to muscularity and lean yield.
Technological advancements in recent years have resulted in the development of instrumental grading systems that have the potential to predict carcass conformation and composition with a high level of accuracy using video image scanning and analysis (VISA, e.g. Stanford et al., Reference Stanford, Richmond, Jones, Robertson, Price and Gordon1998; Hopkins et al., Reference Hopkins, Safari, Thompson and Smith2004). These systems are non-invasive, can operate at normal chain speeds in an abattoir and enable automatic acquisition of data on carcasses from the side and back view. Thus, they are able to provide objective electronic information on conformation and fat class, as well as total carcass lean yield, and weights and lean yields of different cuts or regions of the carcass (Rius Vilarrasa et al., 2007). These technologies are likely to be used in the near future in commercial UK abattoirs, as well as internationally, as part of a value-based marketing system, and have the potential to improve the objectivity of lamb carcass grading and reward producers for real improvements in carcass quality.
Therefore, further understanding is required of how current breeding goals in sheep breeding programmes affect the objective carcass traits measured by these new grading systems. The use of X-ray computed tomography (CT) scanning allows accurate in vivo predictions of total weights of fat, muscle and bone in the whole carcass, in carcass regions or in non-carcass areas (e.g. internal body cavity) of the live animal. CT predicts total tissue weights in the live animal with greater accuracy than does ultrasound (Young et al., Reference Young, Nsoso, Logan and Beatson1996) and also enables the objective measurement of traits such as muscle volume or muscularity in specific body regions, for example in high-priced cuts (Navajas et al., Reference Navajas, Glasbey, McLean, Fisher, Charteris, Lambe, Bünger and Simm2006 and Reference Navajas, Lambe, McLean, Glasbey, Fisher, Charteris, Bünger and Simm2007). Therefore, CT scanning can be used to accurately predict carcass composition and muscle shape and distribution, and study how these traits are affected by current selection goals. This will allow current breeding programmes to be re-assessed with reference to future economic drivers. This study aimed to evaluate the effects of two variants of a multi-trait selection index for hill sheep on carcass composition and muscularity traits in lambs, as measured by the use of CT scanning.
Material and methods
Farms
Scottish Blackface sheep flocks were recorded on two Scottish hill farms that differed in climate, topography and vegetation quality. Castlelaw farm, in the Pentland Hills in Midlothian, provided a less harsh environment than Kirkton farm, in the Western Highlands. More detailed descriptions of the two farms and flocks are given in previous papers by Conington et al. (Reference Conington, Bishop, Waterhouse and Simm2004 and Reference Conington, Bishop, Lambe, Bünger and Simm2006a).
At both farms, ewes were brought off the hill into improved paddocks near the farm for lambing, to allow detailed pedigree recording. After lambing, ewes rearing single lambs (of both sexes at Castlelaw, but only ewe lambs at Kirkton) were returned to the hill with their lambs until weaning. Ewes rearing multiple lambs (or single male lambs at Kirkton) remained in improved paddocks until weaning. Male lambs were kept entire at both farms and remained in paddocks near the farm at Kirkton, as the hill vegetation at this farm was not of suitable quality to achieve acceptable growth rates for slaughter lambs.
Selection index
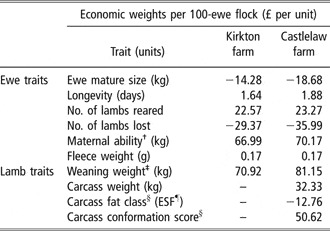
Both versions of the selection index used in this study have been described in detail in previous papers (Conington et al., Reference Conington, Bishop, Grundy, Waterhouse and Simm2001 and Reference Conington, Bishop, Lambe, Bünger and Simm2006a) and are described here in brief. The selection index used on both farms contained the 10 goal traits shown in Table 1 with suitable economic weightings on each trait (Conington et al., Reference Conington, Bishop, Waterhouse and Simm2004).
Breeding goal traits included in the current hill sheep selection index, with economic weight (per 100-ewe flock) for the version of the index used at each farm (Conington et al., Reference Conington, Bishop, Waterhouse and Simm2004)

†Total weight of lambs weaned/ number of lambs weaned.
‡Direct weaning weight measured on the lamb.
§As subjectively assessed by Meat and Livestock Commission (MLC) graders at the abattoir.
¶Estimated subcutaneous fat (ESF) proportion (Conington et al., Reference Conington, Bishop, Waterhouse and Simm2004).
The measured traits that were combined in the index were the same as the goal traits, except for the carcass traits, where ultrasonic fat and muscle depth measurements, together with the other traits, were used to predict carcass merit. However, different economic weights were applied to the traits on the two farms (Table 1). This resulted in two different versions of the index: the index for Castlelaw farm was tailored for hill farms that finish their own lambs for slaughter and was predicted to improve maternal characteristics and lamb growth, with negligible changes in fatness (Conington et al., Reference Conington, Bishop, Grundy, Waterhouse and Simm2001); the index for Kirkton farm was tailored for hill farms that sell their lambs as ‘store’ (to be finished for slaughter on other farms) and had economic weights of zero for the carcass traits. It is important to note that no CT-derived traits were included as breeding goals in either of these indices.
Selection lines
The genetic lines of sheep used in this study have been described in more detail in previous papers (Conington et al., Reference Conington, Bishop, Grundy, Waterhouse and Simm2001 and Reference Conington, Bishop, Lambe, Bünger and Simm2006a), and only a brief summary is provided here. Both flocks included animals from three separate genetic lines that were established in 1998: a selection line (S), where animals were selected according to their superiority in performance following genetic evaluation and calculation of previously described indices, a control line (C), where animals closest to the average flock performance were selected and an industry line (I), where animals were selected on adherence to industry-standard appearance. Lambs from the I line were not included in the analysis presented in the current paper, so will not be described further. Five top-ranking (S) and five average-ranking (C) ram lambs on each farm were chosen to be sires for use at mating in autumn 1998. Lambs born to the top index rams in 1999 and subsequent years were allocated to the selection (S) line, lambs born to average index sires were allocated to the control (C) line. Similar numbers of ewe lambs were chosen to be replacements for both lines, based on index scores, and retained each year to be mated for the first time at 18 months of age on each farm. The original, unselected ‘base’ ewes (born before 1999) were rotated between the three lines until they left the flock at the end of their normal lifespan. However, animals born within a line remained in that same line. For both farms, all three lines were managed together as one flock.
A similar selection strategy for sires was used in subsequent years, within-line, as was used in 1998, with five top-ranking (S) and five average-ranking (C) ram lambs on each farm chosen within-family to be sires. At Castlelaw farm, these ram lambs remained in the 10 single-sire mating groups for two cycles. At Kirkton farm, the ram lambs were replaced by their fathers for the second cycle of mating, due to harsher weather at mating time on this farm making it difficult to maintain condition of ram lambs.
Animals
A sample of lambs from the S and C lines in each flock was CT scanned at weaning in 2003, 2004 and 2005. The data set comprised data from 499 lambs in total: 174 from the S line and 199 from the C line at Castlelaw farm; 63 from each of the S and C lines at Kirkton farm. This accounted for between 19% and 30% of available lambs, depending on year and line, at Castlelaw farm and between 12% and 16% of available lambs at Kirkton farm. Age of lambs at scanning ranged from 96 to 145 days, with an average of 123 days. The lambs were born to ewes with age ranging from 2 to 6 years (2 to 5 years old only at Kirkton farm) and were reared either as singles (50%) or as twins (50%). Within-farm, sampled lambs had an average age at CT scanning of 126 days at Castlelaw farm and 116 days at Kirkton farm and average live weights of 31 kg (range 18 to 43 kg) at Castlelaw farm and 26 kg (range 16 to 39 kg) at Kirkton farm.
The sub-set of lambs chosen from the two lines, represented between three and five sires (from a possible five) per line per year at Castlelaw farm, and two sires per line per year (from a possible five) at Kirkton farm. Between 8 and 19 lambs were scanned per sire in each year. These lambs were chosen at random within sire, with equal numbers of males and female lambs, as far as possible. Only one sire, a selection line ram from Kirkton farm, had progeny scanned in two different years, and no sires had progeny scanned from both farms. The lambs were from a total of 271 dams at Castlelaw farm (193 of which had one lamb scanned, 64 had two lambs scanned, 6 had three lambs scanned, 6 had four lambs scanned, 2 had five lambs scanned, across years) and 102 dams at Kirkton farm (81 of which had one lamb scanned, 18 had two lambs scanned, 3 had three lambs scanned, across years).
CT scanning
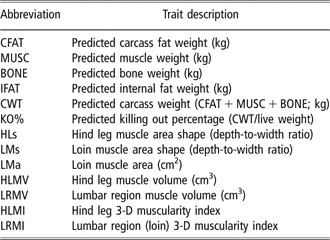
CT scanning protocols at the SAC BioSS Unit have been described in detail elsewhere (Jones et al., Reference Jones, Lewis, Young and Wolf2002b; Lewis et al., Reference Lewis, Macfarlane, Simm and Emmans2004; Lambe et al., Reference Lambe, Conington, McLean, Navajas, Fisher and Bünger2006). Therefore, here we provide only a summary and highlight the specifics relevant to this experiment. Cross-sectional CT reference scans were taken at four anatomical sites per lamb: ischium (ISC); hip (HIP); fifth lumbar vertebra (LV5); eighth thoracic vertebra (TV8). From these four images accurate estimates could be made of total weights of carcass fat, muscle and bone, as well as internal fat (the sum of mesenteric, omental, thoracic and kidney knob and channel fat depots) using previously derived prediction equations (Lambe et al., Reference Lambe, Conington, McLean, Navajas, Fisher and Bünger2006). Three different measures of 2-D muscle area shape were also made from these images (Lambe et al., Reference Lambe, Navajas, McLean, Simm and Bünger2007): (i) the ratio of depth to width of the hind leg muscle shown on the ISC scan, multiplied by 10 and averaged over both legs (HLs); (ii) the ratio of depth to width of the longissimus lumborum muscle, measured on the LV5 scan, multiplied by 10 and averaged over both sides (LMs); and (iii) average longissimus lumborum muscle areas of the two sides, measured on the LV5 scan (LMa). Increasing values of HLs and LMs therefore indicated a rounder muscle cross-section, which is associated with improved muscularity (Jones et al., Reference Jones, Lewis, Young and Wolf2002b).
A spiral CT scan was also taken, in which multiple contiguous cross-sectional scans of 8 mm thickness were collected from the proximal third of the tibia to the fourth to fifth cervical vertebra. From these scans, muscle volume in the hind leg (HLMV) and in the lumbar region (LRMV) could be accurately estimated, as described by Navajas et al. (Reference Navajas, Glasbey, McLean, Fisher, Charteris, Lambe, Bünger and Simm2006). Linear dimensions of the femur bone and spine, respectively, were measured from CT images, and combined with the muscle volume measurements to produce values for muscularity indices (3-D shape of a muscle) in the hind leg (HLMI) and in the lumbar region (LRMI) for each lamb, following the method of Navajas et al. (Reference Navajas, Lambe, McLean, Glasbey, Fisher, Charteris, Bünger and Simm2007). Therefore, increased values for these muscularity indices represented a greater volume of muscle relative to the length of the bone that it surrounded (De Boer et al., Reference De Boer, Dumont, Pomeroy and Weniger1974, Purchas et al., Reference Purchas, Davies and Abdullah1991). A list of the CT traits studied and their abbreviations that will be used hereafter are presented in Table 2.
Computed tomography traits measured and abbreviations

Statistical analyses
REML analyses were performed using Genstat (GenStat 8 Committee, 2005) to estimate predicted means for the effect of genetic line. Analyses were performed within-farm, to investigate the differences between the versions of the index used on the different farms: Castlelaw farm having economic weights applied to carcass traits and Kirkton farm where economic values for these traits were zero.
The model fitted for each trait, at each farm, contained either age (in days) or live weight at the time of CT scanning as a covariate, alongside the main fixed effects of sex, year, rearing rank at 1 week of age (single or twin) and dam age (in years). The one exception was LRMV at Kirkton farm, adjusted for age, where only sex and year were fitted to allow convergence. Two-way interactions between these four main factors were also tested in the fixed effects model (using a stepwise elimination procedure and multiple linear regression) and interactions that were significant for each individual trait, within farm, were included. Higher order interactions were not tested, as the data sets were limited in size, especially for Kirkton farm, and very low numbers would have been included in some sub-groups. Line was also fitted as a fixed effect for each trait, to produce predicted means. The random effect of dam was fitted as well as sire, since few sires were represented in each contemporary group of lambs, especially at Kirkton farm (n = 126 lambs in total), and fitting sire alone was heavily confounded with year and line within farm.
Residual values from each lamb were produced from the REML analyses after adjusting for the effects in the model (either with age or live weight as the covariate), for each variable of interest, and correlations between traits were estimated, within-farm using these residuals.
A previous study (Lambe et al., Reference Lambe, Navajas, McLean, Simm and Bünger2007) on constituents of growth in Texel and Blackface lambs from 8 weeks of age until slaughter, tested for non-linearity in many of the same CT traits presented here. In all cases, live weight accounted for a similar percentage of variance when fitted in a linear or non-linear (quadratic or logistic) model. Therefore it was assumed here that at weaning, growth in different tissues and increases in muscularity traits are close to linear and linear associations only were tested.
Results
Direct response to selection
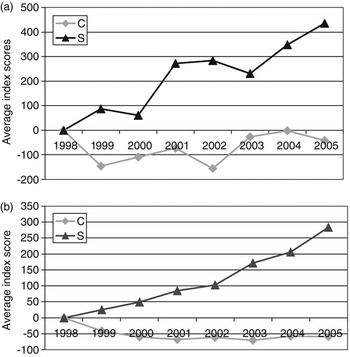
Average index scores were calculated for each line, each year on each farm. Since selection began, divergence in average index scores has increased between the S and C lines on both farms (Figure 1a and b).
Average index scores for each line, each year at Castlelaw (a) and Kirkton (b) farms.

Indirect responses in lamb CT traits
Positive economic weightings applied to carcass weight and conformation class in the selection index used on Castlelaw farm were expected to increase CWT and possibly muscularity traits at this farm, whereas the negative weighting on carcass fat class was expected to result in a minimal reduction in CFAT. Minimal changes in composition and muscularity traits were expected at Kirkton farm as a result of selection on the index.
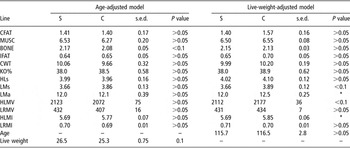
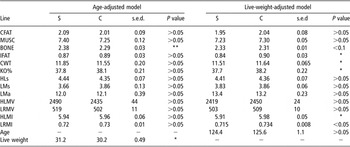
When lambs were compared at a constant age or live weight at Kirkton farm (Table 3) none of the conformation traits differed significantly between lines. S line lambs had heavier live weights than C line lambs at a constant age, although this difference was not significant in this relatively small sample of lambs (P = 0.1). At Castlelaw (Table 4), live weights of S line lambs were also around 1 kg on average heavier than C line lambs at a constant age, which was statistically significant, and BONE was significantly higher, but no other compositional differences were significant. At a fixed live weight, C lambs tended to have higher fat levels (CFAT and IFAT) than S lambs on both farms (Tables 3 and 4), although only in IFAT at Castlelaw farm was this difference significant, where the predicted means were only 60 g different. At Castlelaw farm, C lambs also had higher means than S lambs for CWT and KO% (by approximately 0.1 kg and 0.5, respectively). MUSC did not differ significantly between lines at a fixed age or live weight.
Predicted means for each trait, standard errors of difference (s.e.d.), and significance of the difference between selection (S) and control (C) lines at Kirkton farm (carcass traits not included in the index)

*Significant difference, P < 0.05.
Predicted means for each trait, standard errors of difference (s.e.d.), and significance of the difference between selection (S) and control (C) lines at Castlelaw farm (carcass traits included in the index)

*Significant difference, P < 0.05; **Significant difference, P < 0.01.
No significant differences were estimated in muscle area shape or muscularity traits at a fixed age on either farm. However, at a fixed live weight, predicted means for these traits tended to be higher in the C than in the S line lambs, with significant differences in LMa and HLMI at Kirkton (Table 3) and LRMI at Castlelaw (Table 4).
In summary, selection on the index including maternal and growth traits only has resulted in no change in carcass weight or composition compared with control line lambs. Selection on an index including carcass traits has resulted in reductions in internal fat weight, carcass weight and killing out percentage, at a given live weight. The inclusion of carcass traits in the version of the index used at Castlelaw farm did not have a substantial positive effect on composition traits, when compared with Kirkton farm, which used the version of the index with no weighting for carcass traits. No clear effect of the selection index on muscle shape and muscularity (when compared with the C line) was apparent from the results using either version of the index. There is in fact some evidence that, at a fixed live weight, muscularity in hind leg and lumbar regions may be higher in the control line.
Relationships between CT traits
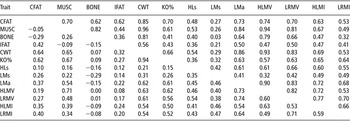
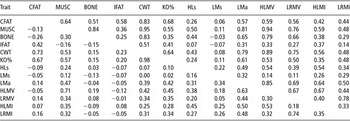
After adjusting for age (Tables 5 and 6, above the diagonal), the correlations among carcass composition traits (CFAT, MUSC, BONE, IFAT, CWT, KO%) were moderate to high and positive on each farm. Correlations between these traits and the muscle shape traits (HLs, LMs, LMa) or the muscularity traits (HLMV, LRMV, HLMI, LRMI) were also moderate to high and positive, with the exception of LMs, which had low correlations with carcass composition traits on both farms, and IFAT which had low to moderate correlations with muscle shape and muscularity traits at Castlelaw. Correlations amongst the muscle shape and muscularity traits were, again, moderate to high and positive, but were lower between LMs and other traits.
Residual correlations between traits at Kirkton farm, after adjusting for the model including the covariate age (shown above the diagonal) or live weight (shown below the diagonal)

Correlation coefficients >0.17 are significantly different from zero (P < 0.05).
Residual correlations between traits at Castlelaw farm, after adjusting for the model including the covariate age (shown above the diagonal) or live weight (shown below the diagonal)

Correlation coefficients >0.10 are significantly different from zero (P < 0.05).
When traits were adjusted for live weight, rather than age (Tables 5 and 6, below the diagonal), the correlations between total weights of fat (CFAT or IFAT) and MUSC or BONE were negative. CFAT and IFAT were moderately positively correlated. CWT and KO% were most highly correlated with CFAT then MUSC at Castlelaw (Table 6), but correlations of these traits with CFAT and MUSC were similar in size at Kirkton (Table 5). The correlations between CWT and KO% were 0.98 and 0.94, respectively. IFAT and BONE were not strongly correlated with any of the muscle shape or muscularity traits at either farm. MUSC, CWT and KO% showed moderate to high positive correlations with LMa and all four muscularity traits (muscle volumes and muscularity indices) and at Kirkton, CFAT was also moderately correlated with these traits. Correlations amongst the muscle shape and muscularity traits tended to be moderate in size, but higher at Kirkton than Castlelaw.
Discussion
Both versions of the multi-trait index used here combine lamb and maternal characteristics in an attempt to increase the overall economic performance of hill flocks, with the emphasis largely on maternal traits. Although the use of these indices has led to substantial improvements in overall index score and increased weaning weights (Conington et al., Reference Conington, Bishop, Lambe, Bünger and Simm2006a), they appear to have had little effect on carcass characteristics. Several factors may be contributing to this. No precise expectations were estimated for carcass composition traits, such as fat and lean weights, during the original index calculations. The breeding goal traits relating to carcass quality, which were predicted originally and included in the index at Castlelaw farm, were carcass weight, conformation class and fat class (as assessed by an MLC scorer after slaughter at the abattoir), since when the index was developed 7 years ago, these were the most relevant economic traits. These carcass traits had relatively low economic weightings, while the main traits driving the index were weaning weight and the maternal traits (Table 1). The economic benefit of increased carcass weight was calculated at a constant weaning weight and mature weight, to avoid double-accounting in the index calculations of the benefit of having heavier lambs (Conington et al., Reference Conington, Bishop, Waterhouse and Simm2004). The subjective nature of MLC fatness and conformation score and the inconsistent financial reward for improving these traits may be under-valuing the importance of improving carcass compositional quality, in terms of the economic values awarded. Additionally, the heritability of MLC conformation and fatness scores in hill sheep are low (0.09 and 0.17, respectively, Conington et al., Reference Conington, Bishop, Grundy, Waterhouse and Simm2001), partly due to the problems with repeatability of these scoring systems, so when included in a multi-trait selection index with several other traits, little progress is expected. This is also influenced by unfavourable genetic correlations with several other index traits (Conington et al., Reference Conington, Bishop, Grundy, Waterhouse and Simm2001). This is acknowledged and explained by Conington et al. (Reference Conington, Bishop, Lambe, Bünger and Simm2006a), in a study considering changes in lamb growth and carcass traits that are included in this index. These authors suggest that more effective progress could be made in improving hill lamb carcass quality by replacing conformation and fatness grades with goal traits that are less subjective and more accurate at assessing carcass fat and lean meat yield or distribution. Although conformation and fatness scores are considered important economic traits under the present pricing structure for lamb carcasses, future payment schemes are likely to be based around weights or proportions of lean meat in the carcass or prime cuts, which will become the more relevant traits relating to carcass quality. The precision of predicting total meat yield, or lean meat yield, in the total carcass and in component cuts, has been shown to be substantially higher using VISA than using MLC standard scores (Rius Vilarrasa et al., 2007). Studies in terminal sire breeds of lambs (Jones et al., Reference Jones, Simm, Dingwall and Lewis1999) have found very little genetic association between MLC conformation scores and weights of fat or lean in the carcass. Even when carcass attributes were included in the goal traits of the present selection index (predicted by ultrasound measures of fat and muscle depth), there was no improvement in carcass composition, in terms of increasing muscle and maintaining or decreasing fat. Total fat weight and total muscle weight in the carcass or muscularity traits relating to high-priced cuts, as predicted by CT, may be better alternative goal traits. Heritabilities have been estimated for the CT carcass composition and muscle shape traits presented here, using data from the same Scottish Blackface lambs (Conington et al., 2006b). These traits were all moderately heritable except for IFAT (h 2 = 0.02), with MUSC and CFAT having heritabilities of 0.21 and 0.27, respectively. CT is more accurate than ultrasound at predicting total muscle weight in the carcass (Young et al., Reference Young, Nsoso, Logan and Beatson1996), so it is possible that it may accelerate changes in carcass composition when included in a multi-trait selection index for hill sheep, as has been found for other breeds (Jopson et al., Reference Jopson, McEwan, Dodds and Young1995 and Reference Jopson, McEwan, Fennessy, Dodds, Nicoll and Wade1997).
When considering data at a fixed live weight, the ratio between predicted means results in a higher muscle-to-bone ratio (M : B) in C than S line lambs on both farms (3.07 v. 3.02 at Kirkton farm, 3.16 v. 3.10 at Castlelaw farm), due to lower bone weights, but higher muscle weights, although the differences in predicted means for each component trait fell below significance. M : B has been found to be positively associated, both genetically and phenotypically, with muscularity in specific carcass regions in earlier studies (Waldron et al., Reference Waldron, Clarke, Rae and Woods1992; Purchas and Wilkin, Reference Purchas and Wilkin1995; Jones et al., Reference Jones, Lewis, Young and Simm2004; Navajas et al., Reference Navajas, Lambe, McLean, Glasbey, Fisher, Charteris, Bünger and Simm2007). This is consistent with the results shown here, where C line lambs tend to have higher muscularity indices (HLMI and LRMI) than S line lambs and suggests that selection on the current index does not result in improvements in these CT-derived traits. The lack of significant differences in muscle weights or volumes between lines, despite differences in muscularity indices (a function of muscle volumes divided by lengths of the bones that they surround) may suggest that the C line lambs have shorter bone lengths at a fixed live weight, rather than increased muscle. Muscularity, in terms of the amount of muscle relative to bone length, is an important contributor to conformation and also leads to plumper leg joints and larger chops, which are preferred by consumers (Laville et al., Reference Laville, Bouix, Sayd, Bibe, Elsen, Larzul, Eychenne, Marcq and Georges2004). However, the use of new grading systems, such as VISA, will award for measurements linked to increased muscle weights in the carcass, or high-priced carcass regions, rather than for shape traits such as muscularity indices. It is possible that the direct inclusion of the most relevant CT-derived muscularity traits into hill sheep breeding indices will indeed result in improvements in these traits, if given appropriate economic weightings.
A previous study by Navajas et al. (Reference Navajas, Lambe, McLean, Glasbey, Fisher, Charteris, Bünger and Simm2007), measured some of the same muscle area shape and muscularity traits reported here (HLs, HLMI, LRMI) in a population of unselected Scottish Blackface lambs and Texel lambs, and compared these traits to each other and to post mortem carcass traits, after adjusting for carcass weight. These authors found that muscle shape or muscularity at a constant weight was positively correlated with total weight of muscle in the carcass (correlations with all three traits in the range 0.3 to 0.4), but had little association with total weight of fat. Positive genetic and phenotypic correlations with muscularity traits were also estimated for muscle weight predicted by dissection in Romney and Romney-cross lambs (Waldron et al., Reference Waldron, Clarke, Rae and Woods1992) and Texel lambs (Wolf et al., Reference Wolf, Jones and Owen2006), and for muscle weight predicted by CT in three terminal sire breeds (Jones et al., Reference Jones, Lewis, Young and Simm2004). Similar correlations are reported here between the CT muscularity indices and MUSC (total carcass muscle weight as measured by CT) at both farms, implying that the inclusion of MUSC as a breeding goal in an index for Scottish Blackface sheep would also result in an increase in muscularity indices. The correlations with CFAT estimated at Castlelaw agree well with the results of Navajas et al. (Reference Navajas, Lambe, McLean, Glasbey, Fisher, Charteris, Bünger and Simm2007), in that muscularity indices at a constant weight have little association with total weight of fat. Studies on different sheep breeds have estimated low or negative genetic and phenotypic correlations between carcass fat weights and muscularity measurements (Waldron et al., Reference Waldron, Clarke, Rae and Woods1992; Jones et al., Reference Jones, Lewis, Young and Simm2004; Wolf et al., Reference Wolf, Jones and Owen2006). On the contrary, the Blackface lambs in the present study at Kirkton, which originate from a different genetic background from those at Castlelaw, showed moderate positive correlations between CFAT and muscularity indices after correcting for live weight (r p∼0.4). This may suggest that selection against CFAT could reduce muscularity in this population, or that selection for increased muscularity could increase CFAT. However, it must be emphasised that these are phenotypic correlations. Genetic correlations are not estimated here, which would give a better indication of the effects of different breeding goals on other traits of importance. For example, Jones et al. (Reference Jones, Lewis, Young and Simm2004) estimated positive phenotypic correlations between CFAT and some muscularity measurements estimated by CT, but the associated genetic correlations were negative.
Measures of muscularity and muscle shape in different regions of the carcass were positively correlated at both farms, but are different traits (correlations are not close to 1). Similar results have been found in other studies that have investigated muscularity in different carcass areas or using different measurements (e.g. Waldron et al., Reference Waldron, Clarke, Rae and Woods1992; Jones et al., Reference Jones, Lewis, Young and Simm2004; Navajas et al., Reference Navajas, Lambe, McLean, Glasbey, Fisher, Charteris, Bünger and Simm2007; Wolf et al., Reference Wolf, Jones and Owen2006). Navajas et al. (Reference Navajas, Lambe, McLean, Glasbey, Fisher, Charteris, Bünger and Simm2007) also found that MLC conformation grade, awarded to Scottish Blackface lamb carcasses after slaughter, had a higher correlation with HLMI (0.52) than with HLs (0.21) or LRMI (0.14), which agrees with Laville et al. (Reference Laville, Bouix, Sayd, Bibe, Elsen, Larzul, Eychenne, Marcq and Georges2004) that conformation is mainly influenced by hind leg muscularity. However, in the population studied here from Castlelaw farm, the selection pressure to increase conformation grade resulting from the multi-trait selection index was not sufficient to have a positive effect on any of the muscularity traits.
Maternal sheep breeds, specialising in production of breeding females, have been shown to have higher killing-out percentages and higher levels of internal fat than breeds specialising in the production of terminal sire rams (Wood et al., Reference Wood, MacFie, Pomeroy and Twinn1980 and Reference Wood, MacFie and Brown1983). These authors speculated that the higher internal fat levels in ewe breeds may be linked to milk production. Higher levels of IFAT and higher KO% were observed in the C line lambs at Castlelaw farm at a given live weight in the present study. A parallel study, involving CT scanning of ewes from Castlelaw farm, which are related to the lambs scanned here, estimated high genetic correlations between IFAT in ewes and in lambs, which suggests that increased IFAT levels in the C line lambs will be carried on to adulthood in breeding ewes (unpublished results). However, this observed difference in IFAT between C and S lambs was only 60 g at a fixed live weight and was not significant when lines were compared at the same age. Initial results on reproductive performance from the current selection experiment suggest that maternal ability (total weight of lambs/ number of lambs reared), which is also included in the index, is actually higher in the S than in the C line ewes.
Research in New Zealand and the UK (mainly in terminal sire sheep breeds) has found that the most cost-effective way to use CT scanning to accelerate improvements in carcass quality in sheep breeding programmes is as part of a ‘two-stage’ selection strategy (Jopson et al., Reference Jopson, McEwan, Dodds and Young1995, Reference Jopson, McEwan, Fennessy, Dodds, Nicoll and Wade1997 and Reference Jopson, Amer and McEwan2004; Jones et al., Reference Jones, Lewis, Young and Simm2002a; Young et al., 2002; Macfarlane, 2006). The first stage involves screening of all selection candidates using live weight and ultrasound fat and muscle depth (alongside other relevant traits). The top-performing 15% to 20% of rams on these criteria are then CT scanned in the second stage of selection and relevant traits (e.g. CFAT and MUSC) measured to select the final rams for breeding. This is likely to be the most efficient method of incorporating CT scanning into hill sheep breeding programmes, such as the one described in this paper. In this way, it is predicted that improvements in carcass quality could be achieved, alongside those already being made in maternal and growth traits. Work is currently underway to model the effects of including CT in the current selection index. This would allow production of hill lambs that are better able to meet new grading specifications when objective VISA machines are installed in commercial abattoirs.
Acknowledgements
The authors are grateful to the Department for Environment, Food and Rural Affairs (Defra) for funding this research. We thank staff at the SAC farms for management of the flocks and data collection and staff at the SAC/BioSS CT unit for image analysis.