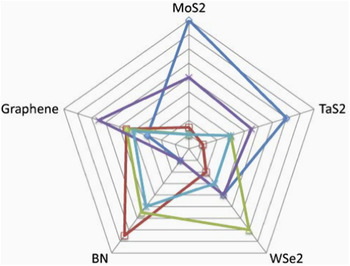
I. GRAPHENE AS A TUNNEL BARRIER
In this section, we describe the novel use of graphene as a tunnel barrier for both charge and spin transport. Graphene is typically studied for its extraordinary in-plane conductance properties, Reference Tombros, Jozsa, Popinciuc, Jonkman and van Wees1–Reference Han, Pi, McCreary, Li, Wong, Swartz and Kawakami3 while its out-of-plane transport properties are largely ignored. Reference Lee, Kim and Lee4 Graphene is metallic in-plane due the large availability of conduction channels. In contrast, there are substantially fewer out-of-plane conduction channels, resulting in a low resistivity in that configuration. Reference Krishnan and Ganguli5 A tunnel barrier is comprised of two electrodes separated by a thin insulator where current flows between the electrodes entirely by quantum mechanical tunneling. Graphene exhibits many of the characteristics expected for an ideal tunnel barrier. The strong in-plane sp 2 bonding of carbon atoms results in a strong tendency to form complete, defect-free monolayers, enabling tunnel barriers with discrete thicknesses. Graphene is chemically inert, and thus prevents the electrodes from intermixing with the tunnel barrier material and/or chemically altering the electrodes. Graphene is also impervious to diffusion, forming a natural diffusion barrier between the two electrodes. Reference Chen, Brown, Levendorf, Cai, Ju, Edgeworth, Li, Magnuson, Velamakanni, Piner, Kang, Park and Ruoff6,Reference Martin, Dlubak, Weatherup, Piquemal-Banci, Yang, Blume, Schloegl, Collin, Petroff, Hofmann, Robertson, Anane, Fert and Seneor7 It is thermally robust, which allows for an increased thermal budget of the overall structure. As theory predicts, graphene can also be an excellent spin filter in combination with a few selected ferromagnetic (FM) contacts. Reference Karpan, Giovanetti, Khomyakov, Talanana, Starikov, Zwierzycki, van den Brink, Brocks and Kelly8,Reference Yazyev and Pasquarello9 We show here that while graphene exhibits metallic conductivity in-plane, it serves effectively as an insulator for transport perpendicular to the plane, and provide the first demonstration of two potential applications.
Future devices based on tunnel barriers will require much improved tunnel barrier materials. An ideal tunnel barrier should exhibit several key material characteristics: uniform, well-controlled thickness, minimal defect/trapped charge density, a low resistance-area (RA) product for minimal power consumption, and compatibility with materials of choice, ensuring minimal diffusion to/from the surrounding materials at temperatures required for device processing. These requirements have remained beyond the reach of contemporary oxide-based tunnel barriers. This is especially apparent in semiconductor spintronic devices, where a tunnel barrier is essential to overcome the conductivity mismatch between the ferromagnet and the semiconductor. Reference Schmidt, Ferrand, Molenkamp, Filip and van Wees10–Reference Fert and Jaffres12 Semiconductor spintronics aims to incorporate the electron spin into complementary metal-oxide semiconductor (CMOS) like devices. Reference Awschalom and Flatte13,Reference Zutic, Fabian and Das Sarma14 New paradigms for spin-based devices, such as spin field effect transistors (spin-FETs) Reference Sugahara and Nitta15 and reconfigurable logic, have been proposed and modeled. Reference Dery, Dalal, Cywinski and Sham16–Reference Behin-Aein, Datta, Salahuddin and Datta19 These devices rely on electron spin being injected, transported, manipulated, and detected in a semiconductor channel. These new spin-based technologies promise to combine the advantages of charge-based dynamic memory (speed, and solid state) with those of magnetic storage (nonvolatility, low power, and radiation hardness). For example, spin-torque magnetic random access memory Reference Kawahara, Ito, Takemura and Ohno20 based on magnetic tunnel junctions (MTJs) Reference Moodera, Kinder, Wong and Meservey21,Reference Miyazaki and Tezuka22 has made great advances in recent years through a better understanding of the science behind spin transport and manipulation, with the first commercial chips now available. 23
Here we will show how a single layer of graphene can be used as an atomically thin tunnel barrier in a MTJ, preserving the spin polarization of the electrons while providing thickness control unattainable with traditional oxide materials. We have measured out-of-plane transport through a single layer of graphene by fabricating metal–graphene–metal junctions using two FM metals, in an MTJ structure. Reference Cobas, Friedman, van 't Erve, Robinson and Jonker24,Reference Cobas, Friedman, van 't Erve, Robinson and Jonker25 We observed spin-polarized electron tunneling clearly measureable even above room temperature. Secondly, we demonstrated the use of graphene as a tunnel barrier for spin injection into a silicon channel Reference van 't Erve, Friedman, Cobas, Li, Robinson and Jonker26–Reference van 't Erve, Friedman, Cobas, Li, Robinson and Jonker28 and silicon nanowires. Reference van 't Erve, Friedman, Li, Robinson, Connell, Lauhon and Jonker29 The spin injection resistances achieved are three orders of magnitude lower than that for comparable oxide tunnel barrier contacts and fall within a critical window of values required for practical devices. These results enable realization of semiconductor spintronic devices such as spin-based transistors, logic and memory.
II. GRAPHENE BASED MTJS
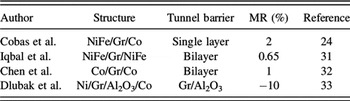
In contrast to the large number of reports in the literature on the lateral charge transport and lateral spin transport through graphene, the out-of-plane properties have been overlooked. Reference Lee, Kim and Lee4 Although highly conductive in-plane, graphene exhibits poor conductivity out-of-plane. Reference Krishnan and Ganguli5 Spin transport of hot electrons through 7–17 nm thick graphite flakes perpendicular to the layer plane was demonstrated using scanning tunneling microscopy based techniques. Reference Banerjee, van der Wiel and Jansen30 Perpendicular transport through multilayers of FM/Graphene/FM has been studied in the conductive regime, although early results were complicated by space–charge effects or oxidation, see Table I, where MR is magnetoresistance. Reference Lee, Kim and Lee4,Reference Mohiuddin, Hill, Elias, Zhukov, Novoselov and Geim34
Vertical spin transport across Graphene.

Measuring graphene's out-of-plane conductivity is quite complicated due to the presence of highly conductive edge states, Reference Acik and Chabal35 which also manifest near grain boundaries, that can effectively short out any intrinsic out-of-plane transport. Here, by carefully avoiding graphene's conductive edge states, we examine the spin-polarized tunnel transport across a layer of graphene in a MTJ structure. Reference Cobas, Friedman, van 't Erve, Robinson and Jonker24,Reference Cobas, Friedman, van 't Erve, Robinson and Jonker25,Reference Iqbal, Iqbal, Lee, Kim, Chun and Eom31,Reference Chen, Meng, Zhou, Wu, Bie, Liao and Yu32
A. Fabrication
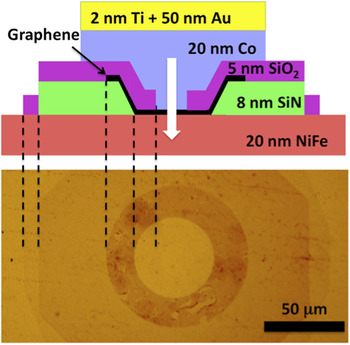
Standard microfabrication techniques were used to produce an array of NiFe bottom electrodes on an SiO2/silicon wafer. A single sheet of graphene, grown by chemical vapor deposition (CVD), Reference Li, Magnuson, Venugopal, Tromp, Hannon, Vogel, Colombo and Ruoff36 was transferred from its original copper foil substrate to the electrode array and patterned using polymethyl methacrylate (PMMA) resist and deep-UV photolithography. The graphene's conductive edge states are buried in a layer of SiN and a Co top electrode is deposited. Reference Cobas, Friedman, van 't Erve, Robinson and Jonker24 A schematic of a device is shown in Fig. 1.
Schematic cross-sectional diagram of a graphene MTJ and optical photo of a junction prior to top contact deposition.

B. Results
Initial room temperature I–V characterization shows a nonOhmic junction with the increased low bias resistivity typical of tunnel junctions (Fig. 2). The temperature dependence of the junctions' zero bias resistance (ZBR), a characteristic measure of tunnel barrier quality, Reference Jonsson-Akerman, Escudero, Leighton, Kim, Schuller and Rabson37 shows the weak decrease with the temperature characteristic of tunneling transport rather than the weak increase or dramatic decrease in resistance characteristic of metal and semiconductor transport, respectively. Reference Sze and Ng38 Normalizing the individual junction resistances to their room temperature values shows that the junction resistances fall by a factor of about 3.5 in the temperature range 10–300 K (Fig. 2, inset), comparable to factors of 2.5 reported for high quality tunnel junctions. Reference Jonsson-Akerman, Escudero, Leighton, Kim, Schuller and Rabson37
Typical nonlinear current–voltage characteristics of a graphene tunnel junction at various temperatures. Inset: ZBR of several graphene MTJs normalized to their room temperature resistances, showing a weak temperature dependence.

In canonical tunnel junctions, the resistance depends on the ability of electrons from the emitter to tunnel into available states of matching polarization in the collector. When the electrodes are oppositely magnetized, the majority-spin density of states in the emitter corresponds to the smaller minority spin density of states in the collector and vice versa. Consequently, resistance is higher in the antiparallel configuration than in the parallel case where majority-spin states in the electrodes have the same polarization.
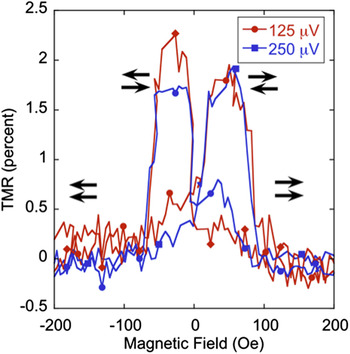
When an in-plane magnetic field is applied, the magnetizations of the NiFe and Co electrodes reverse at fields corresponding to their respective coercivities, with the NiFe switching at a much lower field than the Co. Their magnetizations can thus be aligned either parallel or antiparallel, and two distinct resistance states are observed in the data, as seen in Fig. 3. The junction resistance can be controllably and reversibly switched from a low-resistance parallel state to a higher resistance antiparallel state with the applied field. At low temperatures and low biases, where the physics of tunneling are simplest and most evident, the tunnel magnetoresistance (TMR) reaches a value of 2%. Reference Cobas, Friedman, van 't Erve, Robinson and Jonker24,Reference Cobas, Friedman, van 't Erve, Robinson and Jonker25
Graphene junction TMR curves at a low temperature (T = 4 K), showing the typical MTJ switching behavior at low bias voltages of 0.125 and 0.250 mV. The arrows indicate the relative orientation of the NiFe and Co contacts.

Several authors have predicted a large spin-filtering effect at the interface between graphene and various FM metals including nickel, cobalt, and iron. Reference Yazyev and Pasquarello9,Reference Karpan, Khomyakov, Starikov, Giovannetti, Zwierzycki, Talanana, Brocks, van den Brink and Kelly39 The theoretical prediction rests on the peculiar band structure of graphene at the Fermi level and its interaction with the spin-polarized band structure of the metals. This prediction is similar to that of spin filtering at Fe/MgO interfaces Reference Butler, Zhang, Schulthess and MacLaren40,Reference Mathon and Umerski41 which was quickly verified experimentally Reference Bowen, Cros, Petroff, Fert, Martinez Boubeta, Costa-Kramer, Anguita, Cebollada, Briones, de Teresa, Morellon, Ibarra, Guell, Peiro and Cornet42 and has since led to room temperature TMR in excess of 200%. Reference Parkin, Kaiser, Panchula, Rice, Hughes, Samant and Yang43,Reference Yuasa, Nagahama, Fukushima, Suzuki and Ando44 The mechanisms leading to spin filtering are quite different, however. In Fe/MgO, it derives from band symmetry effects, while in FM/graphene it derives from band alignments, i.e., the positions of the majority/minority spin bands relative to E F.
We have recently shown that using multi-layer graphene as the tunnel barrier between NiFe and Co produces a negative magnetoresistance of 20%, which is a direct consequence of the spin-filtering qualities of graphene. Reference Cobas, van 't Erve, Robinson and Jonker45
III. GRAPHENE IN SEMICONDUCTOR SPINTRONIC DEVICES
In semiconductor spintronic devices, spin-polarized electrons are injected into a semiconductor channel, where the spins are transported, manipulated, and finally detected at the collector. Silicon (Si) is an attractive host for such a spin-based technology, because of its technological importance as the backbone of modern electronics and its low atomic mass and crystal inversion symmetry result in very small spin orbit interactions and long spin lifetimes. Reference Jansen46
FM metals seem like the ideal candidates as contacts for electrical injection and detection of spin currents in the semiconductor channel. Any current in a ferromagnet is naturally spin polarized at temperatures far above room temperature. Reference Monsma and Parkin47 However, maintaining this spin polarization while the current is transferred from the ferromagnet into silicon is impossible due to the large difference in conductivity. A tunnel barrier between the FM metal and semiconductor was identified as a potential solution and extensive effort has been directed toward developing appropriate tunnel barriers for spin contacts. Reference Rashba11 Most work has focused on either a reverse biased FM (Refs. Reference Hanbicki, Jonker, Itskos, Kioseoglou and Petrou48 and Reference Hanbicki, van 't Erve, Magno, Kioseoglou, Li, Jonker, Itskos, Mallory, Yasar and Petrou49) Schottky barrier, or an insulating oxide layer such as Al2O3 or MgO with a FM metal contact. Reference Dash, Sharma, Patel, de Jong and Jansen50–Reference Sugiyama, Ishikawa, Inokuchi, Tanamoto, Saito and Tezuka56
Metal Schottky barriers and oxide layers are susceptible to interdiffusion, interface defects, and trapped charge, which have been shown to compromise spin injection/transport/detection. Reference Tran, Jaffrès, Deranlot, George, Fert, Miard and Lemaître57,Reference Jansen, Deac, Saito and Yuasa58 FM metals readily form silicides even at room temperature, Reference Klasges, Carbone, Eberhardt, Pampuch, Rader, Kachel and Gudat59 and diffusion of the FM species into the Si creates magnetic scattering sites, limiting spin diffusion lengths and spin lifetimes in the Si. Reference Jansen and Modeera60 Oxide barriers of atomic thickness contain unavoidable pinhole leaks. Reference Zaleski, Wrona, Czapkiewicz, Skowroński, Kanak and Stobiecki61 The additional thickness needed to avoid pinholes results in contacts with high resistance, increased power consumption and contact resistances outside the window of RA products essential for efficient spin injection/detection.
Graphene offers a compelling alternative—a single monolayer provides a much lower RA product than a film of any oxide thick enough to prevent pinholes (∼1 nm). A FM metal/monolayer graphene contact can serve as a spin-polarized tunnel barrier contact which successfully circumvents the classic metal/semiconductor conductivity mismatch issue for electrical spin injection.
A. The devices
Three types of tunnel barriers, SiO2, Al2O3, and graphene, were fabricated on identical Si substrates. Here, 2 nm of SiO2 was grown on HF etched Si using plasma oxidation to obtain pinhole-free barriers. Al2O3 tunnel barriers are routinely used in research grade and commercially available MTJs. Here, a 1.5 nm thick Al2O3 layer is grown in situ by a two-step natural oxidation process. Finally, Graphene was synthesized via low-pressure CVD on a copper foil substrate using methane gas and transferred onto hydrogenated Silicon using conventional wet chemical processing. Reference Li, Magnuson, Venugopal, Tromp, Hannon, Vogel, Colombo and Ruoff36 The typical grain size of the graphene films is of several hundred micrometers. The quality of the graphene was assessed using Raman spectroscopy, the absence of the “D” line (∼1350 cm−1) associated with defects, and the widths and ratios of the “G” (∼1580 cm−1) and “2D” (∼2700 cm−1) lines confirm that the graphene is of high quality with minimal defects.
During device fabrication, care was taken to isolate conducting edges of graphene Reference Chae, Jung, Woo, Baek, Ha, Song, Son, Zhitenev, Stroscio and Kuk62 by burying them in a layer of sputter-deposited Si3N4. For this study, n-type Si (001) wafers with donor concentrations of 1 × 10¹⁹, 3 × 10¹⁹, and 6 × 10¹⁹ were used. The top electrode for all three types of tunnel barriers is sputter-deposited Ni80Fe20. A schematic of the device used in this study is found in Fig. 4.
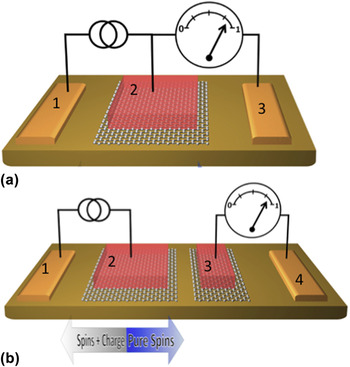
(a) Schematic view of the 3T device, contacts 1 and 3 are Ohmic, contact 2 is a Au capped Ni80Fe20/graphene tunnel barrier. (b) Schematic of the nonlocal spin-valve device, contacts 1 and 4 are ohmic contacts applied directly to the Si substrate, and contacts 2 (1 μm wide) and 3 (200 nm wide) are Au capped Ni80Fe20/graphene tunnel barriers for electrical spin injection and detection.

B. The results
Electrical measurements were performed in a cryogen-free cryostat and electromagnet set-up using 3- and 4-terminal configurations, as depicted in Fig. 4(a) and described below.
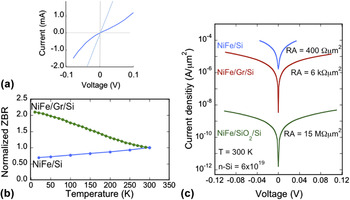
Figure 5(a) shows the typical I–V curve at 300 K for NiFe/monolayer graphene/Si (6 × 1019 cm−3) contacts and NiFe/Si (6 × 1019 cm−3) contacts. The I–V curve for the contact without graphene is completely linear, as is expected, for this type of Ohmic contact. However the inclusion of a single layer of graphene completely changes the nature of this contact and a nonlinear I–V curve is observed. The weak temperature dependence of the ZBR of the NiFe/graphene/Si contact confirms that transport occurs by tunneling through a pinhole free tunnel barrier, Reference Jonsson-Akerman, Escudero, Leighton, Kim, Schuller and Rabson37 and provides a more definitive test for tunneling than fitting to a parabolic model. Reference Simmons63,Reference Brinkman, Dynes and Rowell64
(a) I–V curve at 300 K. The ohmic NiFe/Si contacts exhibit metallic behavior and the NiFe/graphene/Si is nonlinear. (b) The normalized ZBR shows a weak insulator-like temperature dependence for the NiFe/graphene/Si contact, confirming tunnel transport. A metallic behavior of the NiFe/Si contact is observed. (c) The current–voltage curves and corresponding RA products of NiFe/Si, NiFe/graphene/Si, and NiFe/2 nm SiO2/Si contacts. The Si electron density is 6 × 1019 cm−3.

Graphene serves as a highly conductive tunnel barrier, as demonstrated in Fig. 5(c) by a comparison of the room temperature zero bias RA products and current density versus voltage curves of three types of contacts to the Si (6 × 1019 cm−3) substrate: NiFe/Si (ohmic), NiFe/graphene/Si (tunneling), and NiFe/2 nm SiO2/Si (tunneling) contacts. NiFe deposited directly on the Si forms an ohmic contact with a zero bias RA product of 0.4 kΩ μm2, and the conductivity increases with decreasing temperature [metallic-like, Fig. 5(b)]. When a single layer of graphene is inserted between the NiFe and the Si, tunneling behavior dominates, but the RA product increases to only 6 kΩ μm2. In contrast, a NiFe/2 nm SiO2 tunnel contact on the same substrate has a much larger RA product of 15 MΩ μm2, with a corresponding decrease in the tunnel current of over 103 at a given bias voltage. A similar trend is observed for contacts to the Si (1 × 1019 cm−3) substrate, although the NiFe/Si contact is Schottky-like rather than ohmic. Thus the uniform, atomically thin character of graphene provides a superior tunnel barrier with a low RA product.
Using a ferromagnet like NiFe as the top electrode ensures that the tunnel current is spin polarized Reference Meservey and Tedrow65 and the tunnel barrier allows for a spin accumulation to occur underneath the tunnel barrier contact.
Spin accumulation and precession directly under the magnetic tunnel barrier contact interface can be observed using a single contact for both spin injection and detection, as shown in Fig. 5(a). A current is applied to contacts 1 and 2, and a voltage is measured across contacts 2 and 3. The injection of spin-polarized carriers from FM contact 2 produces a net spin accumulation in the Si described by the splitting of the spin-dependent electrochemical potential, Δμ = μup − μdown, which is detected as a voltage ΔV 3T = γΔμ/2e, where γ is the tunneling spin polarization of the magnetic tunnel contact.
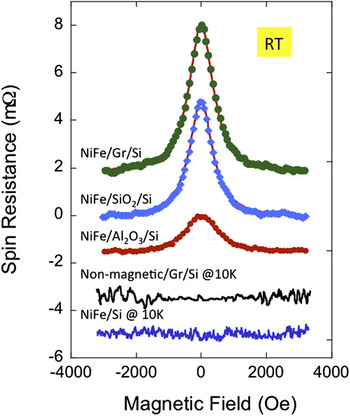
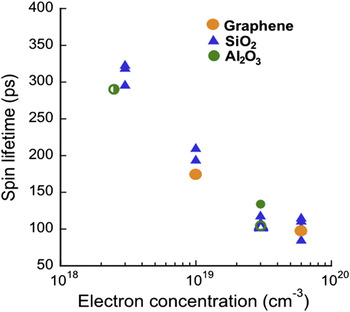
Spin lifetime and spin diffusion lengths are important figures of merit for spin devices. For a practical device the spin diffusion length (L SD = (Dτs)1/2) in the semiconductor channel has to be longer than the device dimensions, where L SD is the spin diffusion length, D is the diffusion constant and τs is the spin lifetime. Hanle spin precession measurements (precession caused by dephasing of electron spins in an applied magnetic field) are used to determine spin lifetimes and spin diffusion lengths. The top three curves in Fig. 6 are the Hanle measurements of the Al2O3, SiO2, and graphene tunnel barrier samples at room temperature. For all three barriers, a negative magnetoresistance was observed with a Lorentzian line-shape caused by field-induced precession, confirming successful spin accumulation in silicon. The bottom two measurements of Fig. 6 are for the NiFe/Si (1 × 10¹⁹) reference sample and a nonmagnetic/graphene/Si (1 × 10¹⁹) control sample, measured at 10 K. No magnetic field dependence is observed and none is expected. Although NiFe/Si (1 × 10¹⁹) forms a Schottky contact and spin-polarized electrons could, in principle, tunnel across this barrier, silicide formation and diffusion of metallic ions from the NiFe are likely, suppressing spin injection for this contact. The top three Hanle curves can be fit with a Lorentzian line-shape given by ΔV 3T(B z) = ΔV 3T(0)/[1 + (ωLτs)2], where ωL is the Lamor frequency and τs is the spin lifetime. Fits to this line-shape (shown in Fig. 6) give a lower bound of τs ∼ 150 ps for each of the tunnel barrier materials used (graphene, SiO2, and Al2O3), demonstrating that the lifetime measured is not dominated by some characteristic of the tunnel barrier. This is also explicitly demonstrated in Fig. 7, where we plot the spin lifetime obtained from three-terminal Hanle data on n-Si as a function of electron density for three different tunnel barrier materials (graphene, Al2O3, and SiO2) and three different magnetic metal contacts (Fe, CoFe, and NiFe). The spin lifetime measured with the three-terminal Hanle geometry shows a clear dependence only on electron density, and the dependence is consistent with literature electron spin resonance data on bulk Si. The spin lifetime is completely independent of the tunnel barrier material or magnetic metal used for the contact. The values for the graphene tunnel barriers fall directly on the curve. These data confirm that the spin accumulation occurs in the Si, and not in the graphene or possible interface trap states (Fig. 8).
Hanle spin precession measurements, graphs are offset for clarity. Room temperature Hanle data for spin injection NiFe/Al2O3/Si (3 × 10¹⁹), NiFe/SiO2/Si (3 × 10¹⁹) and NiFe/graphene/Si (1 × 10¹⁹). Also shown are the control samples; nonmagnetic/graphene/Si (1 × 10¹⁹) and NiFe/Si (1 × 10¹⁹) measured at 10 K.

Spin lifetimes obtained from three-terminal Hanle measurements at 10 K as a function of the Si electron density for the tunnel barrier materials indicated and different FM metal contacts (Fe, CoFe, and NiFe). The symbol shape distinguishes the tunnel barrier material: triangles—SiO2, circles—Al2O3 and stars—graphene. Solid symbols correspond to devices with Ni0.8Fe0.2 contacts, half-solid symbols to Fe contacts, and open symbols to Co0.9Fe0.1 contacts. The spin lifetimes show a pronounced dependence on the Si doping level, and little dependence on the choice of tunnel barrier or magnetic metal.

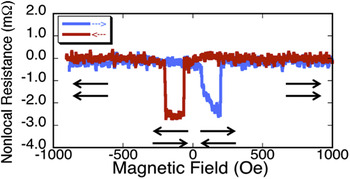
Nonlocal resistance versus in-plane magnetic field measured using lock in techniques. Clear parallel and antiparallel magnetic states are observed.

The 3T devices with graphene tunnel barriers provide insight into the properties of a spin-polarized electron current and spin accumulation that occur directly underneath the injecting contact. To study the physics of a pure spin current which is away from the injecting contact, one can use a four-terminal (4T) nonlocal spin-valve (NLSV) contact geometry, as illustrated in Fig. 4(b). In the nonlocal detection geometry, spin-polarized electrons are injected into the Si from contact 2, producing both a spin-polarized electron drift/diffusion current which flows with an applied bias from contact 2 to 1, and a diffusive spin current which flows to the right from contact 2. This pure spin current produces a net spin polarization and an imbalance in the spin-dependent electrochemical potential, which is detected as a voltage by the magnetic contact 3 relative to the reference contact 4. No charge current flows in the detection circuit defined by reference contact 3 and magnetic detector contact 4, and thus excluding spurious contributions from anisotropic and local Hall effects. The voltage measured at contact 3 is sensitive to the relative orientation of the contact magnetization and the net spin orientation in the Si itself.
We use electron-beam lithography to define the magnetic contacts that are 200 nm wide and 1 µm wide contact separated by 200 nm. E-beam evaporation was used to deposit 150 Å Ni80Fe20/50 Å Ti/300 Å Au. These contacts were then used as a hard mask to etch away the exposed graphene by a light oxygen plasma, confirmed by a resistance check.
At large negative magnetic fields applied along the long axis of the contacts, the magnetizations of the 200 nm and 1 µm wide contacts are parallel, and the nonlocal resistance is at the maximum. As the field is increased, the 1 µm contact switches, resulting in an antiparallel orientation and the minimum nonlocal resistance. As the field increases further, the 200 nm contact also switches, so that the contact magnetizations are again parallel, and the nonlocal resistance returns to its maximum value. The sequence is reversed as the magnetic field is swept from positive to negative. The maximum resistance change is ∼2.5 mΩ, close to the value that has been observed previously with MgO barriers. Reference Sasaki, Oikawa, Suzuki, Shiraishi, Suzuki and Noguchi66–Reference Shiraishi, Honda, Shikoh, Suzuki, Shinjo, Sasaki, Oikawa, Noguchi and Suzuki68 We observed clear switching for the inplane NLSV devices, see Fig. 8. From the nonlocal Hanle data, we obtained spin lifetimes of 140 ps in the NLSV devices at 10 K, consistent with the 3T measurements described above.
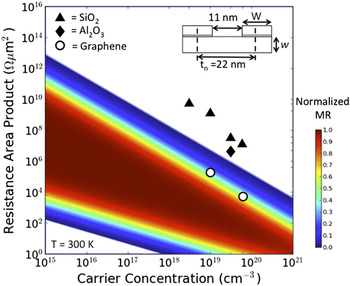
In addition to good spin properties, a spin contact must also exhibit a low conventional RA product. The magnetic contact's conventional RA product is an important parameter in determining the practical application of spin-based semiconductor devices. Calculations have shown that significant local MR can be achieved only if the contact RA product falls within a range, which depends upon the Si channel conductivity, the spin lifetime and the contact spacing. Reference Min, Motohashi, Lodder and Jansen69 The RA products of all magnetic tunnel barrier contacts, to date, have been much larger than required, making such devices unattainable. However, the low RA products provided by the graphene tunnel barriers fall within this window, and enable realization of these and other important spintronic devices. We calculated the range of optimum RA products and the corresponding local MR as a function of the Si electron density using the contact geometry shown as the inset in Fig. 9. The geometric parameters are chosen to be consistent with the node anticipated for Si device technology within the next few years. The color code in Fig. 9 identifies the range of useful MR and the corresponding window of contact RA products required. Reducing the RA product also has a positive effect on the electrical properties of the spin device, as lowering the resistance reduces noise and increases the speed of an electrical circuit.
Calculation of the local (two terminal) magnetoresistance as a function of the contact's conventional RA product and the Si electron density for the device geometry shown in the inset. The data points are the RA products measured for our FM metal/tunnel barrier/Si contacts using 2 nm SiO2 (triangles), 1.5 nm AlO x (squares) and monolayer graphene (circles) tunnel barriers prepared from identical Si wafers in our lab. The FM metal/graphene RA products fall within the window of useful MR values. W = w = 11 nm.

Another application where RA product is crucially important is nanowire devices, because of the exceedingly small contact area, which can be of order 100 nm2. Reference Mohney, Wang, Cabassi, Lew, Dey, Redwing and Mayer70,Reference Leonard and Talin71
Nanowires are 1D structures and are a natural way to keep reducing the dimensions of electronic devices. Adding spins to nanowire circuits will offer enhanced functionality, such as built-in nonvolatile memory and reprogrammable logic.
Electrical spin injection that enables this enhanced functionality depends critically on the interface resistance between the spin injecting FM metal contact and the semiconductor.
Standard oxide tunnel barriers grown on nanowires in our lab were found to be too resistive to yield reliable and consistent results. We have fabricated nanoscale spintronic devices comprising of a Si nanowire spin transport channel with a low resistance tunnel barrier of single layer graphene for electrical spin injection and detection of pure spin currents. We used both four-terminal NLSV (Refs. Reference Johnson and Silsbee72 and Reference Jedema, Nijboer, Filip and van Wees73) and three-terminal (3T) Reference Lou, Adelmann, Furis, Crooker, Palmstrøm and Crowell74 geometries to probe the spin accumulation and transport properties.
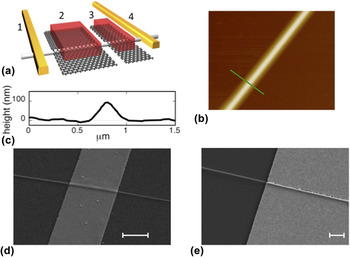
Si nanowires were grown using gold seeded vapor–liquid–solid techniques with a 〈111〉 growth axis. Reference Cui, Lauhon, Gudiksen, Wang and Lieber75 The wires were phosphorous doped to an electron concentration n ∼ 3 × 1019 cm−3. They were removed from the growth substrate by sonication and dispersed on a Si3N4/Si substrate. Appropriate nanowires ∼100–150 nm in diameter were chosen optically, and two outer ohmic contacts were made using electron-beam lithography. A buffered hydrofluoric acid based solution was used to remove any thin oxide layer and hydrogen passivates the nanowires. Graphene grown by low-pressure CVD within Cu foil enclosures Reference Li, Magnuson, Venugopal, Tromp, Hannon, Vogel, Colombo and Ruoff36 was transferred onto the hydrogen passivated nanowires using mechanical transfer techniques. The magnetic contacts, Au 300 Å/NiFe 100 Å, were defined by electron-beam lithography using a PMMA resist and deposited by electron-beam evaporation to form the devices illustrated in Fig. 10. These contacts are then used as a hard mask to remove the excess graphene by a light O2 plasma etch. Complete removal of excess graphene was confirmed when the resistance between these electrodes increased by three orders of magnitude.
(a) Schematic of 4T nanowire device; contacts 1 and 4 are ohmic contacts applied directly to the nanowire, and contacts 2 (1 μm wide) and 3 (200 nm wide) are NiFe/graphene tunnel barriers for electrical spin injection and detection. The edge-to-edge separation of contacts 2 and 3 is 200 nm. (b) AFM image of graphene covered nanowire, green line is line scan shown in (c), (c) line scan of graphene covered nanowire. (d) scanning electron microscope (SEM) image of a NiFe/graphene contact on nanowire (NW). The graphene smoothly bridges the nanowire so that the NiFe film is smooth and continuous, scale bar is 1 μm, and (e) SEM image of an Au contact on a NW showing discontinuous portions of the metallization at the nanowire, scale bar is 1 μm.

Figure 10(b) shows an atomic force microscopy (AFM) image and line scan across the wire directly after the graphene transfer onto a 100 nm diameter Si nanowire. As reported in Ref. Reference Jin, Lee, Hwang, Kim, Kim, Son, Whang and Hwang76, the graphene smoothly bridges the nanowire and forms freely suspended graphene for approximately the width of the nanowire on each side, like a blanket on a clothesline. This free hanging graphene is robust to electron-beam evaporation of NiFe, and produces a smooth and continuous NiFe film across the nanowire as is evident from the SEM image in Fig. 10(c). The smooth bridging provided by graphene results in clean switching of the contact magnetization, because it minimizes the formation of complicated magnetic domains which have been found to compromise the magnetic behavior. In contrast, the SEM image of the Au reference contact, Fig. 10(d), shows that this metal layer without graphene underneath attempts to be highly conformal to the NW, resulting in discontinuous portions of the metallization.
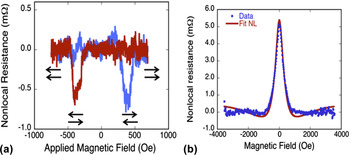
These contacts were initially characterized using I–V measurements demonstrating that this contact is a high quality, pinhole-free tunnel barrier. An in-plane magnetic field is used to switch the magnetizations of the two electrodes independently, producing parallel and antiparallel alignments. A net change in the nonlocal resistance of ∼0.7 mΩ was measured at 10 K, see Fig. 11.
Nonlocal spin-valve and Hanle measurements. (a) NLSV data on 150 nm wide nanowire, contacts are 200 nm and 1 μm wide with a 200 nm edge-to-edge spacing. The arrows indicate the relative orientation of the magnetizations of the injector and detector contacts, and the blue and red traces indicate increasing and decreasing magnetic field sweeps. (b) NLSV Hanle data after background subtraction. All data are for a bias current of −200 μA at T = 10 K, peak is 5 mΩ.

The magnetizations of the two contacts reverse cleanly at well-defined coercive fields consistent with shape anisotropy, so that both parallel and antiparallel alignments of the injector/detector magnetizations are realized. We attributed this to the smooth bridging of the NW by the graphene layer as discussed above producing a more gradual variation in the contact topography to which the NiFe film conforms. In contrast, magnetic metal/oxide tunnel contacts applied directly to the NW exhibit poorly defined switching characteristics attributed to local domain patterns arising from the more complex morphology created as the contact attempts to conform to the NW sidewalls. Reference Zhang, Dayeh, Li, Crooker, Smith and Picraux77
The amplitude of the nonlocal Hanle signal measured at contact 2 is 1 μV or 5 mΩ, and can be modeled using the integral spin diffusion approach described in the literature. Reference Jedema, Nijboer, Filip and van Wees73,Reference Lou, Adelmann, Crooker, Garlid, Zhang, Reddy, Flexner, Palmstrøm and Crowell78 The model fits the experimental data well, as shown by the red curve in Fig. 10(d), and yields values for the diffusion constant D = 0.00047 m2/s and the NLSV spin lifetime of 190 ± 10 ps, consistent with the values observed for the bulk silicon samples described above.
IV. GRAPHENE AS A HOMOEPITAXIAL TUNNEL BARRIER
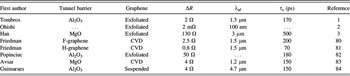
In the previous section we used a ferromagnet/graphene contact to inject spin into silicon with the ultimate goal to make silicon spintronic devices. Graphene is also expected to be an excellent host for spin transport due to its low spin orbit interaction and large mobilities. Future graphene spintronic devices should enable new functionalities. However, approximately 8 years after the first demonstration of spin transport in a graphene channel, Reference Tombros, Jozsa, Popinciuc, Jonkman and van Wees1 the spin lifetimes have mostly remained steady at approximately ∼200 ps, Reference Han, Kawakami, Gmitra and Fabian79 although some studies have reported higher values, see Table II. Reference Sosenko, Wei and Aji85
Lateral spin transport in graphene measured with NLSVs.

This is in spite of predictions of much higher values owing to low spin–orbit coupling, Reference Pesin and MacDonald86 and experimental research that confirms that these unique graphene properties allow the observation of other predicted magnetoresistance effects. Reference Friedman, Robinson, Keith Perkins and Campbell87,Reference Friedman, Tedesco, Campbell, Culbertson, Aifer, Keith Perkins, Myers-Ward, Hite, Jernigan, Eddy and Kurt Gaskill88 Much research has focused on growing higher quality graphene, for which large areas of high-mobility, defect and grain boundary-free (over several cm) can now be grown. Reference Li, Magnuson, Venugopal, Tromp, Hannon, Vogel, Colombo and Ruoff36,Reference Nyakitit, Myers-Ward, Wheeler, Imhoff, Bezares, Caldwell, Friedman, Matis, Baldwin, Campbell, Culbertson, Eddy, Jernigan, Chun and Kurt Gaskill89 Additionally, much research has focused on improving device performance by using substrates that are free of trapped charge and introduced low phonon scattering, such as BN or high-k dielectrics. Reference Cress, Champlain, Esqueda, Robinson, Friedman and McMorrow90,Reference Kretinin, Cao, Tu, Yu, Jalil, Novoselov, Haigh, Gholinia, Mishchenko, Lozada, Georgiou, Woods, Withers, Blake, Eda, Wirsig, Hucho, Watanabe, Tanigushi, Geim and Gorbachev91 Only recently attention has turned to creating higher quality tunnel barriers to overcome the conductivity mismatch problem in spin valve devices for graphene. Most studies use oxides as the tunnel barrier, which contain defects and pinholes, nonuniformities, and offer severe difficulties in wetting the surface of the graphene consistently. Reference Han, Pi, McCreary, Li, Wong, Swartz and Kawakami3,Reference Dlubak, Seneor, Anane, Barraud, Deranlot, Deneuve, Servet, Mattana, Petroff and Fert33 Several promising new candidates to replace oxides as the tunnel barrier of choice have been suggested including other 2D materials such as BN (Ref. Reference Neumann, Costache, Bridoux, Sierra and Valenzuela92) or amorphous carbon films. Reference Yamaguchi, Inoue, Masubuchi, Morikawa, Onuki, Watanabe, Taniguchi, Moriya and Machida93 Perhaps the most promising candidate is a homoepitaxial tunnel barrier made from graphene itself, lightly functionalized with either fluorine or hydrogen. Reference Friedman, van 't Erve, Li, Robinson and Jonker80,Reference Friedman, van't Erve, Robinson, Whitener and Jonker81
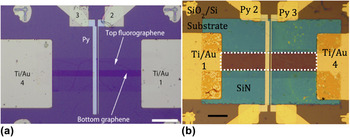
Although graphene was shown to have many advantageous properties as a tunnel barrier, it cannot in its natural state produce tunneling when coupled with another graphene layer. Reference Chae, Zhang, Huang and von Klitzing94 This is due to persistent electronic interaction between the graphene layers, no matter the stacking orientation, or twist angle. Reference Jernigan, Anderson, Robinson, Caldwell, Culbertson, Myers-Ward, Davidson, Ancona, Wheeler, Nyakiti, Friedman, Campbell and Kurt Gaskill95 However, it was shown that functionalization of the graphene can decouple two graphene layers in a bilayer, allowing the layers to function separately from each other. Reference Robinson, Schmucker, Diaconescu, Long, Culbertson, Ohta, Friedman and Beechem96 Fluorination, accomplished by exposure of graphene to XeF2, gas will only functionalize the exposed surface, leaving the lower graphene layer untouched and maintaining its electronic properties. Reference Robinson, Burgess, Junkermeier, Badescu, Reinecke, Perkins, Zalalutdinov, Baldwin, Culbertson, Sheehan and Snow97 However, the fluorination is not very stable and any fluorinated areas must be capped to prevent decomposition back to graphene. Reference Stine, Lee, Whitener, Robinson and Sheehan98 Hydrogenation of graphene, accomplished using a wet chemical Birch reduction process is much more stable, having no decomposition after months of air exposure. Although hydrogenation can also be accomplished using low energy hydrogen plasmas, Reference Matis, Bulat, Friedman, Houston and Baldwin99,Reference Matis, Burgass, Bulat, Friedman, Houston and Baldwin100 the Birch reduction process does not introduce defects. However, the process is highly aggressive and several graphene layers must be present to ensure a conductive channel after treatment, as the hydrogen will intercalate through edges and grain boundaries, functionalizing multiple layers of graphene at a time. Both functionalization methods turn the graphene into in-plane insulators as well as out-of-plane insulators, ensuring that no conductive edge states or parallel conduction paths will contribute to the overall transport behavior of the device. Optical images of both a bilayer fluorographene/graphene 4-terminal NLSV and a quad layer hydrogenated graphene/graphene 4-terminal NLSV are found in Fig. 12. More precise device fabrication procedures are found in the literature. Both devices have a conductive graphene spin channel and a functionalized graphene tunnel barrier on top. Two center FM (Py) contacts resting only the tunnel barrier and two end Ti/Au reference contacts complete the devices.
(a) Fluorographene/graphene NLSV device (b) hydrogenated graphene/graphene NLSV device. For both devices, the spin channel is graphene, the outside reference contacts are Ti/Au, the inside spin injection/detection contacts are permalloy, and the tunnel barrier is functionalized graphene.

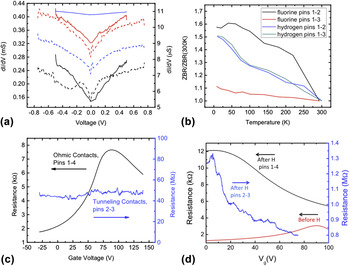
Figure 13(a) shows representative IV and differential conductance plots for the tunneling contacts, demonstrating non-Ohmic behavior indicative of tunneling. Figure 13(b) displays representative ZBR versus temperature plots of the same contacts. The observed weak decreasing ZBR with increasing temperature is a criterion for a high quality pinhole-free tunnel barrier contact. Reference Jonsson-Akerman, Escudero, Leighton, Kim, Schuller and Rabson37 Further demonstrating electrical decoupling between the conductive graphene channel and the functionalized graphene tunnel barrier is observed by noting that resistance versus gate voltage sweeps [Figs. 13(c) and 13(d)] using the contacts that are only on the tunnel barrier show orders of magnitude higher resistance than resistance versus gate voltage sweeps using the contacts that are on the conductive channel for both types of devices. Fluorinated graphene tunnel barrier devices show a complete quenching of the Dirac point for the tunnel barrier-only contacted gate voltage sweeps, indicating complete electrical isolation of the two adjacent graphene layers. Hydrogenated graphene tunnel barrier devices do not show such a complete Dirac point quenching. However, the highly resistive hydrogenated graphene layers show a strong n-type shift of the Dirac point as compared to the conductive layer beneath it, as is expected for heavily hydrogenated graphene, Reference Matis, Bulat, Friedman, Houston and Baldwin101 and indicating that the adjacent tunnel barrier layers and conductive channel can be gate-modulated independent of one another.
(a) Differential conductance graphs. Dashed lines are for hydrogen and go with the right y-axis. Solid lines are for fluorine and go with the left y-axis. Black = contacts 1–2. Red = contacts 1–3. Blue = contacts 1–4. (b) ZBR of hydrogenated and fluorinated tunnel barrier devices showing a weak temperature dependence indicative of tunneling. (c) Gate voltage sweeps showing the Dirac point for fluorinated devices only on the outside reference contacts, indicating decoupling of the tunnel barrier from the channel layer. (d) Gate voltage sweeps for hydrogenated devices showing much higher resistance for the top tunneling layers as compared to the bottom layers and the sweep taken before hydrogenation indicating decoupling.

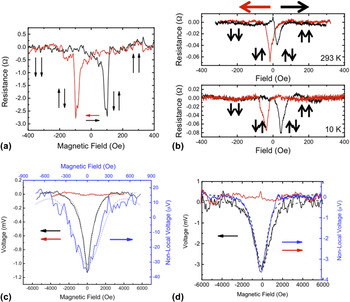
4-terminal NLSV measurements are performed to demonstrate spin transport in the devices. Figure 14(a) demonstrates NLSV behavior and the expected peaks due to switching of the relative magnetizations of the contacts for the fluorinated graphene device at 10 K and −10 μA bias. Despite a very strong spin signal, the effect did not last up to room temperature, remaining until about ∼250 K. Figure 14(b) displays NLSV measurements for the hydrogenated device at both 10 K and room temperature at a −10 μA bias, with spin transport clearly observed through the entire temperature range. Spin lifetimes and spin diffusion lengths are calculated by fitting to the Hanle effect curves, where an out-of-plane field causes processional dephasing of spins in the channel, resulting in a pseudo-Lorentzian line-shape. For the 2-terminal case: ΔV 2T(B z) = ΔV 2T(0)/[1 + (ωLτs)2]. Here, ωL = gμB B z/ħ, the Larmor frequency, and τs is the spin lifetime. The Lande g-factor is ∼2 for graphene, μB is the Bohr magneton, and ħ is Planck's constant. For the 4-terminal case the voltage is proportional to:
 $$S\left( {{x_1},{x_2},{B_{\rm{z}}}} \right) = {S_0}\int_0^\infty {{1 \over {\sqrt {4\pi Dt} }}} {{\rm{e}}^{{{^{ - {{\left( {{x_2} - {x_1} - {v_d}^t} \right)}^2}}} \mathord{\left/ {\vphantom {{^{ - {{\left( {{x_2} - {x_1} - {v_d}^t} \right)}^2}}} {4Dt}}} \right. \kern-\nulldelimiterspace} {4Dt}}}}<$$><$$>×\cos \left( {{\omega _{\rm{L}}}t} \right){{\rm{e}}^{{{ - t} \mathord{\left/ {\vphantom {{ - t} {{\tau _{\rm{s}}}}}} \right. \kern-\nulldelimiterspace} {{\tau _{\rm{s}}}}}}}{\rm{d}}t\quad ,$$
here, spin is injected into the graphene at x 1 and t = 0 and detected at x 2. S 0 is the spin injection rate, D is the electron diffusion constant, and v d is the electron drift velocity (=0 for diffusive transport). These curves and their fits are shown in Figs. 14(c) and 14(d) for fluorinated and hydrogenated tunnel barrier devices, respectively. Fitted spin lifetimes of the fluorinated graphene tunnel barrier are ∼100 and ∼200 ps for the 2-terminal and 4-terminal nonlocal measurements, respectively, with an average spin diffusion length calculated with L SD = (Dτs)1/2 of ∼1.5 μm. Fitted spin lifetimes of the hydrogenated graphene tunnel barrier are ∼65 and ∼70 ps for the 2-terminal and 4-terminal nonlocal measurements, respectively, with an average spin diffusion length of ∼2 μm. These values are consistent with other measured graphene spin valve devices.
(a) In-plane magnetic field sweep of the fluorinated device operated as a NLSV at 10 K with −10 μA bias current, showing characteristic resistance peaks. (b) In-plane magnetic field sweep of the hydrogenated device operated as a NLSV at both room temperature and 10 K with −10 μA bias current, showing characteristic resistance peaks. (c) Out-of-plane magnetic field sweep showing the Hanle effect for fluorinated devices. The blue (black) curve is for 4-terminal nonlocal (2-terminal local) measurements. The red curve is for witness devices where the tunnel barrier was left unfunctionalized. (d) Out-of-plane magnetic field sweep showing the Hanle effect for hydrogenated devices. The blue (black) curve is for 4-terminal nonlocal (2-terminal local) measurements. The red curve is for witness devices where the tunnel barrier was left unfunctionalized.

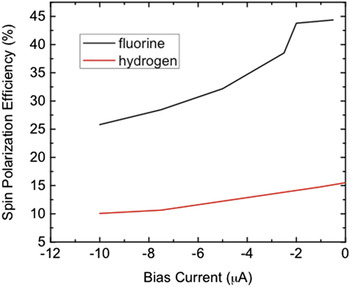
The spin-polarization efficiency, a value strongly dependent on the quality of the tunnel barrier, is calculated from the conductivity of the device and the magnitude of the NLSV signal: ΔR NL = (P 2 L SD/Wσ) exp[−L/L SD]. Here, P is the spin polarization efficiency, L SD is the spin diffusion length, W is the width of the graphene channel, σ is the measured conductivity, and L is the center-to-center contact spacing. For fluorographene devices, we measured values as high as 45% at low bias and for hydrogenated devices, we measured values as high as 16.5% at low bias, shown in Fig. 15. Fluorographene shows the highest ever measured spin polarization for any graphene device and could possibly indicate spin filtered tunneling, as the intrinsic polarization of Py is 40–44%. Reference Miao, Munzengerg and Moodera102 Hydrogenated graphene devices do not show as high a spin polarization value, even though the value is still higher than most oxide tunnel barrier devices. This could possibly be due to scattering introduced by theoretically predicted Reference Wang and Li103,Reference Dev and Reinecke104 and experimentally verified Reference Lee, Whitener, Robinson and Sheehan105,Reference Friedman, Chun, Jung, Glaser, Heiman and Menon106 magnetic moments in hydrogenated graphene. In addition to the high spin polarization efficiency values, fluorinated graphene tunnel barrier devices exhibit the type of gate-modulated spin lifetime theoretically predicted for graphene, but found only in the highest quality pinhole-free tunnel barriers. Reference Volmer, Drogeler, Maynicke, von den Driesch, Boschen, Guntherodt and Beschoten107 Unfortunately, hydrogenated graphene tunnel barrier devices do not exhibit this same modulation, perhaps indicating that with hydrogenation, the electrical decoupling is not as complete as with fluorination.
Calculated polarization efficiency values for both fluorinated and hydrogenated tunnel barrier devices.

A. In summary
This work is the first demonstration of the use of a single layer of graphene as a tunnel barrier. By incorporating a single layer of CVD-grown graphene into an MTJ structure, we have shown that charge and spin transport across the graphene occurs by tunneling and preserves the spin polarization of the tunneling carriers. Using FM-graphene tunnel contacts to inject spin into a silicon channel, we have shown that such contacts achieve dramatically lower resistance than equivalent oxide-based tunnel contacts. We have also shown that functionalized graphene can be used as an effective tunnel barrier on graphene, creating a homoepitaxial spintronic graphene device. These discoveries pave the way for a new generation of spintronic devices using graphene in an unconventional way, but providing unparalleled potential for better state-of-the-art performance. Utilizing intrinsic 2D layers, such as graphene or hexagonal boron nitride, as tunnel contacts on nanowires offers many advantages over conventional materials deposited by vapor deposition (e.g., Al2O3 or MgO), enabling a path to highly scaled electronic and spintronic silicon or graphene devices.
V. CVD GROWTH OF TRANSITION METAL DICHALCOGENIDES (TMDs)
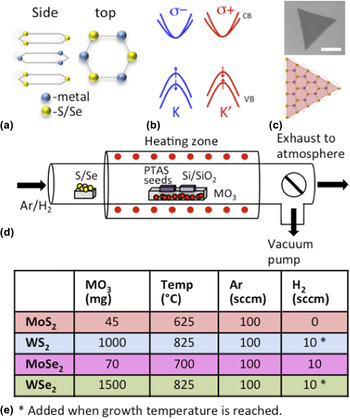
The abundant popularity of graphene, described in the previous section, has stimulated research in the direction of other two-dimensional materials. In particular, investigations of monolayer TMDs have grown in recent years, with the majority of attention focused on the Mo- and W-based constituents; MoS2, MoSe2, WS2, and WSe2. Reference Jariwala, Sangwan, Lauhon, Marks and Hersam108–Reference Najmaei, Liu, Zhou, Zou, Shi, Lei, Yakobson, Idrobo, Ajayan and Lou112 These materials exhibit many common characteristics, and will be the focus of this section. A monolayer building block of MX2 (where M = Mo, W and X = S, Se) is actually composed of three atomic layers: a top and bottom chalcogen layer encapsulate the center metal sheet, resulting in a hexagonal structure, similar to graphene, when viewed from above [Fig. 16(a)]. In contrast to the linear, gapless energy dispersion of graphene, Reference Novoselov, Geim, Morozov, Jiang, Katsnelson, Grigorieva, Dubonos and Firsov113 single layer MX2 is a direct-gap semiconductor, with inequivalent K and K′ valleys at the Brillouin zone edge and a spin-split valence band [Fig. 16(b)]. Fundamental investigations and prototype devices incorporating monolayer TMDs have demonstrated reasonable electronic mobility, Reference Iqbal, Iqbal, Khan, Shehzad, Seo, Park, Hwang and Eom114,Reference Kaasbjerg, Thygesen and Jacobsen115 high optical responsivity, Reference Mak, Lee, Hone, Shan and Heinz116 environmental sensitivity, Reference Perkins, Friedman, Cobas, Campbell, Jernigan and Jonker117 high valley polarization, Reference Mak, He, Shan and Heinz118,Reference Kioseoglou, Hanbicki, Currie, Friedman, Gunlycke and Jonker119 and long spin lifetimes Reference Yang, Sinitsyn, Chen, Yuan, Zhang, Lou and Crooker120 making this class of materials promising for optoelectronic components, chemical sensing, and valleytronic applications.
(a) The MX2 lattice as viewed from the side and top. (b) The monolayer MX2 band structure showing inequivalent K and K′ valleys and spin-split valence band. (c) An optical image of an MoS2 monolayer. The scale bar is 10 μm. The equilateral triangular shape suggests single crystal growth, as shown by the depiction of an equilateral triangle overlaying the MX2 lattice. (d) A schematic of the quartz tube used for MX2 synthesis. (e) Parameters used for the CVD synthesis of MoS2, WS2, MoSe2, and WSe2 are listed in the table.

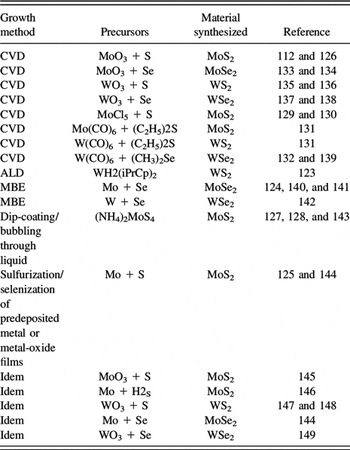
Analogous to graphene, monolayer TMD materials exhibit strong intralayer bonding but weak interlayer bonding, and can subsequently be peeled apart to achieve a single monolayer (1L). Reference Novoselov, Jiang, Schedin, Booth, Khotkevich, Morozov and Geim110 Utilization of mechanically exfoliated samples has rapidly led to an abundance of insight regarding fundamental scientific properties of these monolayers. Reference Splendiani, Sun, Zhang, Li, Kim, Chim, Galli and Wang121,Reference Radisavljevic, Radenovic, Brivio, Giacometti and Kis122 Although, future implementation into technological applications will require a reliable means to reproducibly obtain uniform, high quality, and large-area samples. Many avenues have been studied to address this issue, including synthesis via atomic layer deposition (ALD), Reference Song, Park, Lee, Choi, Jung, Lee, Hwang, Myoung, Jung, Kim, Lansalot-Matras and Kim123 molecular beam epitaxy (MBE), Reference Zhang, Chang, Zhou, Cui, Yan, Liu, Schmitt, Lee, Moore, Chen, Lin, Jeng, Mo, Hussain, Bansil and Shen124 and CVD, Reference Zhan, Liu, Najmaei, Ajayan and Lou125 and innovative options continue to be explored. In addition to the various techniques, a diverse set of precursors have been tested, such as solid metal-oxide and chalcogen powders, Reference Najmaei, Liu, Zhou, Zou, Shi, Lei, Yakobson, Idrobo, Ajayan and Lou112,Reference van der Zande, Huang, Chenet, Berkelbach, You, Lee, Heinz, Reichman, Muller and Hone126 ammonium tetrathiomolybdate, Reference Shi, Zhou, Lu, Fang, Lee, Hsu, Kim, Kim, Yang, Li, Idrobo and Kong127,Reference Liu, Zhang, Lee, Lin, Chang, Su, Chang, Li, Shi, Zhang, Lai and Li128 MoCl5, Reference Yu, Li, Liu, Su, Zhang and Cao129,Reference McCreary, Hanbicki, Robinson, Cobas, Culbertson, Friedman, Jernigan and Jonker130 and metal hexacarbonyls, Reference Kang, Xie, Huang, Han, Huang, Mak, Kim, Muller and Park131,Reference Eichfeld, Hossain, Lin, Piasecki, Kupp, Birdwell, Burke, Lu, Peng, Li, Azcatl, McDonnell, Wallace, Kim, Mayer, Redwing and Robinson132 to name a few. An overview of synthesis methods and precursors are listed in Table III. Additional information can be found in recent review articles focusing on synthesis techniques. Reference Das, Robinson, Dubey, Terrones and Terrones109,Reference Shi, Li and Li150–Reference Lv, Terrones, Elías, Perea-López, Gutiérrez, Cruz-Silva, Rajukumar, Dresselhaus and Terrones152
Techniques and precursors to synthesize TMD materials.

A typical CVD system can be assembled relatively inexpensively, contributing to the attraction, and consists of a quartz tube, heating elements, crucibles for precursors, gas flow control, and a vacuum pump. In such a system, we have synthesized monolayers MoS2, MoSe2, WS2, and WSe2 on Si/SiO2 with the aid of Perylene-3,4,9,10-tetracarboxylic acid tetrapotassium acid salt seed molecules. Reference Ling, Lee, Lin, Fang, Yu, Dresselhaus and Kong153 The growth substrates are placed directly above the oxide precursor MO3, (where M = Mo, W) at the center heating zone while a separate, upstream, crucible containing the sulfur/selenium powder is positioned in a lower temperature region, as shown schematically in Fig. 16(d). Equilateral triangular growth is commonly observed [Fig. 16(c)], and has been suggested to represent a single grain. Reference van der Zande, Huang, Chenet, Berkelbach, You, Lee, Heinz, Reichman, Muller and Hone126 Minor perturbations in parameters, such as precursor-to-substrate distance, growth temperature, growth time, and surface treatment, may strongly impact growth dynamics and crystalline quality. As a case-in-point, we observed that modifying the carrier gas from pure Ar to an Ar/H2 mixture results in larger synthesis areas of WS2, improved chemical composition, and significant improvements in the optical properties. Reference McCreary, Hanbicki, Gernigan, Culbertson and Jonker136 Synthesis of each TMD species requires optimization, and our parameters are outlined in Fig. 16(e). While specific details of the procedure can vary from lab to lab, several independent research groups have reported successful monolayer TMD synthesis using similar techniques. Reference Wang, Gong, Shi, Chow, Keyshar, Ye, Vajtai, Lou, Liu, Ringe, Tay and Ajayan134,Reference Gutiérrez, Perea-López, Elías, Berkdemir, Wang, Lv, López-Urías, Crespi, Terrones and Terrones148,Reference Lee, Zhang, Zhang, Chang, Lin, Chang, Yu, Wang, Chang, Li and Lin154
Photoluminescence (PL) spectroscopy and Raman spectroscopy have become seminal techniques for the identification and characterization of two-dimensional materials. Raman spectroscopy probes the phonon vibrational modes. As evident in Fig. 17(a), the dominant modes are the
 ${\rm{E}}_{2{\rm{g}}}^1$
and
 ${\rm{A}}_{\rm{g}}^1$
optical modes, which correspond to the in-plane and out-of-plane modes, respectively.
Reference Mak, He, Shan and Heinz118,Reference Tonndorf, Schmidt, Böttger, Zhang, Börner, Liebig, Albrecht, Kloc, Gordan, Zahn, Michaelis de Vasconcellos and Bratschitsch155
Individual monolayers exhibit distinctly different spectra, providing a unique fingerprint for each material. Subtle changes in spectra, such as minor variations in peak intensity or position can indicate the presence of electronic doping or strain effects,
Reference Chakraborty, Bera, Muthu, Bhowmick, Waghmare and Sood156–Reference Wang, Cong, Yang, Shang, Peimyoo, Chen, Kang, Wang, Huang and Yu159
demonstrating the power of Raman spectroscopy.
(a) Raman spectra of MX2 monolayers. The substrate peak (Si) and the dominant
 ${\rm{E}}_{2{\rm{g}}}^1$
and
 ${\rm{A}}_{\rm{g}}^1$
peaks are labeled. (b–e) PL spectra from monolayer TMDs displaying the dominant A-peak (color) and the higher energy B-peak (gray, magnified and offset. In MoS2 and MoSe2, the A and B-peaks overlap, hence the A contribution is subtracted from the magnified B-peak for clarity). (f and g) Tables listing relevant peak positions in Raman and PL spectra.

PL measurements reveal that for each monolayer, a sharp emission peak dominates, and is commonly referred to as the A-peak [Figs. 17(b)–17(e), colored lines]. This peak arises from direct-gap transitions between the higher energy of the spin-split valence band and the conduction band, located at the K-point of the Brillouin zone. The particular emission energy is dictated by the band gap, and is unique to each material. Additionally, a low intensity, higher energy B-peak is evident in all spectra [Figs. 17(b)–17(e), gray], and results from the recombination of an electron in the conduction band and a hole in the lower energy spin-split valence band. The emission energy of A- and B-excitons is listed in Fig. 17(f) and the difference provides values for the valence band spin splitting in each TMD. The splittings range from 150 meV in MoS2 to 430 meV in WSe2, similar to predicted values. Reference Zhu, Cheng and Schwingenschlögl160 We should note that the optical properties from CVD materials [Figs. 17(a)–17(e)] are comparable or superior to those of exfoliated samples, suggesting we have achieved a lower density of defects/impurities than the level that is naturally present in geologic samples. Reference Perkins, Friedman, Cobas, Campbell, Jernigan and Jonker117,Reference McDonnell, Addou, Buie, Wallace and Hinkle161,Reference Addou, McDonnell, Barrera, Guo, Azcatl, Wang, Zhu, Hinkle, Quevedo-Lopez, Alshareef, Colombo, Hsu and Wallace162
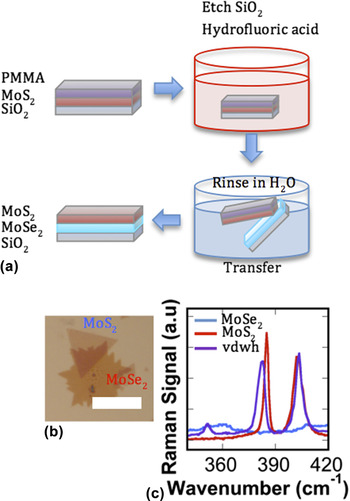
In addition to efforts focused on achieving and understanding monolayer materials, a field has emerged that aims to probe fundamental behaviors of structures composed of stacking distinct monolayers. Such structures are referred to as van der Waals heterostructures (vdwh), in reference to the weak interlayer van der Waals forces that bind the layers. We recently demonstrated the CVD synthesis of vdwh, composed of a monolayer of MoS2 grown directly on graphene, using MoCl5 and sulfur precursors. Reference McCreary, Hanbicki, Robinson, Cobas, Culbertson, Friedman, Jernigan and Jonker130 The MoS2 exhibits uniformity and continuity on the mm scale and retains its direct-gap nature. In addition to synthesis routes, heterostructures can be achieved through sequential manual stacking. Using a wet chemical etch and transfer procedure, outlined in Fig. 18(a), we have fabricated samples consisting of MoS2-on-MoSe2 layered regions as well as bare monolayers for reference [Fig. 18(b)]. Raman spectra of the vdwh region exhibits distinctly different features compared to the 1L constituents, as evident by the relative shifts in Raman peak positions and the presence of a new feature near 350 cm−1 [Fig. 18(c)], suggesting strong interaction between the two TMD layers. The ability to sequentially stack distinct materials regardless of lattice mismatch or free energy considerations represents a new paradigm for heterostructure fabrication and is rapidly attracting interest. Reference Lin, Ghosh, Addou, Lu, Eichfeld, Zhu, Li, Peng, Kim, Li, Wallace, Datta and Robinson139,Reference Li, Shi, Cheng, Lu, Lin, Tang, Tsai, Chu, Wei, He, Chang, Suenaga and Li163–Reference Geim and Grigorieva165 vdwh open the door to unique device functionality at the nanoscale.
(a) Fabrication steps used to fabricate vdwh; (i) coat CVD-grown MX2 with PMMA, (ii) submerge in hydrofluoric acid to etch SiO2 and release the TMD/PMMA stack, (iii) transfer to H2O to rinse the stack then pick up with a second TMD grown on SiO2. (b) Optical image of a characteristic vdwh area created by transferring MoS2 onto MoSe2. The scale bar is 10 μm. (c) Raman spectra from the vdwh region and bare monolayers.

VI. OPTICAL PROPERTIES OF MONOLAYER TMDS
A. Introduction
TMDs are of keen interest for emerging electronic applications. Reference Jariwala, Sangwan, Lauhon, Marks and Hersam108,Reference Wang, Kalantar-Zadeh, Kis, Coleman and Strano111,Reference Radisavljevic, Radenovic, Brivio, Giacometti and Kis122,Reference Yoon, Ganapathi and Salahuddin166,Reference Alam and Lake167 In contrast with their indirect gap character in the bulk, single monolayer TMDs of the family MX2 (M = Mo, W and X = S, Se, and Te) are direct-gap semiconductors with a range of band gaps in the visible regime Reference Mak, He, Shan and Heinz118,Reference Splendiani, Sun, Zhang, Li, Kim, Chim, Galli and Wang121,Reference Gutiérrez, Perea-López, Elías, Berkdemir, Wang, Lv, López-Urías, Crespi, Terrones and Terrones148 suitable for a host of optoelectronic, Reference Wang, Kalantar-Zadeh, Kis, Coleman and Strano111 light harvesting Reference Feng, Qian, Huang and Li168,Reference Bernardi, Palummo and Grossman169, chemical sensor, Reference Perkins, Friedman, Cobas, Campbell, Jernigan and Jonker117,Reference Liu, Chen, Liu, Abbas, Fathi and Zhou170 and spin-valley coupling based Reference Xiao, Liu, Feng, Xu and Yao171–Reference Mak, McGill, Park and McEuen173 applications.
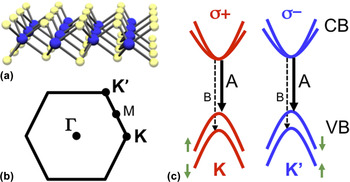
A single layer of MoX2, schematically shown in Fig. 19(a), consists of a plane of transition metal atoms sandwiched by layers of chalcogen atoms. The Brillouin zone of this system is shown in Fig. 19(b). In single layer form, the direct gap occurs at the K-point, and the optical properties of these materials are governed by strong excitonic transitions, both neutral and charged.
(a) Crystal structure of a single-layer transition-metal dichalcogenide. A central layer of transition metal atoms is sandwiched by layers of chalcogens. (b) Brillouin zone for a reduced dimensional hexagonal lattice. Some relevant high symmetry points are indicated. (c) Schematic of the single-particle band structure at K and K′ valleys. The arrows denote the A (solid line) and B (dashed line) excitons. Each valley can only be excited with a specific helicity, σ+ or σ−.

These excitons are strongly bound, with the neutral exciton having binding energies in the order of 0.5–0.8 eV (Refs. Reference Qiu, da Jornada and Louie174–Reference Chernikov, Berkelbach, Hill, Rigosi, Li, Aslan, Reichman, Hybertsen and Heinz178) and the charged exciton (trion) having a binding energy of 20–30 meV. Reference Mak, He, Lee, Lee, Hone, Heinz and Shan179,Reference Ross, Wu, Yu, Ghimire, Jones, Aivazian, Yan, Mandrus, Xiao, Yao and Xu180 In addition to being optically active with strong PL, they also have unique optical selection rules [Fig. 19(c)]. Time reversal symmetry and strong orbital-hybridization couples the valley and spin indices. This enables access to a single valley using polarized light, since the angular momentum of incident circularly polarized light interacts with carriers to produce specific spin states. Reference Mak, He, Shan and Heinz118,Reference Kioseoglou, Hanbicki, Currie, Friedman, Gunlycke and Jonker119,Reference Cao, Wang, Han, Ye, Zhu, Shi, Niu, Tan, Wang, Liu and Feng172,Reference Mak, He, Lee, Lee, Hone, Heinz and Shan179,Reference Sallen, Bouet, Marie, Wang, Zhu, Han, Lu, Tan, Amand, Liu and Urbaszek181,Reference Zeng, Dai, Yao, Xiao and Cui182 In other words, the symmetry properties of the two inequivalent valleys lead to a difference in the absorption of circularly polarized light, either positive (σ + ) or negative (σ − ) helicity, resulting in a strong chiral selectivity.
Despite recent progress, there are many gaps in our understanding of the fundamental interactions which lead to the striking optical and electronic properties these monolayer semiconductor materials exhibit, including very basic electron–hole interactions. Here we will review four topics that highlight the novelty, subtlety, and unexpected behavior present in these fascinating materials. This includes the extremely high binding energy of optically generated electron–hole pairs, intervalley scattering, and the profound effect of the environment on these mostly surface materials.
B. Experimental background
Before discussing the fascinating science inherent in these systems, it is instructive to review some basic properties of these materials. TMD samples can be prepared in several ways. One common method is to mechanically exfoliate flakes from bulk single crystals and deposit them onto substrates such as SiO2/Si. If the SiO2 thickness is chosen judicously monolayer regions can be readily identified in an optical microscope because of the optical contrast. Reference Blake, Hill, Castro Neto, Novoselov, Jiang, Yang, Booth and Geim183,Reference Benameur, Radisavljevic, Héron, Sahoo, Berger and Kis184
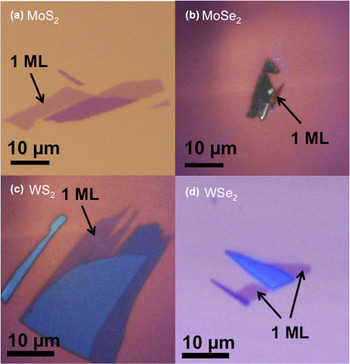
This method usually yields monolayer regions that are typically 5–10 µm across. An example of exfoliated monolayers is shown in Fig. 20. Another method that is becoming increasingly popular is to grow material via CVD. This technique can lead to large area samples and is discussed at length in the previous section. Independent of preparation technique, the single layer nature of the TMD to be interrogated can be confirmed based on the Raman signature.
Reference Tonndorf, Schmidt, Böttger, Zhang, Börner, Liebig, Albrecht, Kloc, Gordan, Zahn, Michaelis de Vasconcellos and Bratschitsch155,Reference Lee, Yan, Brus, Heinz, Hone and Ryu185–Reference Terrones, Corro, Feng, Poumirol, Rhodes, Smirnov, Pradhan, Lin, Nguyen, Elías, Mallouk, Balicas, Pimenta and Terrones189
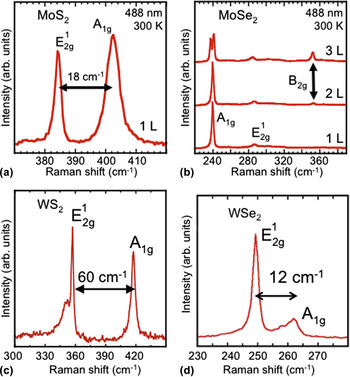
For example, with MoS2 and WS2 the separation of the in-plane
 ${\rm{E}}_{2{\rm{g}}}^1$
and out-of-plane
 ${\rm{A}}_{\rm{g}}^1$
Raman modes varies as a function of temperature. In the single layer limit, the energy difference for MoS2 is 18 cm−1 while for the bulk it is 23 cm−1.
Reference Tonndorf, Schmidt, Böttger, Zhang, Börner, Liebig, Albrecht, Kloc, Gordan, Zahn, Michaelis de Vasconcellos and Bratschitsch155,Reference Lee, Yan, Brus, Heinz, Hone and Ryu185,Reference Molina-Sánchez and Wirtz186,Reference Terrones, Corro, Feng, Poumirol, Rhodes, Smirnov, Pradhan, Lin, Nguyen, Elías, Mallouk, Balicas, Pimenta and Terrones189
In WS2 a single layer shows a separation of 60–61 cm−1 while for the bulk it is 65 cm−1.
Reference Molina-Sánchez and Wirtz186,Reference Berkdemir, Gutiérrez, Botello-Méndez, Perea-López, Elías, Chia, Wang, Crespi, López-Urías, Charlier, Terrones and Terrones187,Reference Terrones, Corro, Feng, Poumirol, Rhodes, Smirnov, Pradhan, Lin, Nguyen, Elías, Mallouk, Balicas, Pimenta and Terrones189
For WSe2, the bulk in-plane and the out-of-plane modes are degenerate (E = 250 cm−1), but this degeneracy is lifted for few and single layers. The resulting splitting is 12 cm−1 for a single layer and 6 cm−1 for the bilayer.
Reference Tonndorf, Schmidt, Böttger, Zhang, Börner, Liebig, Albrecht, Kloc, Gordan, Zahn, Michaelis de Vasconcellos and Bratschitsch155,Reference Sahin, Tongay, Horzum, Fan, Zhou, Li, Wu and Peeters188,Reference Terrones, Corro, Feng, Poumirol, Rhodes, Smirnov, Pradhan, Lin, Nguyen, Elías, Mallouk, Balicas, Pimenta and Terrones189
The identification of single layer MoSe2 is based on the absence of the B2g mode at 353 cm−1.
Reference Terrones, Corro, Feng, Poumirol, Rhodes, Smirnov, Pradhan, Lin, Nguyen, Elías, Mallouk, Balicas, Pimenta and Terrones189
Representative Raman spectra from each of these materials are presented in Fig. 21.
Optical image of (a) MoS2, (b) MoSe2, (c) WS2, and (d) WSe2 flakes exfoliated from bulk crystals.

Representative room temperature Raman spectra of the four TMDs shown in Fig. 20, (a) MoS2, (b) MoSe2, (c) WS2, and (d) WSe2.

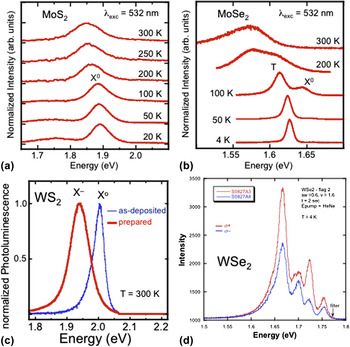
As discussed, when reduced to single monolayer, the TMDs become direct band gap semiconductors. Therefore, it is common to measure PL to further confirm the single layer nature of these materials. Room temperature PL emission from the four different samples is presented in Fig. 22. In these spectra, the dominant emission peak is the A-exciton, a feature that originates from the lowest energy transition at the K-point of the Brillouin zone [see Fig. 19(c)]. While each material emits at a wave length characterized by the band gap, the specific energy of emission can vary somewhat based on the quality and environment of the flake. For instance, the environment has a profound effect on the emission characteristics. Reference Tongay, Zhou, Ataca, Liu, Kang, Matthews, You, Li, Grossman and Wu190–Reference Currie, Hanbicki, Kioseoglou and Jonker196 The emission energy can vary by as much as 50 meV. Reference Kioseoglou, Hanbicki, Currie, Friedman, Gunlycke and Jonker119,Reference Lin, Ling, Yu, Huang, Hsu, Lee, Kong, Dresselhaus and Palacios194,Reference Mouri, Miyauchi and Matsuda195,Reference Plechinger, Schrettenbrunner, Eroms, Weiss, Schüller and Korn197 Multiple features associated with charged and neutral excitons can also be present in the spectra. Reference Ross, Wu, Yu, Ghimire, Jones, Aivazian, Yan, Mandrus, Xiao, Yao and Xu180,Reference Currie, Hanbicki, Kioseoglou and Jonker196,Reference Jones, Yu, Ghimire, Wu, Aivazian, Ross, Zhao, Yan, Mandrus, Xiao, Yao and Xu198
Representative PL spectra of the four TMDs shown in Fig. 20, (a) MoS2, (b) MoSe2, (c) WS2, and (d) WSe2.

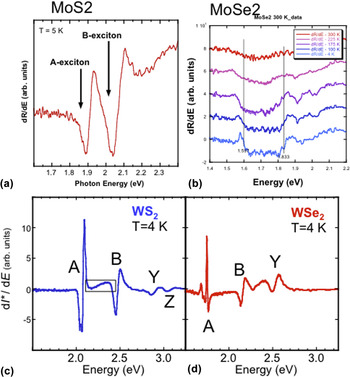
More detail on this aspect of the PL will be discussed later. To probe the electronic transitions in these monolayers, light from a broad-band radiation source is focused on the sample and the reflected intensity is measured. Because the flakes are atomically thin and are usually on a substrate, the reflected light spectra include the illumination source profile, the sample transmission and absorption, the substrate reflection and absorption, and potential resonant effects due to the thickness of the substrate. To distinguish the contribution from the monolayer TMD flake, one takes the difference between the intensity measured from the flake, I on, and from the substrate just off the flake, I off, and normalizes to the intensity from the substrate, I* = (I on − I off)/I off. This is commonly referred to as reflectivity, but is also called differential reflectivity or reflectance contrast. Figure 23 shows some representative reflectivity spectra from various TMDs.
Representative low temperature reflectivity spectra of the four TMDs shown in Fig. 20, (a) MoS2, (b) MoSe2, (c) WS2, and (d) WSe2.

C. High exciton binding energy
Photoexcitation in semiconductors is usually performed by promoting an electron directly from the valence band to the conduction band. A subsequent coulomb interaction, mitigated by dielectric screening from the surrounding lattice, leads to spatial confinement of the electron–hole pair. The resulting bound quasiparticle is known as an exciton. In bulk materials, excitons have binding energies less than 0.1 eV (e.g., ∼40 meV in bulk MoS2), so that the ground state of the exciton is just below the true band gap energy determined by the electronic band structure. In reduced dimensions dielectric screening is greatly reduced, which is predicted to lead to exciton binding energies ten times larger than in the bulk. Reference Qiu, da Jornada and Louie174,Reference Ramasubramaniam176,Reference Cheiwchanchamnangij and Lambrecht199–Reference Liang, Huang, Soklaski and Yang201 These high binding energy excitons exhibit behavior similar to excited atoms, with energy levels designated 1s, 2s, 2p and so on. The observation of both ground (1s) and excited (2p) states is therefore one way to determine a lower bound for the exciton binding energy.
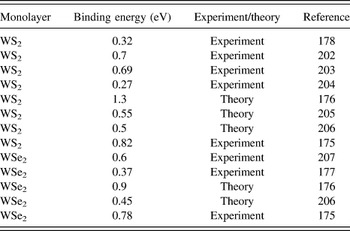
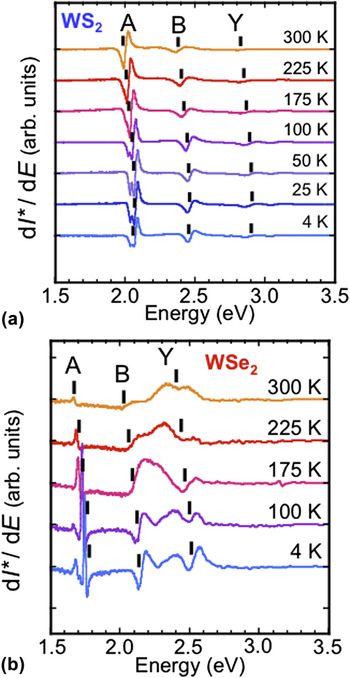
Table IV shows a summary of the dispersion of theoretical and experimental results for the binding energy of WS2 and WSe2 as found in the literature. As mentioned, one way to interrogate the band gap is to measure the optical reflectivity/absorption. Figure 24 displays the differential reflectivity from several single monolayer samples of WS2 [Fig. 24(a)] and WSe2 [Fig. 24(b)] in the energy range of 1.5–3.3 eV and temperatures of 4–300 K. Reference Hanbicki, Currie, Kioseoglou, Friedman and Jonker175
Summary of exciton binding energies reported in the literature.

Derivative of differential reflectivity from several single monolayer samples of (a) WS2 and (b) WSe2 in the energy range of 1.5–3.3 eV and temperatures of 4–300 K.

For each sample, there are peaks corresponding to the ground state exciton associated with the direct gap (A-exciton,
 $E_{1{\rm{s}}}^{\rm{A}}$
), and the exciton associated with the spin–orbit splitting of the direct gap valence band (B-exciton,
 $E_{1{\rm{s}}}^{\rm{B}}$
) occurring at the K/K′ points in the Brillouin zone. Similar features are reported in monolayer MoS2.
Reference Mak, He, Shan and Heinz118,Reference Splendiani, Sun, Zhang, Li, Kim, Chim, Galli and Wang121
By measuring to an energy of 3.3 eV, it is possible to observe distinct spectral features associated with the 2s excited state,
 $E_{{\rm{2s}}}^{\rm{A}}$
, of the A-exciton in both WS2 and WSe2. From these energy levels it is possible to derive a lower bound for the exciton binding energy as
 $E_{{\rm{2s}}}^{\rm{A}} \minus E_{1{\rm{s}}}^{\rm{A}}$
of 0.83 and 0.79 eV for WS2 and WSe2, respectively, and a lower bound for the corresponding band gaps
 ${E_{\rm{g}}} \ge E_{{\rm{2s}}}^{\rm{A}}$
of 2.90 and 2.53 eV at 4 K.
Reference Hanbicki, Currie, Kioseoglou, Friedman and Jonker175
These values compare well with theoretical predictions (binding energies of 1.04 and 0.9 eV for WS2 and WSe2, respectively).
Reference Ramasubramaniam176
These experimental values are significantly larger than the 0.37 eV binding energy reported by He et al.
Reference He, Kumar, Zhao, Wang, Mak, Zhao and Shan177
for WSe2, but are similar to the 0.7 eV binding energy reported by Ye et al.
Reference Ye, Cao, O'Brien, Zhu, Yin, Wang, Louie and Zhang203
for WS2. Both of these groups use two-photon PL spectroscopy measurements. A third group, also using absorption/reflectivity measurements, reported a binding energy of 0.32 eV in WS2 (Ref. Reference Chernikov, Berkelbach, Hill, Rigosi, Li, Aslan, Reichman, Hybertsen and Heinz178) based on a series of Rydberg-like states just above the A-exciton.
These remarkably high exciton binding energies imply that excitonic behavior dominates to room temperature and above, and as can be seen in Fig. 25, it is indeed possible to follow the evolution of these features to 300 K. Furthermore, because the binding energies are large, the electronic band gap (sometimes referred to as the true band gap) is substantially higher (∼1 eV) than the dominant excitonic spectral feature commonly observed with PL (the optical gap), and the exciton can be created directly using photoexcitation energies well below the true band gap. This has been an implicit, and to date largely unappreciated assumption of much experimental work. In contrast with most common semiconductors, excitons in these novel monolayer materials exist even at room temperature, and an excitonic band structure and framework should be used as a starting point to further understand their basic properties. Reference Song and Dery208 More advanced theoretical treatments Reference Qiu, da Jornada and Louie174,Reference Ramasubramaniam176,Reference Komsa and Krasheninnikov200 may provide more accurate estimates of the exciton binding energies, band gaps, and corresponding properties. It is clear from the broad dispersion of results in the community that further work is necessary to fully understand these novel 2D materials.
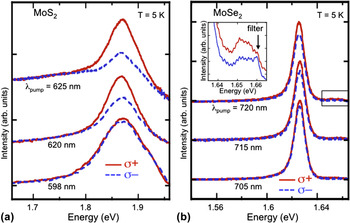
PL spectra at T = 5 K analyzed for σ+ and σ−at selected photoexcitation energies for (a) MoS2 and (b) MoSe2.

D. Intervalley scattering
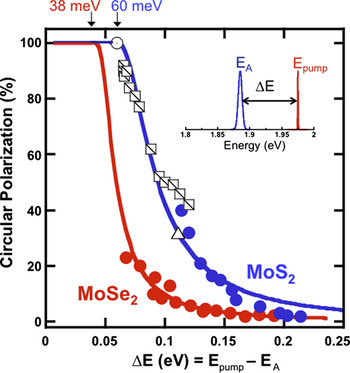
Another interesting property of these TMD materials is the spin-valley coupling that leads to rather unique optical selection rules [Fig. 19(c)]. When single-layer TMDs are excited with circularly polarized light, excitons are created in a single valley. The radiative decay of excitons within this valley subsequently produces circularly polarized light due to these optical selection rules. Therefore, measuring the circular polarization of electroluminescence or PL provides a direct way to monitor valley populations. The degree of circular polarization is defined as P circ = (I + − I −)/(I + + I −), where I + (I −) is the intensity of the σ + (σ−) component of the PL. Valley populations are altered by intervalley scattering, a process that is enabled by either phonons or the Coulomb interaction. Reference Kioseoglou, Hanbicki, Currie, Friedman, Gunlycke and Jonker119,Reference Song and Dery208,Reference Glazov, Amand, Marie, Lagarde, Bouet and Urbaszek209 At high temperatures or high photoexcitation energy, large phonon populations can readily couple the valleys, reducing valley specific populations.
Polarization-resolved PL of single layer MoS2 has been extensively studied, and a high initial circular polarization was reported with a circularly polarized pump. Reference Mak, He, Shan and Heinz118,Reference Sallen, Bouet, Marie, Wang, Zhu, Han, Lu, Tan, Amand, Liu and Urbaszek181 In contrast, there are few polarization-dependent studies for MoSe2 at zero magnetic field. One recent study Reference Wang, Palleau, Amand, Tongay, Marie and Urbaszek210 reported very low initial circular polarization in the PL which is surprising since one expects members of the MoX2 family to behave similarly. Several other recent studies, Reference MacNeill, Heikes, Mak, Anderson, Kormányos, Zólyomi, Park and Ralph211,Reference Li, Ludwig, Low, Chernikov, Cui, Arefe, Kim, van der Zande, Rigosi, Hill, Kim, Hone, Li, Smirnov and Heinz212 demonstrated generation of valley polarization in MoSe2 by applying external magnetic fields up to 10 T perpendicular to the sample. In particular, MacNeil et al. Reference MacNeill, Heikes, Mak, Anderson, Kormányos, Zólyomi, Park and Ralph211 observed a maximum polarization of 14% for the charged and 9% for the neutral exciton at 4.2 K and 6.7 T attributed to the magnetic field breaking the K/K′ valley-degeneracy.
Here we introduce some measurements of the energy-dependent valley polarization in both MoS2 and MoSe2 under zero magnetic field, and present a model for the polarization relaxation. Reference Kioseoglou, Hanbicki, Currie, Friedman and Jonker213 We probe the valley population dynamics in MoSe2 and MoS2 by selectively populating the K and K′ valleys with circularly polarized light [light of positive (σ+) or negative (σ−) helicity] while systematically varying the laser excitation energy. Figure 25 shows some PL spectra for MoS2 [Fig. 25(a)] and MoSe2 [Fig. 25(b)] analyzed for positive and negative helicity at T = 5 K at selected σ+ excitation energies. For both systems, the difference in the excitation energy and PL emission energy, ΔE = E pump − E PL, governs the depopulation of carriers in each valley. This can be seen most effectively in a plot of polarization versus ∆E (Fig. 26). In this figure it is clear that as the excess energy increases, the polarization decreases monotonically. Moreover, there is an energy threshold that needs to be surmounted before depolarization begins.
Degree of circular polarization of the emitted PL as a function of excess energy, ΔE.

Again, the degree of circular polarization is shown as a function of the excess energy in Fig. 26. The inset of this figure is a graphical representation of excess energy. Data from our group are plotted for MoSe2 (solid red circles) and MoS2 (solid blue circles) and are derived from spectra where the temperature was held constant and the laser energy was varied, or the laser energy was fixed and the emission energy was varied via a change in temperature. Reference Mak, Lee, Hone, Shan and Heinz116,Reference Kioseoglou, Hanbicki, Currie, Friedman, Gunlycke and Jonker119,Reference Sallen, Bouet, Marie, Wang, Zhu, Han, Lu, Tan, Amand, Liu and Urbaszek181 Other data for MoS2 from the literature are also plotted in Fig. 26. The open circles and the open triangles are data from Refs. Reference Mak, Lee, Hone, Shan and Heinz116 and Reference Zeng, Dai, Yao, Xiao and Cui182 (respectively) taken at 5 K, and the open squares are data from Ref. Reference Sallen, Bouet, Marie, Wang, Zhu, Han, Lu, Tan, Amand, Liu and Urbaszek181 obtained at fixed excitation energy but at different temperatures. All data follow the same depolarization trend line when plotted as a function of excess energy. Using this methodology, all of the data collapse onto a single curve for each material, independent of whether the polarization of the trion or neutral exciton is considered. The data clearly demonstrate that as the excess energy increases the emitted circular polarization decreases.
To explain this behavior, we begin by noting that intervalley scattering can account for the reduced polarization observed, and the change in momentum necessary for such scattering implicates a phonon-mediated process. Reference Mak, He, Shan and Heinz118,Reference Kioseoglou, Hanbicki, Currie, Friedman, Gunlycke and Jonker119 Close to resonance, the emitted circular polarization is expected to be essentially 100%, since there is not enough energy in the system to facilitate intervalley scattering. As the laser excitation energy increases or as the temperature changes for a fixed pumping energy, the available excess energy ∆E increases and phonon-assisted scattering is enabled above some material-dependent energy threshold. For MoS2, the combined data set clearly interpolate to 100% polarization at ∆E = 60 meV. This distinct threshold is the same energy as twice the longitudinal acoustic (LA) phonon characteristic of MoS2 [30 meV for MoS2 (Ref. Reference Molina-Sánchez and Wirtz186)]. The MoSe2 data (solid red symbols) exhibit a similar behavior—the measured polarization rapidly increases as the excess energy ∆E decreases. The solid red line in Fig. 27 is a model fit described below, and intercepts 100% polarization at ∆E = 38 meV, corresponding to twice the MoSe2 LA phonon energy of 19 meV from the literature. Reference Horzum, Sahin, Cahangirov, Cudazzo, Rubio, Serin and Peeters214 These data make it clear that depolarization and intervalley scattering are governed by the excess energy, ∆E, imparted to the photoexcited carriers through optical pumping.
Photoluminescence of WS2 monolayer as a function of excitation power at room temperature for samples in (a) air and (b) vacuum.

To model this behavior, we begin with a familiar rate equation model in which the emitted circular polarization can be expressed as
 $P_{{\rm{circ}}} = {1 \mathord{\left/ {\vphantom {1 {\left( {1 + 2{{\tau _{\rm{r}} } \over {\tau _{\rm{s}} }}} \right)}}} \right. \kern-\nulldelimiterspace} {\left( {1 + 2{{\tau _{\rm{r}} } \over {\tau _{\rm{s}} }}} \right)}}$
, where τr is the exciton lifetime and τs the intervalley scattering time.
Reference Mak, He, Shan and Heinz118,Reference Kioseoglou, Hanbicki, Currie, Friedman, Gunlycke and Jonker119
The increase in the excess energy ∆E, leads to an increase of the phonon population. Assuming τr to be linearly dependent on temperature
Reference Palummo, Bernardi and Grossman215
and the scattering rate τs
−1 to be proportional to the phonon population
 $\langle n\rangle = {1 \mathord{\left/ {\vphantom {1 {\left( {{\rm{e}}^{{{\hbar \omega _{\rm{q}} } \mathord{\left/ {\vphantom {{\hbar \omega _{\rm{q}} } {kT}}} \right. \kern-\nulldelimiterspace} {kT}}} - 1} \right)}}} \right. \kern-\nulldelimiterspace} {\left( {{\rm{e}}^{{{\hbar \omega _{\rm{q}} } \mathord{\left/ {\vphantom {{\hbar \omega _{\rm{q}} } {kT}}} \right. \kern-\nulldelimiterspace} {kT}}} - 1} \right)}}$
, we can fit the data using the relationship
 $P = {1 \mathord{\left/ {\vphantom {1 {\left( {{{1 + C\Delta E} \mathord{\left/ {\vphantom {{1 + C\Delta E} {\left( {{\rm{e}}^{{{\hbar \omega _{\rm{q}} } \mathord{\left/ {\vphantom {{\hbar \omega _{\rm{q}} } {\left( {\Delta E - \hbar \omega _q } \right)}}} \right. \kern-\nulldelimiterspace} {\left( {\Delta E - \hbar \omega _q } \right)}}} - 1} \right)}}} \right. \kern-\nulldelimiterspace} {\left( {{\rm{e}}^{{{\hbar \omega _{\rm{q}} } \mathord{\left/ {\vphantom {{\hbar \omega _{\rm{q}} } {\left( {\Delta E - \hbar \omega _q } \right)}}} \right. \kern-\nulldelimiterspace} {\left( {\Delta E - \hbar \omega _q } \right)}}} - 1} \right)}}} \right)}}} \right. \kern-\nulldelimiterspace} {\left( {{{1 + C\Delta E} \mathord{\left/ {\vphantom {{1 + C\Delta E} {\left( {{\rm{e}}^{{{\hbar \omega _{\rm{q}} } \mathord{\left/ {\vphantom {{\hbar \omega _{\rm{q}} } {\left( {\Delta E - \hbar \omega _q } \right)}}} \right. \kern-\nulldelimiterspace} {\left( {\Delta E - \hbar \omega _q } \right)}}} - 1} \right)}}} \right. \kern-\nulldelimiterspace} {\left( {{\rm{e}}^{{{\hbar \omega _{\rm{q}} } \mathord{\left/ {\vphantom {{\hbar \omega _{\rm{q}} } {\left( {\Delta E - \hbar \omega _q } \right)}}} \right. \kern-\nulldelimiterspace} {\left( {\Delta E - \hbar \omega _q } \right)}}} - 1} \right)}}} \right)}}$
, where ħωq is twice the LA phonon energy, the minimum energy necessary for the exciton (electron and hole) to scatter from one valley to the other and reduce the optical polarization. The only fitting parameters are then a scaling constant C and ħωq. The solid lines in Fig. 26 are fits to the data and yield values for 2LA of 54 meV for MoS2 and 38 meV for the MoSe2, in good agreement with the respective literature values of 60 and 38 meV
Reference Molina-Sánchez and Wirtz186,Reference Horzum, Sahin, Cahangirov, Cudazzo, Rubio, Serin and Peeters214
In summary, depolarization of both MoS2 or MoSe2 can be modeled by a single depolarization mechanism: intervalley scattering mediated by LA phonons. The threshold needed for depolarization is found to be twice the LA phonon energy of the corresponding material, and the exciton kinetic energy greater than this is the key parameter for the depolarization. Generating high chirality PL in Mo-based two-dimensional structures enables applications in valley-photonics.
E. Effect of environment
When TMDs are optically pumped, the resultant PL is characterized by excitonic emission. In an undoped material, the main emission feature is from the neutral exciton, X0. Charged excitons, or trions, become important in doped systems and have emission energies 30–50 meV below the neutral exciton. Reference Mak, He, Lee, Lee, Hone, Heinz and Shan179 The dynamic behavior of photoexcited carriers in MX2 materials are governed by strong Coulomb interactions. These interactions have a profound influence on the charge concentration which in turn influences physical properties. Modification of the carrier concentration in MoS2, has been achieved by applying a gate bias (in FET devices), Reference Mak, He, Lee, Lee, Hone, Heinz and Shan179 physisorption, Reference Tongay, Zhou, Ataca, Liu, Kang, Matthews, You, Li, Grossman and Wu190 chemical doping, Reference Mouri, Miyauchi and Matsuda195 and functionalization. Reference Lin, Han, Wang, Wang, Xiang, Qin, Zhang, Wang, Zhang, Wee and Chen216 Changes in carrier density can enhance the formation of charged excitons (trions) and manipulation of trions in both MoS2 and MoSe2 using electrostatic gating has been demonstrated. Reference Mak, He, Lee, Lee, Hone, Heinz and Shan179,Reference Ross, Wu, Yu, Ghimire, Jones, Aivazian, Yan, Mandrus, Xiao, Yao and Xu180
There are a myriad of ways in which changes to the carrier concentration in MX2 materials influence the optical properties, and more specifically the PL. For example, in MoS2, increased electron doping suppresses optical absorption near the exciton peaks resulting in diminished exciton PL intensity. Concurrent with this intensity reduction is the emergence of a trion peak. Reference Mak, He, Lee, Lee, Hone, Heinz and Shan179 Conversely, MoS2, which is typically n-type, can be transformed to heavily p-type via chemical absorption of oxygen at defect sites formed during annealing. This process converts negatively charged trions back to neutral excitons, resulting in an enhancement of the neutral exciton PL. Reference Nan, Wang, Wang, Liang, Lu, Chen, He, Tan, Miao, Wang, Wang and Ni191
Similarly, physisorbed molecules (e.g., O2 and H2O) were shown to influence the PL in MoS2, MoSe2, and WSe2. Reference Tongay, Zhou, Ataca, Liu, Kang, Matthews, You, Li, Grossman and Wu190 Annealing produced a large increase in the PL intensity for MoS2 and MoSe2 samples in O2 and H2O environments, while PL decreased for WSe2 samples. These changes are reversible and result from carrier transfer between the gas and the 2D material. Reference Tongay, Zhou, Ataca, Liu, Kang, Matthews, You, Li, Grossman and Wu190 Finally, large PL intensity was observed from induced defects (specifically MoS2, MoSe2, and WSe2), Reference Tongay, Zhou, Ataca, Liu, Kang, Matthews, You, Li, Grossman and Wu190 where point defects were created by either high-temperature annealing or by alpha-particle irradiation. Reference Tongay, Suh, Ataca, Fan, Luce, Kang, Liu, Ko, Raghunathanan, Zhou, Ogletree, Li, Grossman and Wu217 The point defects consist of anion vacancies which in turn enable bound exciton formation. Gas molecules that interact with defect sites can enhance PL by draining electrons, shifting charged excitons to neutral excitons. The surface sensitivity we observe is likely responsible for many emission characteristics seen in all TMDs, since these materials are dominated by their surface properties.
In addition to modifying the carrier concentration via external perturbations, such as with the addition of adsorbates, it is also possible to optically prepare monolayers such that the emission is from either only the neutral exciton or only the charged exciton (trion) state. Reliably and reproducibly controlling TMD absorption and emission behavior is important for physical measurements (e.g., time-resolved measurements of the pure exciton/trion state) as well as for most applications of these materials.
The emission spectrum of WS2 in ambient atmosphere is dominated by the neutral exciton low power while the trion is the dominant peak at high excitation power, and this process is completely reversible. This is not the case in vacuum. The PL spectra as a function of increasing excitation power for the sample in vacuum are shown in Fig. 27. Once the trion is stabilized by exciting with high power, even after reducing the excitation power to nanowatt levels, the trion emission remains dominant.
To reverse this state and regain the neutral exciton emission the sample must be exposed to air. If the sample is exposed to only nitrogen or helium, the neutral exciton will not be recovered.
To facilitate the transition from the neutral exciton to the trion, we focused a 532-nm laser on the sample to provide a 200-kW/cm2 irradiance. We then raster scanned the laser thoroughly over the entire monolayer region of WS2 (in vacuum). This caused a complete shift in the PL spectrum from the purely neutral exciton PL, as it is in ambient atmosphere, to a purely charged exciton PL. The resulting trion PL is independent of the probing PL excitation power, and further rastering produced no additional change demonstrating the saturation of this process for this optical power level. Thus, we are able to create an optically prepared system in WS2 where either the exciton or trion exists. This effect can be achieved in seconds, which is much faster than hour-long annealing processes used in the studies described above. Reference Tongay, Zhou, Ataca, Liu, Kang, Matthews, You, Li, Grossman and Wu190
Luminescence changes appear to be quenched by surface interactions with the ambient environment, evidenced by the fact that the optically prepared state is reversible by exposing the sample to air. This enables deliberate investigation of specific surface properties for WS2 and other 2D materials. For instance, optical preparation allows isolated examination of pure trion or exciton states, necessary for observing many physical processes, e.g., time-resolved exciton measurements. This also provides a tool to modify optical emission energy and could potentially modify the band structure in 2D materials enabling applications in optical modulation, tunable optical sources and detectors as well as all-optical sensors. The methodology described here lends itself to optical control of charged exciton states in WS2 (and potentially all TMD and 2D materials) by merely exposing the material to light in controlled environments.
VII. MONOLAYER TMDS AS CHEMICAL VAPOR SENSORS
The surface sensitivity of TMDs observed in the previous section affects its optical properties, here we will show that it also affects its transport properties making TMDS excellent chemical vapor sensors. Chemical vapor sensing with monolayers is a particularly promising field. Because of the inherent few-atom thinness of these materials, these materials are extremely sensitive to surface perturbations. The range of properties available with ultra-thin TMDs, such as a different band gap for each TMD, gives them a large advantage for chemical sensing applications over the ubiquitous monolayer 2D carbon material graphene. Graphene has low chemical reactivity, making it an unselective chemical vapor sensor. Reference Schedin, Geim, Morozov, Hill, Blake, Katsnelson and Novoselov218–Reference Rumyantsev, Liu, Shur, Potyrailo and Balandin220 The high electron density of graphene means that dipole adsorbates are screened, having no effect on device transport at moderate concentrations. Functionalization of graphene can effectively reduce conductivity, but adsorbate binding to the additional functional groups, being somewhat displaced from the surface, only weakly affects device conductivity, and does not significantly enhance sensor applicability and selectivity. Reference Robinson, Perkins, Snow, Wei and Sheehan221 Contrarily, the TMDs have vastly more desirable properties for sensing applications. For MoS2 in particular, its ability to catalyze, or even actively participate in chemical reactions, has been a subject of interest to the oil industry for hydrodesulfurization for quite some time, indicating its potential for additional chemical applications. Reference Topsøe, Clausen and Massoth222–Reference Moses, Hinnemann, Topsøe, Jens and Norskov224
Recently, several groups demonstrated that MoS2 is an extraordinarily sensitive chemical vapor sensor, responding selectively to strong electron donors (e.g., amines). Reference Perkins, Friedman, Cobas, Campbell, Jernigan and Jonker117,Reference Friedman, Keith Perkins, Cobas, Jernigan, Campbell, Hanbicki and Jonker225–Reference Late, Huang, Liu, Acharya, Shirodkar, Luo, Yan, Charles, Waghmare, Dravid and Rao227 Thus far, MoS2 is isolated through mechanical exfoliation for these purposes. However, as knowledge of growth processes advances, the realization of easily scalable, high electrical quality wafer scale MoS2 is imminent (see, for instance, the discussion elsewhere in this review). Simple MoS2 FETs are the dominant sensor device design. FET devices remain limited by Schottky barrier contacts. But, several groups have partially mitigated this problem using graphene as the contact, Reference Kwak, Hwang, Calderon, Alsalman, Munoz, Schutter and Spencer228 low work function metals, Reference Das, Chen, Penumatcha and Appenzeller229 or contact phase engineering. Reference Kappera, Voiry, Yalcin, Branch, Gupta, Mohite and Chhowalla230 Device lithography is done primarily with electron-beam methods. Figure 28 displays a cartoon schematic of a completed MoS2 chemical vapor sensor FET device and an optical image of a completed device.
(a) Cartoon schematic of a MoS2 FET device for chemical vapor sensing. (b) Optical image of a completed single layer MoS2 sensor FET device.

Chemical vapor sensing is performed by monitoring the conductance of back-gated FET devices during vapor exposure. Figure 29(a) shows that the voltage response of one such device as the analyte [in this case triethylamine, TEA, a decomposition by product of the V–X (Ref. Reference Mirzayanov231) series nerve agents and a representative of a class of strong electron donor analytes] is pulsed on and off at a constant concentration. The black line shows the device response, while the dotted blue line represents the pulsing profile. The red line is the device response for nitrogen only in the line, indicating that the device is indeed responding to the analyte and the results are not spurious. The slow increase in overall conductance of the device can be attributed to electrostatic charging as a result of the Schottky contacts, and the device can be discharged back to the original conductance state by grounding the device contacts. Figure 29(b) shows the incremental response for a single pulse peak for different concentrations of TEA, while Fig. 29(c) shows the pulsed response of the sensor for increasing concentrations of TEA. As expected, for an increased concentration delivers an increased response. Figure 29(d) compares the response of MoS2 with TEA to graphene and carbon nanotubes (CNTs). We see that for CNTs, MoS2 offers a complimentary response. Reference Snow, Perkins, Houser, Badescu and Reinecke232 Therefore, grouping CNTs and MoS2 together in the sensor would offer greater sensitivity and precision than either component alone. And, we see that MoS2 displays a greater response than graphene.
(a) Conductivity response of the monolayer MoS2 sensor (black line) as the TEA analyte is pulsed on and off (blue line). The red line gives the MoS2 sensor response with no TEA in the nitrogen stream. (b) The incremental response of the monolayer MoS2 sensor to changing concentrations of the TEA analyte. (c) The response of the monolayer MoS2 sensor (black line) to increasing pulses of acetone (blue line). (d) The responses of carbon nanotube (black line) and graphene (red line) sensors to TEA pulses (blue line), presented as a comparison to the MoS2 response. The ×1 graphene response is raw data. The ×10 graphene response has been multiplied by 10 to facilitate reading.

The electrical response of TMD sensors can be explained by a donor–acceptor model. The MoS2 sensors showed the highest sensitivity to electron donors and were selective against electron acceptors. A nanoscopically small quantity of analyte on the surface of the MoS2 acts as an electron donor and local reducing agent, measurably affecting the conductance of the channel. Modeling of the MoS2 electronic orbitals confirms that only the Mo 2d yz and S 2p orbitals are unused in internal chemical bonding and free to interact with the environment. Reference Zonnevylle, Hoffmann and Harris233 The Mo 2d yz orbital is compensated by the weak negative charge in the SiO2 substrate, leaving the positively charged S 2p as the dominant player in the chemical vapor sensing interaction. This mechanism is further explored by altering the charge profiles using a back gate, pictured in Fig. 30. Figure 30(a) shows that the MoS2 is n-type, turning to an “on” state with a positive applied back-gate voltage. Figure 30(b) shows that as the gating is increased for a multilayer film, the sensing response decreases. Figure 30(c), the incremental response of a monolayer device, shows that the gate has little effect on vapor sensing. This is summarized in Fig. 30(d). For a monolayer device, the gate increases charged attraction between the film and the substrate, which does not affect the device behavior. However, for the multilayer, a more complicated profile is created due to interlayer reactions and increased interlayer repulsion. Therefore, as the layer number increases, there are fewer positive charges available to participate in the charge mitigation of the adsorbed analyte molecules. Therefore, a thick enough layer will no longer have high sensitivity.
(a) Current versus back gate voltage at a variety of applied voltages for a MoS2 sensor, showing that this device acts like a FET and turns on at about 25 V. (b) The multilayer MoS2 device sensing response to TEA for different back gate voltages. The blue dotted line shows the analyte pulsing profile and the green line shows the response to nitrogen only. The device becomes less sensitive as the resistance decreases (gate voltage increases). (c) The MoS2 sensing response to TEA for a monolayer sample at different back gate voltages. (d) Incremental response versus back gate voltage (black line) and resistance versus back gate voltage (blue line) for a monolayer device. There is no correlation between response and gate voltage.

We detected analytes relevant to detecting explosives and nerve agents down to concentrations as low as 50 parts per billion. Such sensitivity is comparable to the current state-of-the-art conductance, 234 surface acoustic wave, Reference McGill, Nguyen, Chung, Shaffer, DiLella, Stepanowski, Mlsna, Venezky and Dominguez235 and optical 236 chemical vapor sensors. TMD sensors are also flexible, inexpensive, robust, and require only nanoamperes for operation, making them intrinsically ultralow power. These are all distinct advantages over many marketed state-of-the-art chemical vapor sensors. Finally, a simple thermal annealing to a few hundred degrees Celsius will clean the sample of physisorbed analyte, rendering the sensors reusable almost indefinitely. As physisorption, and even chemisorption, is strongly dependent on the band structure of the material, a variety of TMDs can be combined into a single sensing suite to identify compounds of interest, analyze mixtures, and add sensitivity to the devices, building in essence a synthetic nose. Reference Friedman, Keith Perkins, Cobas, Campbell, Jernigan and Jonker237 Figure 31 displays a radar plot of hypothetical responses of a variety of 2D materials to illustrate how they could be combined into a single sensing suite.
Radar plot of hypothetical responses of a suite of 2D materials acting as one chemical vapor sensor.

A. Summary
In this section we have shown that, in contrast to the linear gapless energy dispersion of graphene that we talked about in Sec. I, single layer TMDs are direct-gap semiconductors. TMDs have shown reasonable electronic mobility, high optical responsivity, environmental sensitivity, high valley polarization and long spin lifetimes, making this class of materials promising for optoelectronic components, chemical sensing, and valleytronic applications. We have shown that there are several promising routes to make large-area monolayer TMDs. We have used optical methods to probe the fundamental interactions in monolayer TMDs and compared them to results from the literature. Finally, we showed one specific example where a single layer of MoS2 is used as a selective chemical vapor sensor.
ACKNOWLEDGMENTS
This work was supported by core programs at NRL, and the Office of Naval Research. EC and ALF gratefully acknowledge support through the NRL Karles Fellow program. The authors gratefully acknowledge use of facilities in the NRL Nanoscience Institute, and thank David Zapotok, Dean St. Amand and Walter Spratt for continual technical support.