1 Introduction
In recent years, stability and transition processes in the boundary layer under solitary water waves have received increased attention in the coastal engineering community (cf. Liu, Park & Cowen Reference Liu, Park and Cowen2007; Vittori & Blondeaux Reference Vittori and Blondeaux2008; Sumer et al. Reference Sumer, Jensen, Sørensen, Fredsøe, Liu and Carstensen2010; Özdemir, Hsu & Balachandar Reference Özdemir, Hsu and Balachandar2013; Verschaeve & Pedersen Reference Verschaeve and Pedersen2014). Motivated by the design of harbours and other coastal installations, this boundary layer is of importance for understanding sediment transport phenomena under water waves and scaling effects in experiments.
In the present work, the mechanisms leading to instability and finally to turbulent transition will be investigated by means of a non-modal stability analysis. The present boundary layer is not only of interest for the coastal engineering community, but can also serve as a useful generic flow for the investigation of stability and transition mechanisms of boundary layers displaying favourable and adverse pressure gradients, such as the ones developing in front of and behind the location of maximum thickness of an airplane wing or turbine blade profile. In addition, the present flow can be considered a model for the single stroke of a pulsating flow, such as Stokes’ second problem, which is of importance for biomedical applications.
Solitary waves, which are found as either surface or internal waves, are of great interest in the ocean engineering community for several reasons. They are nonlinear and dispersive. When frictional effects due to the boundary layer at the bottom and the top are negligible, the shape of solitary waves is preserved during propagation. Relatively simple approximate analytic solutions exist (see e.g. Benjamin Reference Benjamin1966; Grimshaw Reference Grimshaw1971; Fenton Reference Fenton1972). In addition, these waves are relatively easy to reproduce experimentally. As such, they are often used in order to investigate the effect of a single crest of a train of waves.
The first works on the boundary layer under solitary waves aimed at estimating the dissipative effect on the overall wave (Shuto Reference Shuto1976; Miles Reference Miles1980). The bottom boundary layer has been considered more relevant than the surface boundary layer for viscous dissipation (Liu & Orfila Reference Liu and Orfila2004), and the stability of this boundary layer is also the subject of the present work.
The earliest experiments on the bottom boundary layer under solitary waves have been performed for internal waves by Carr & Davies (Reference Carr and Davies2006, Reference Carr and Davies2010) and for surface waves by Liu et al. (Reference Liu, Park and Cowen2007). The latter showed that an inflection point develops in the deceleration region behind the crest of the wave. However, instabilities have not been observed in the experiments performed by them (Liu et al.
Reference Liu, Park and Cowen2007). In 2010, Sumer et al. used a water tunnel to perform experiments on the boundary layer under solitary waves (Özdemir et al.
Reference Özdemir, Hsu and Balachandar2013). They observed three flow regimes. By means of a Reynolds number
 $Re_{\unicode[STIX]{x1D6FF}}$
, defined by the Stokes length of the boundary layer and the characteristic particle velocity, as used in Özdemir et al. (Reference Özdemir, Hsu and Balachandar2013) and in the present work, these regimes can be characterized as follows. For small Reynolds numbers
 $Re_{\unicode[STIX]{x1D6FF}}<630$
(
 ${\approx}Re_{Sumer}=2\times 10^{5}$
, i.e. the Reynolds number defined in Sumer et al. (Reference Sumer, Jensen, Sørensen, Fredsøe, Liu and Carstensen2010)), the flow does not display any instabilities and is close to the laminar solution given in Liu et al. (Reference Liu, Park and Cowen2007). For a Reynolds number in the range
 $630\leqslant Re_{\unicode[STIX]{x1D6FF}}<1000$
(
 $2\times 10^{5}\leqslant Re_{Sumer}<5\times 10^{5}$
), they observed the appearance of regularly spaced vortex rollers in the deceleration region of the flow. Increasing the Reynolds number further leads to a transitional flow displaying the emergence of turbulent spots growing together and causing transition to turbulence in the boundary layer. This happens at first in the deceleration region. However, the first instance of spot nucleation moves forward into the acceleration region of the flow for increasing Reynolds number. Sumer et al. (Reference Sumer, Jensen, Sørensen, Fredsøe, Liu and Carstensen2010) did not control the level of external disturbances in their experiments, nor did they report any information on its characteristics, such as length scale or intensity.
Almost parallel to the experiments by Sumer et al. (Reference Sumer, Jensen, Sørensen, Fredsøe, Liu and Carstensen2010), Vittori & Blondeaux performed direct numerical simulations of this flow (Vittori & Blondeaux Reference Vittori and Blondeaux2008, Reference Vittori and Blondeaux2011). Their results correspond roughly to the findings by Sumer et al. in that the flow in their simulations is first observed to display a laminar regime before displaying regularly spaced vortex rollers and finally becoming turbulent. However, the Reynolds numbers at which these regime shifts occur are larger than those in the experiments by Sumer et al. In particular, Vittori & Blondeaux observed the flow to be laminar until a Reynolds number somewhat lower than
 $Re_{\unicode[STIX]{x1D6FF}}=1000$
, after which the flow in their simulations displays regularly spaced vortex rollers. Transition to turbulence has been observed to occur for Reynolds numbers somewhat larger than
 $Re_{\unicode[STIX]{x1D6FF}}=1000$
. They triggered the flow regime changes by introducing a random disturbance of a specific magnitude in the computational domain before the arrival of the wave. Özdemir et al. (Reference Özdemir, Hsu and Balachandar2013) performed direct numerical simulations using the same approach as Vittori & Blondeaux, but varied the magnitude of the initial disturbance. As a result they found different flow regimes than those that Sumer et al. and Vittori & Blondeaux had observed. In the simulations by Özdemir et al., the flow stays laminar until
 $Re_{\unicode[STIX]{x1D6FF}}=400$
, then enters a regime they called ‘disturbed laminar’ for
 $400<Re_{\unicode[STIX]{x1D6FF}}<1500$
, where instabilities can be observed. For
 $Re_{\unicode[STIX]{x1D6FF}}>1500$
, regularly spaced vortex rollers appear in the deceleration region of the flow in their simulations, giving rise to a K-type transition before turbulent breakdown, if the Reynolds number is large enough. A K-type transition is characterized by a spanwise instability giving rise to the development of
 $\unicode[STIX]{x039B}$
-vortices arranged in an aligned fashion (cf. Herbert Reference Herbert1988). For very large Reynolds numbers
 $Re_{Sumer}>2400$
, Özdemir et al. reported that the K-type transition is replaced by a transition which reminded them of a free-stream layer-type transition.
Next to investigations based on direct numerical simulations and experiments, modal stability theories have been employed in the works by Blondeaux, Pralits & Vittori (Reference Blondeaux, Pralits and Vittori2012), Verschaeve & Pedersen (Reference Verschaeve and Pedersen2014) and Sadek et al. (Reference Sadek, Parras, Diamessis and Liu2015). Employing a quasi-static approach for the Orr–Sommerfeld equation (cf. von Kerczek & Davis Reference von Kerczek and Davis1974), Blondeaux et al. found that this unsteady flow displayed unstable regions for all of their Reynolds numbers considered, even those deemed stable by direct numerical simulation.
In order to explain the divergences in transitional Reynolds numbers obtained by direct numerical simulation and experiment, Verschaeve & Pedersen (Reference Verschaeve and Pedersen2014) performed a stability analysis in the frame of reference moving with the wave, where the present boundary layer flow is steady. For steady flows, well-established stability methods can be used. By means of the parabolized stability equation, they showed that, for all Reynolds numbers considered in their analysis, the boundary layer displays regions of growth of disturbances. As the flow goes to zero towards infinity, there exists a point on the axis of the moving coordinate where the perturbations reach a maximum amplification before decaying again for a given Reynolds number. Depending on the level of initial disturbances in the flow, this maximum amount of amplification is sufficient for triggering secondary instability, such as turbulent spots or
 $\unicode[STIX]{x039B}$
-vortices, or not. This explains the diverging critical Reynolds numbers observed in direct numerical simulations and experiments for this boundary layer flow. A particular case in point, mentioned in Verschaeve & Pedersen (Reference Verschaeve and Pedersen2014), is the experiment on the boundary layer under internal solitary waves by Carr & Davies (Reference Carr and Davies2006). Although, the amplitudes of the generated internal solitary waves in these experiments are relatively large compared to the thickness of the upper layer, the outer flow on the bottom is relatively well approximated by the first-order solution of Benjamin (Reference Benjamin1966) – cf. figure 12 in Carr & Davies (Reference Carr and Davies2006). In these experiments, the flow displays instabilities for Reynolds numbers much smaller than in the experiments by Sumer et al. (Reference Sumer, Jensen, Sørensen, Fredsøe, Liu and Carstensen2010) or in the direct numerical simulations by Vittori & Blondeaux (Reference Vittori and Blondeaux2008) or Özdemir et al. (Reference Özdemir, Hsu and Balachandar2013). Verschaeve & Pedersen (Reference Verschaeve and Pedersen2014) proposed that, due to the characteristic velocity of internal solitary waves being significantly smaller than that for surface solitary waves, they are expected to display instabilities much earlier for comparable levels of background noise.
Sadek et al. (Reference Sadek, Parras, Diamessis and Liu2015) performed a similar modal stability analysis as Verschaeve & Pedersen (Reference Verschaeve and Pedersen2014) by marching Orr–Sommerfeld eigenmodes forward in time using the linearized and two-dimensional nonlinear Navier–Stokes equations. They observed that only for Reynolds numbers larger than
 $Re_{\unicode[STIX]{x1D6FF}}=90$
do Orr–Sommerfeld eigenmodes display growth and consequently defined this Reynolds number to be the critical Reynolds number where the flow changes from a stable to an unstable regime.
The modal stability theories employed in Blondeaux et al. (Reference Blondeaux, Pralits and Vittori2012), Verschaeve & Pedersen (Reference Verschaeve and Pedersen2014) and Sadek et al. (Reference Sadek, Parras, Diamessis and Liu2015) capture only parts of the picture. In all of these works, only two-dimensional disturbances are considered. In addition, the amplifications computed in Verschaeve & Pedersen (Reference Verschaeve and Pedersen2014) and Sadek et al. (Reference Sadek, Parras, Diamessis and Liu2015) describe only the so-called exponential growth of the most unstable eigenfunction of the Orr–Sommerfeld equation. As shown in Butler & Farrell (Reference Butler and Farrell1992), Trefethen et al. (Reference Trefethen, Trefethen, Reddy and Driscoll1993), Schmid & Henningson (Reference Schmid and Henningson2001) and Schmid (Reference Schmid2007), perturbations can undergo significant transient growth even when modal stability theories predict the flow system to be stable. Non-modal theory formulates the stability problem as an optimization problem for the perturbation energy. In the present work, optimal perturbations are computed for the unsteady boundary layer flow under a solitary wave, complementing the modal analysis performed in Blondeaux et al. (Reference Blondeaux, Pralits and Vittori2012), Verschaeve & Pedersen (Reference Verschaeve and Pedersen2014) and Sadek et al. (Reference Sadek, Parras, Diamessis and Liu2015). In particular, we shall investigate the following questions.
In Sadek et al. (Reference Sadek, Parras, Diamessis and Liu2015), a critical Reynolds number is found based on a modal analysis. However, as perturbations can display growth even for cases where modal analysis predicts stability, this question needs to be treated in the framework of energy methods (Joseph Reference Joseph1966). Using an energy bound derived in Davis & von Kerczek (Reference Davis and von Kerczek1973), we shall show that a critical Reynolds number
 $Re_{A}>0$
can be found, such that, for all Reynolds numbers smaller than
 $Re_{A}$
, the flow is monotonically stable, meaning that all perturbations are damped for all times.
Özdemir et al. (Reference Özdemir, Hsu and Balachandar2013) supposed that a bypass transition starts to develop in their simulations for some cases, but could not explain why then suddenly two-dimensional perturbations emerge producing a K-type transition typical for growing Tollmien–Schlichting waves. In the present work, we shall show that non-modal theory is able to describe this competition between streaks and two-dimensional perturbations (i.e. non-modal Tollmien–Schlichting waves), which allows us to predict the onset of growth of streaks and two-dimensional perturbations, their maximum amplification and the point in time when this maximum is reached. Furthermore, the dependence on the Reynolds number of the maximum amplification will be investigated. The results obtained in the present work indicate why in the direct numerical simulations by Vittori & Blondeaux (Reference Vittori and Blondeaux2008, Reference Vittori and Blondeaux2011) and Özdemir et al. (Reference Özdemir, Hsu and Balachandar2013), in all cases investigated, two-dimensional perturbations lead to turbulent breakdown, although one would expect, at least for some cases, turbulent breakdown via three-dimensional structures for a purely random seeding. On the other hand, Sumer et al. (Reference Sumer, Jensen, Sørensen, Fredsøe, Liu and Carstensen2010) observed the growth of two-dimensional structures only for a certain range of Reynolds numbers, before the appearance of turbulent spots. A K-type transition has not been observed in their experiments. Turbulent spots are in general attributed to the secondary instability of streamwise streaks (see e.g. Andersson et al. Reference Andersson, Brandt, Bottaro and Henningson2001; Brandt, Schlatter & Henningson Reference Brandt, Schlatter and Henningson2004), though the random breakdown of Tollmien–Schlichting waves is also thought to produce turbulent spots (cf. Shaikh & Gaster Reference Shaikh and Gaster1994; Gaster Reference Gaster2016). The present analysis is limited to the primary instability of streamwise streaks and non-modal Tollmien–Schlichting waves. It gives, however, indications for a possible secondary instability mechanism of competing streaks and Tollmien–Schlichting waves.
The present work is organized as follows. In the following section, § 2, we describe the flow system and present equations for energy bounds and the non-modal governing equations. The solutions of these equations applied to the present flow are presented and discussed in § 3. In § 4, we shall relate the current findings to results obtained previously in the literature. The present work is concluded in § 5.
2 Description of the problem
2.1 Specification of base flow
The outer flow of the present boundary layer is given by the celebrated first-order solution for the inviscid horizontal velocity for solitary waves (Benjamin Reference Benjamin1966; Fenton Reference Fenton1972). For a given point at the bottom, the outer flow can thus be written as in Sumer et al. (Reference Sumer, Jensen, Sørensen, Fredsøe, Liu and Carstensen2010):
 $$\begin{eqnarray}U_{outer}^{\ast }(t^{\ast })=U_{0}\,\text{sech}^{2}(\unicode[STIX]{x1D714}_{0}t^{\ast }).\end{eqnarray}$$
In the limit of vanishing amplitude of the solitary wave, not only do the nonlinearities in the inviscid solution become negligible, but they can also be neglected in the boundary layer equations. Following Liu & Orfila (Reference Liu and Orfila2004), the horizontal component in the boundary layer
 $U_{base}$
can be written as
 $$\begin{eqnarray}U_{base}=U_{outer}+u_{bl},\end{eqnarray}$$
where
 $u_{bl}$
contains the rotational part of the velocity and ensures that the no-slip boundary condition is satisfied. Neglecting the nonlinearities, we obtain the following boundary layer equations for
 $u_{bl}$
(Liu et al.
Reference Liu, Park and Cowen2007; Park et al.
Reference Park, Verschaeve, Pedersen and Liu2014):
 $$\begin{eqnarray}\displaystyle & \displaystyle \frac{\unicode[STIX]{x2202}}{\unicode[STIX]{x2202}t}u_{bl}=\frac{1}{2}\frac{\unicode[STIX]{x2202}^{2}}{\unicode[STIX]{x2202}z^{2}}u_{bl}, & \displaystyle\end{eqnarray}$$
 $$\begin{eqnarray}\displaystyle & \displaystyle u_{bl}(0,t)=-U_{outer}(t), & \displaystyle\end{eqnarray}$$
 $$\begin{eqnarray}\displaystyle & \displaystyle u_{bl}(\infty ,t)=0, & \displaystyle\end{eqnarray}$$
 $$\begin{eqnarray}\displaystyle & \displaystyle u_{bl}(z,-\infty )=0. & \displaystyle\end{eqnarray}$$
Equation (2.3) is the linearized momentum equation. Equations (2.4) and (2.5) are the boundary conditions of the problem, with (2.4) representing the no-slip boundary condition and (2.5) representing the outer flow boundary condition. Equation (2.6) is the initial condition, which is advanced in time from
 $-\infty$
. The resulting base flow
 $U_{base}$
, equation (2.2), is valid on the entire time axis
 $t\in (-\infty ,\infty )$
. The scaling used in (2.3)–(2.6) is given by
 $\unicode[STIX]{x1D714}_{0}$
for the time,
 $$\begin{eqnarray}t=\unicode[STIX]{x1D714}_{0}t^{\ast },\end{eqnarray}$$
by
 $U_{0}$
for the velocity,
 $$\begin{eqnarray}U_{outer}=\frac{1}{U_{0}}U_{outer}^{\ast },\end{eqnarray}$$
and by the Stokes boundary layer thickness
 $\unicode[STIX]{x1D6FF}$
for the wall-normal variable
 $z$
,
 $$\begin{eqnarray}z=\frac{z^{\ast }}{\unicode[STIX]{x1D6FF}},\end{eqnarray}$$
where
 $$\begin{eqnarray}\unicode[STIX]{x1D6FF}=\sqrt{\frac{2\unicode[STIX]{x1D708}}{\unicode[STIX]{x1D714}_{0}}}.\end{eqnarray}$$
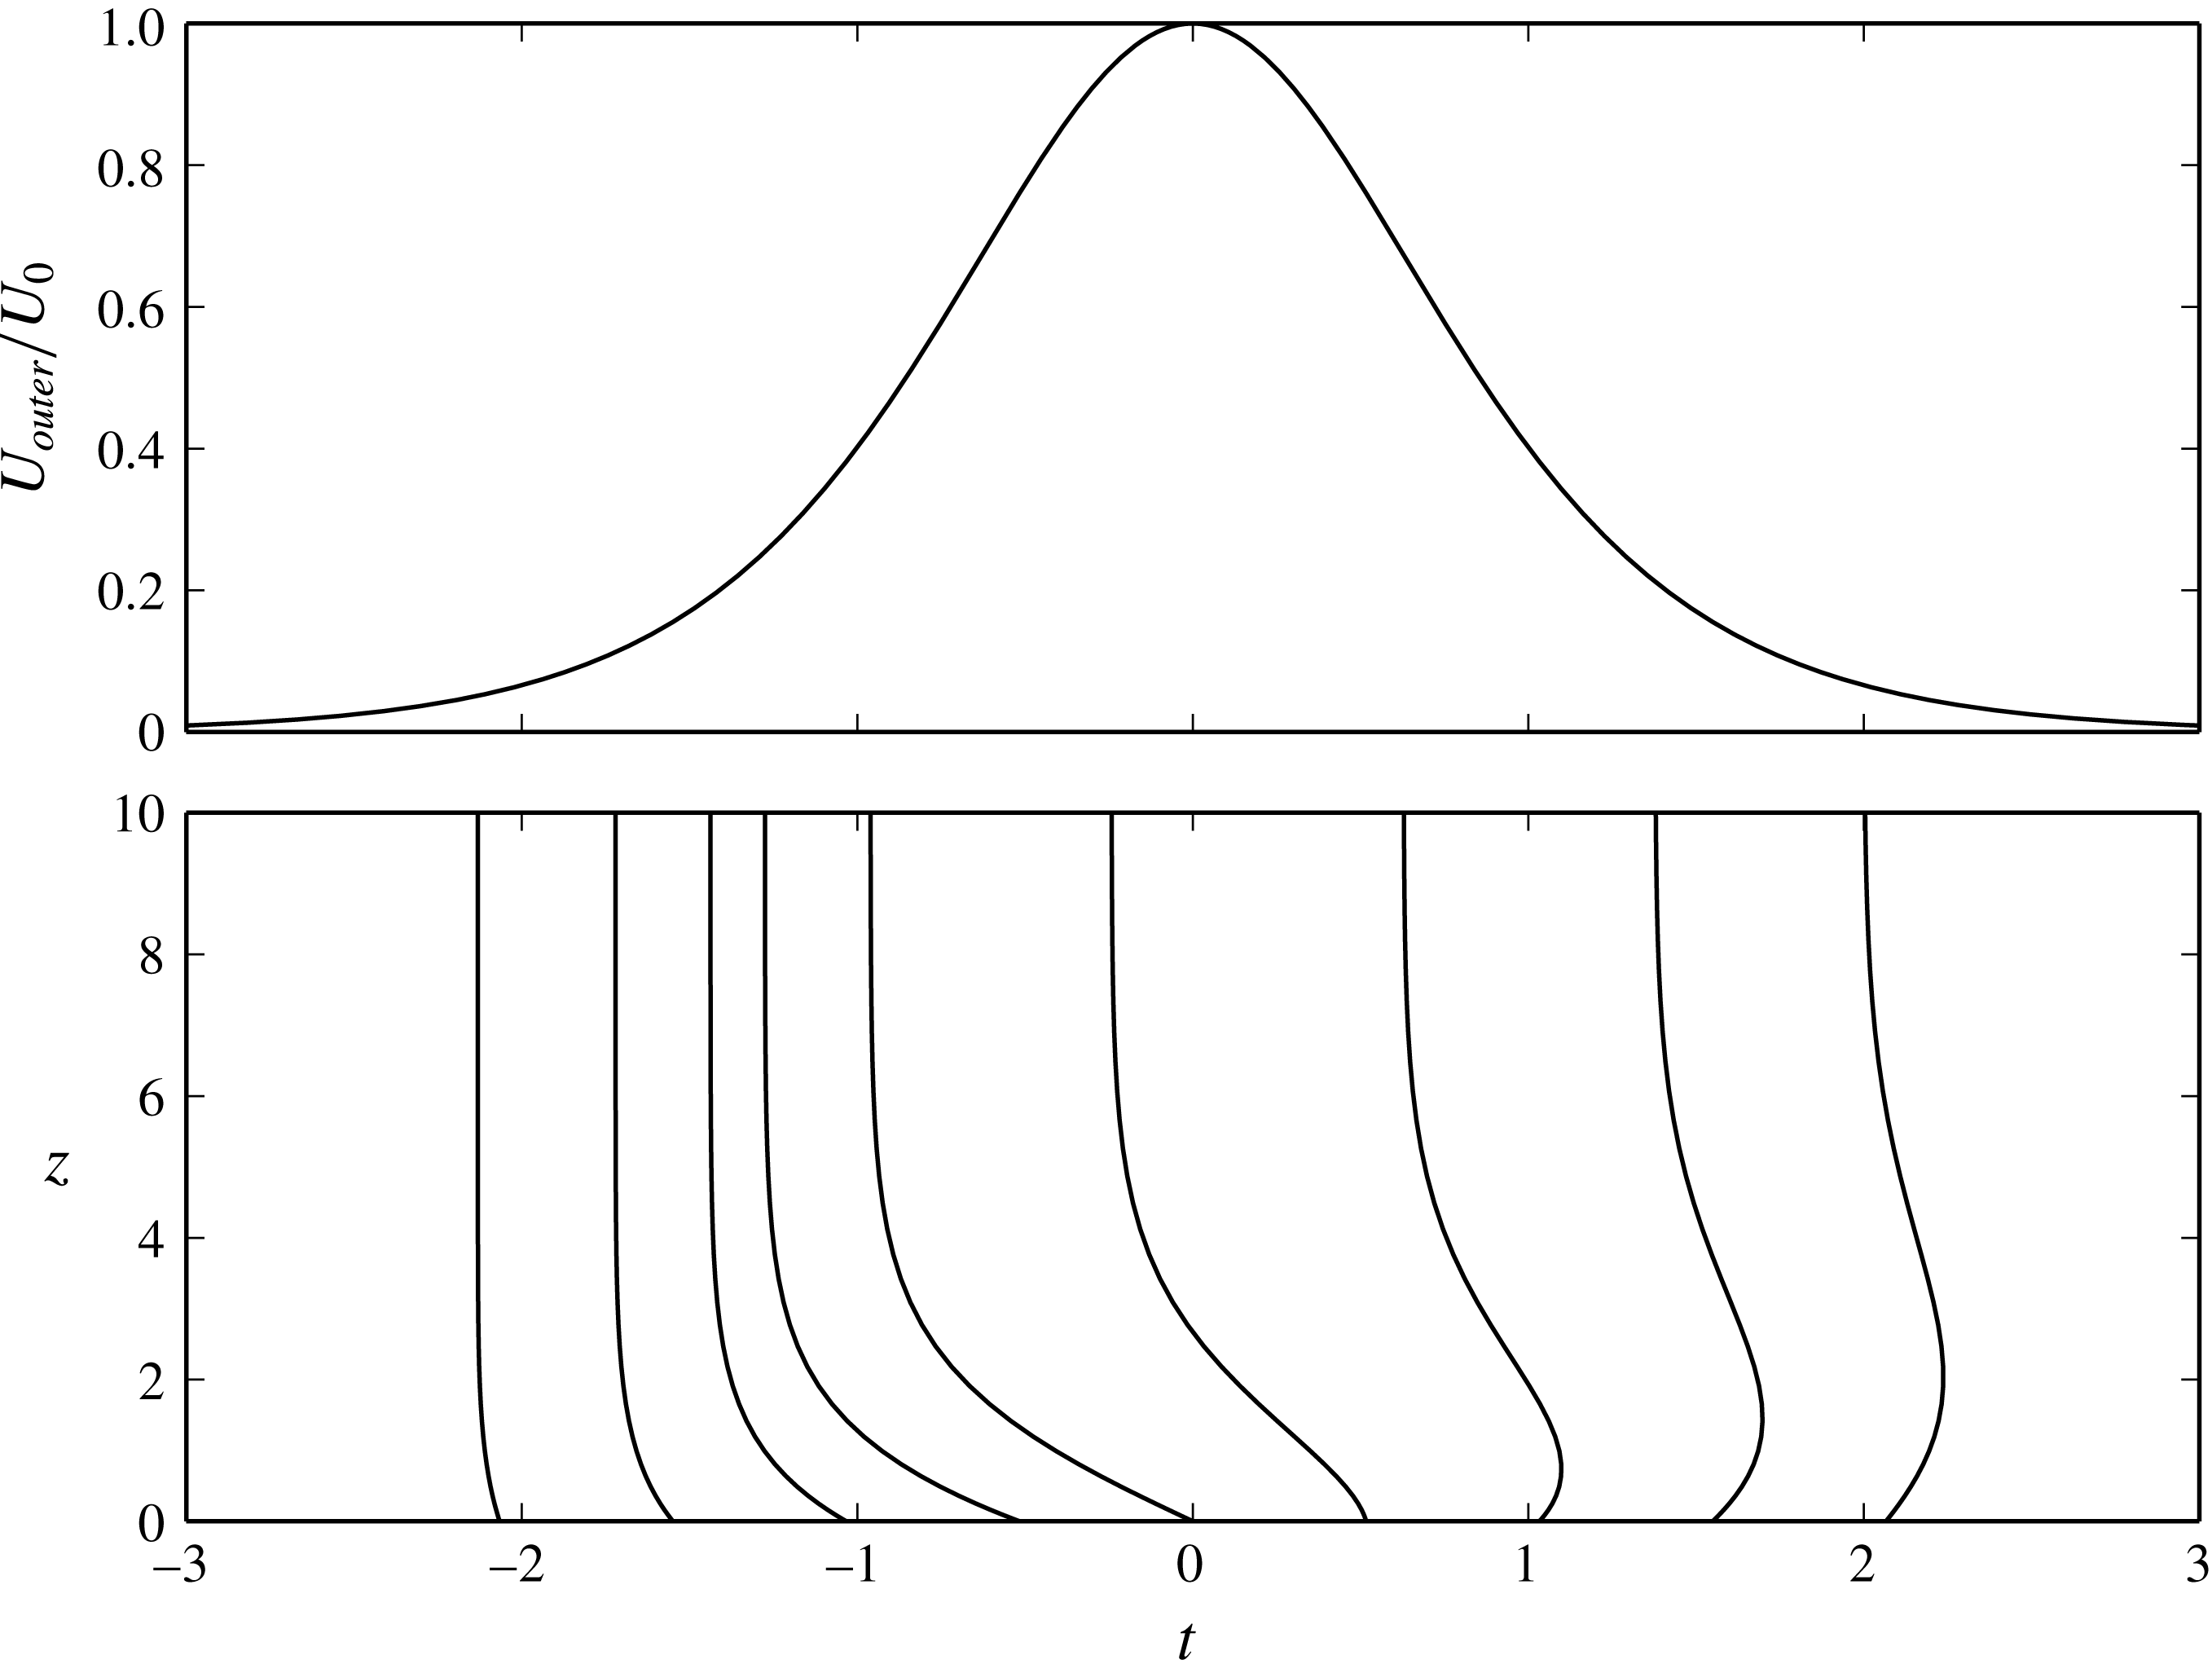
For the solution of (2.3)–(2.6), a Shen–Chebyshev discretization in wall-normal direction is chosen, whereas the resulting system is integrated in time by means of a Runge–Kutta integrator; cf. Shen (Reference Shen1995) and appendix A for details. Summing up, we consider solitary waves of small amplitudes for which (2.1) is a good approximation of the outer flow, such as the solitary wave experiments in Carr & Davies (Reference Carr and Davies2006, Reference Carr and Davies2010) and Liu et al. (Reference Liu, Park and Cowen2007) or the water channel experiments in Sumer et al. (Reference Sumer, Jensen, Sørensen, Fredsøe, Liu and Carstensen2010) and Tanaka et al. (Reference Tanaka, Winarta and Yamaji2011). As shown in Verschaeve & Pedersen (Reference Verschaeve and Pedersen2014), for larger-amplitude solitary waves the nonlinear effects are not negligible any more and significant qualitative differences arise, making the present non-modal approach no longer applicable. A sketch of the outer flow, together with profiles of the horizontal velocity component in the boundary layer under the solitary wave, is shown in figure 1.
Inviscid outer flow
 $U_{outer}$
at the bottom and profiles of the horizontal velocity component in the boundary layer under a solitary wave moving from right to left. The profiles have been multiplied by 40. The value at
 $z=0$
of the profiles shown corresponds to the point in time
 $t$
, at which the profile has been taken. The horizontal velocity vanishes at
 $z=0$
in order to satisfy the no-slip boundary condition.

2.2 Stability analysis by means of an energy bound
In the present work, we use the same definition for the Reynolds number as in Özdemir et al. (Reference Özdemir, Hsu and Balachandar2013). This Reynolds number
 $Re_{\unicode[STIX]{x1D6FF}}$
is based on the Stokes length
 $\unicode[STIX]{x1D6FF}$
and the characteristic velocity
 $U_{0}$
:
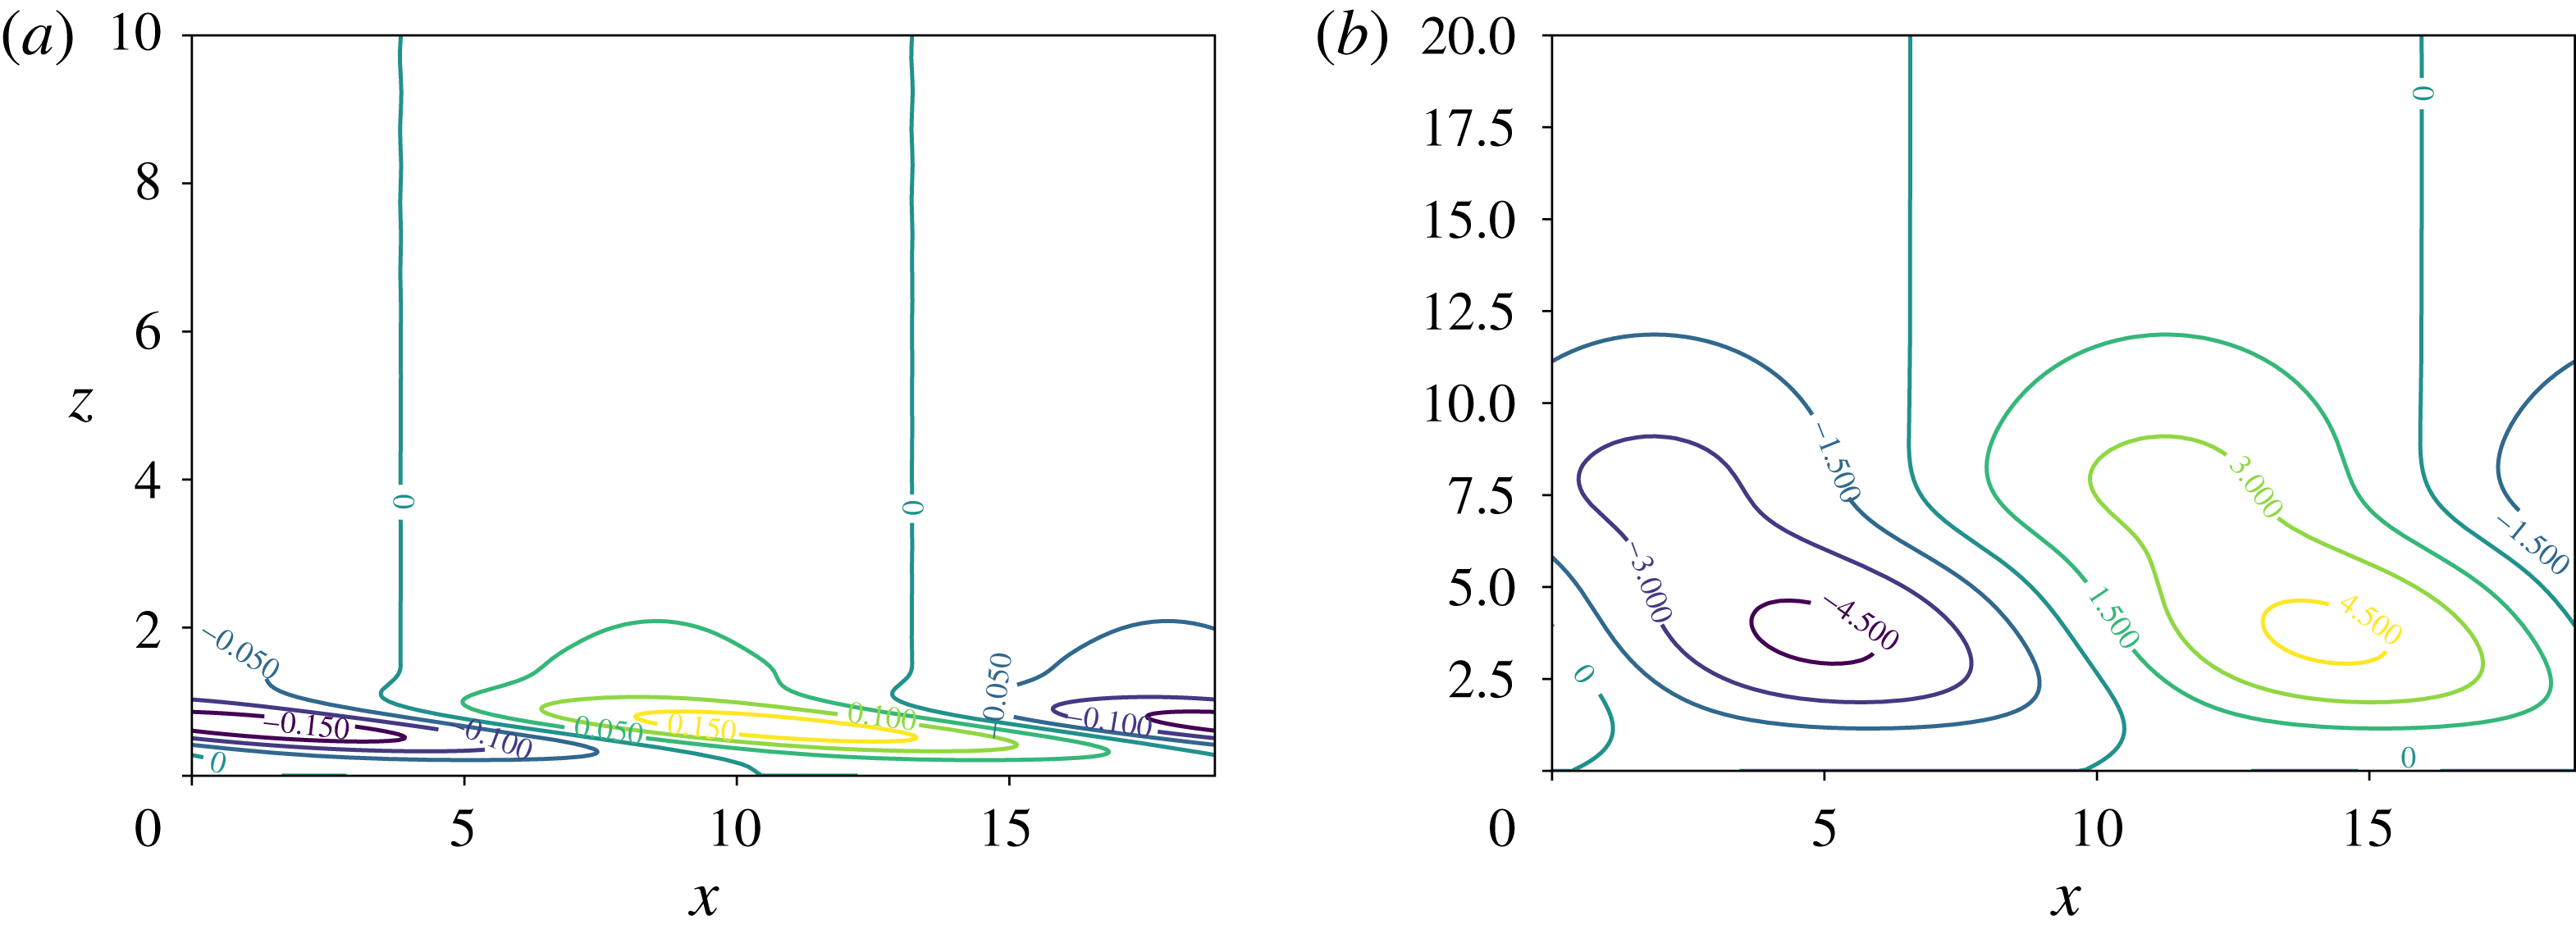
 $$\begin{eqnarray}Re_{\unicode[STIX]{x1D6FF}}=\frac{U_{0}\unicode[STIX]{x1D6FF}}{\unicode[STIX]{x1D708}}=U_{0}\sqrt{\frac{2}{\unicode[STIX]{x1D708}\unicode[STIX]{x1D714}_{0}}},\end{eqnarray}$$
where
 $\unicode[STIX]{x1D708}$
is the kinematic viscosity of the fluid. The Reynolds number
 $Re_{Sumer}$
used in Sumer et al. (Reference Sumer, Jensen, Sørensen, Fredsøe, Liu and Carstensen2010) is related to
 $Re_{\unicode[STIX]{x1D6FF}}$
by the following formula:
 $$\begin{eqnarray}Re_{\unicode[STIX]{x1D6FF}}=\sqrt{2Re_{Sumer}}.\end{eqnarray}$$
We introduce a perturbation velocity
 $\boldsymbol{u}^{\prime }=(u^{\prime },v^{\prime },w^{\prime })$
in the streamwise, spanwise and wall-normal direction, defined by
 $$\begin{eqnarray}\boldsymbol{u}^{\prime }=(u^{\prime },v^{\prime },w^{\prime })=(u_{ns},v_{ns},w_{ns})-(U_{base}(z,t),0,0),\end{eqnarray}$$
where
 $(u_{ns},v_{ns},w_{ns})$
satisfies the Navier–Stokes equations. The energy of the perturbation is given by
 $$\begin{eqnarray}E_{p}=\frac{1}{2}\int _{V}{u^{\prime }}^{2}+{v^{\prime }}^{2}+{w^{\prime }}^{2}\,\text{d}V,\end{eqnarray}$$
which is integrated over
 $V=\{(x,y,z)\mid z>0\}$
. For time-dependent flows in infinite domains, Davis & von Kerczek (Reference Davis and von Kerczek1973) derived a bound for the perturbation energy of the nonlinear Navier–Stokes equations:
 $$\begin{eqnarray}\frac{E_{p}(t)}{E_{p,0}}\leqslant \exp \left(\frac{Re_{\unicode[STIX]{x1D6FF}}}{2}\int _{t_{0}}^{t}\unicode[STIX]{x1D707}(t^{\prime })\,\text{d}t^{\prime }\right),\end{eqnarray}$$
where
 $\unicode[STIX]{x1D707}$
is the largest eigenvalue of the following linear system:
 $$\begin{eqnarray}\displaystyle & \displaystyle \frac{1}{Re_{\unicode[STIX]{x1D6FF}}}\unicode[STIX]{x0394}\boldsymbol{u}^{\prime }-\unicode[STIX]{x1D64E}_{base}(t)\boldsymbol{\cdot }\boldsymbol{u}^{\prime }-\unicode[STIX]{x1D735}p=\frac{1}{2}\unicode[STIX]{x1D707}\boldsymbol{u}^{\prime }, & \displaystyle\end{eqnarray}$$
 $$\begin{eqnarray}\displaystyle & \displaystyle \unicode[STIX]{x1D735}\boldsymbol{\cdot }\boldsymbol{u}^{\prime }=0, & \displaystyle\end{eqnarray}$$
where the tensor
 $\unicode[STIX]{x1D64E}_{base}$
is the rate-of-strain tensor given by the base flow, (2.2). We remark that Davis & von Kerczek (Reference Davis and von Kerczek1973) appear to have overlooked a sign and a factor 2 in their equations. As the rate-of-strain tensor depends on time, the eigenvalue
 $\unicode[STIX]{x1D707}$
is a function of
 $t$
. If
 $\unicode[STIX]{x1D707}<0$
for all times, then the flow is monotonically stable for this Reynolds number, meaning that all perturbations will decay for all times. This allows us to investigate whether there exists a Reynolds number
 $Re_{A}$
at which
 $\unicode[STIX]{x1D707}$
switches sign from negative to positive at some point in time. As the base flow is independent of
 $x$
and
 $y$
, we consider a single Fourier component of
 $\boldsymbol{u}^{\prime }$
:
 $$\begin{eqnarray}(u^{\prime },v^{\prime },w^{\prime })(x,y,z,t)=(u,v,w)(z,t)\exp [\text{i}(\unicode[STIX]{x1D6FC}x+\unicode[STIX]{x1D6FD}y)].\end{eqnarray}$$
This allows us to eliminate
 $p$
from (2.16) and (2.17), resulting in
 $$\begin{eqnarray}\displaystyle & \displaystyle \frac{1}{Re_{\unicode[STIX]{x1D6FF}}}{\mathcal{L}}^{2}w+\frac{\text{i}\unicode[STIX]{x1D6FC}}{2}\left\{\frac{\unicode[STIX]{x2202}^{2}}{\unicode[STIX]{x2202}z^{2}}U_{base}w+2\frac{\unicode[STIX]{x2202}}{\unicode[STIX]{x2202}z}U_{base}\frac{\unicode[STIX]{x2202}}{\unicode[STIX]{x2202}z}w\right\}+\frac{\text{i}\unicode[STIX]{x1D6FD}}{2}\frac{\unicode[STIX]{x2202}}{\unicode[STIX]{x2202}z}U_{base}\unicode[STIX]{x1D701}=\frac{1}{2}\unicode[STIX]{x1D707}{\mathcal{L}}w, & \displaystyle\end{eqnarray}$$
 $$\begin{eqnarray}\displaystyle & \displaystyle -\frac{1}{Re_{\unicode[STIX]{x1D6FF}}}{\mathcal{L}}\unicode[STIX]{x1D701}-\frac{\text{i}\unicode[STIX]{x1D6FD}}{2}\frac{\unicode[STIX]{x2202}}{\unicode[STIX]{x2202}z}U_{base}w=\frac{1}{2}\unicode[STIX]{x1D707}(-\unicode[STIX]{x1D701}), & \displaystyle\end{eqnarray}$$
where
 ${\mathcal{L}}$
is the Laplacian defined by
 $$\begin{eqnarray}\displaystyle {\mathcal{L}}=-k^{2}+\frac{\unicode[STIX]{x2202}^{2}}{\unicode[STIX]{x2202}z^{2}}, & & \displaystyle\end{eqnarray}$$
where
 $k^{2}=\unicode[STIX]{x1D6FC}^{2}+\unicode[STIX]{x1D6FD}^{2}$
. The system of four equations (2.16)–(2.17) has been reduced to two, by means of the normal vorticity component
 $\unicode[STIX]{x1D701}$
:
 $$\begin{eqnarray}\displaystyle \unicode[STIX]{x1D701}=\text{i}(\unicode[STIX]{x1D6FC}v-\unicode[STIX]{x1D6FD}u). & & \displaystyle\end{eqnarray}$$
A Galerkin formulation for the system (2.19)–(2.20) is chosen based on Shen–Legendre polynomials for the biharmonic equation for the normal component
 $w$
and Shen–Legendre polynomials for the Poisson equation for the normal vorticity
 $\unicode[STIX]{x1D701}$
(cf. Shen Reference Shen1994). Thereby, the Hermitian property of the system (2.19)–(2.20) is conserved in the discrete setting, guaranteeing purely real eigenvalues. Details of the implementation are given in appendix A.
2.3 The non-modal stability equations
The non-modal stability analysis is based on the linearized Navier–Stokes equations, which can be written in the present setting as follows:
 $$\begin{eqnarray}\displaystyle & \displaystyle \left(\frac{2}{Re_{\unicode[STIX]{x1D6FF}}}\frac{\unicode[STIX]{x2202}}{\unicode[STIX]{x2202}t}+\text{i}\unicode[STIX]{x1D6FC}U_{base}-\frac{1}{Re_{\unicode[STIX]{x1D6FF}}}{\mathcal{L}}\right){\mathcal{L}}w-\text{i}\unicode[STIX]{x1D6FC}w\frac{\unicode[STIX]{x2202}^{2}}{\unicode[STIX]{x2202}z^{2}}U_{base}=0, & \displaystyle\end{eqnarray}$$
 $$\begin{eqnarray}\displaystyle & \displaystyle \left(\frac{2}{Re_{\unicode[STIX]{x1D6FF}}}\frac{\unicode[STIX]{x2202}}{\unicode[STIX]{x2202}t}+\text{i}\unicode[STIX]{x1D6FC}U_{base}-\frac{1}{Re_{\unicode[STIX]{x1D6FF}}}{\mathcal{L}}\right)\unicode[STIX]{x1D701}-\text{i}\unicode[STIX]{x1D6FD}w\frac{\unicode[STIX]{x2202}}{\unicode[STIX]{x2202}z}U_{base}=0. & \displaystyle\end{eqnarray}$$
We refer to Schmid & Henningson (Reference Schmid and Henningson2001) and Schmid (Reference Schmid2007) for a thorough derivation of (2.23) and (2.24). Given an initial perturbation
 $(w_{0},\unicode[STIX]{x1D701}_{0})$
at time
 $t_{0}$
, (2.23) and (2.24) can be integrated to obtain the temporal evolution of
 $(w,\unicode[STIX]{x1D701})$
for
 $t>t_{0}$
. Non-modal theory formulates the stability problem as finding the initial condition
 $(w_{0},\unicode[STIX]{x1D701}_{0})$
maximizing the perturbation energy
 $E(t)$
of
 $(w,\unicode[STIX]{x1D701})$
at time
 $t>t_{0}$
. This perturbation energy
 $E$
is the sum of two contributions, one from the wall-normal component
 $w$
and one from the normal vorticity component
 $\unicode[STIX]{x1D701}$
:
 $$\begin{eqnarray}E(t)=E_{w}(t)+E_{\unicode[STIX]{x1D701}}(t)=\frac{1}{2}\int _{0}^{\infty }\frac{1}{k^{2}}\left|\frac{\unicode[STIX]{x2202}}{\unicode[STIX]{x2202}z}w\right|^{2}+|w|^{2}\,\text{d}z+\frac{1}{2}\int _{0}^{\infty }\frac{1}{k^{2}}|\unicode[STIX]{x1D701}|^{2}\,\text{d}z.\end{eqnarray}$$
The optimization problem can then be formulated by maximizing
 $E$
for a perturbation
 $(w,\unicode[STIX]{x1D701})$
satisfying (2.23) and (2.24) and having an initial energy
 $E_{0}$
. One way of solving this optimization problem is by means of the adjoint equation as in Luchini & Bottaro (Reference Luchini and Bottaro2014). Another approach for finding the optimal perturbation, which is employed in the present work, consists in formulating the discrete problem first and computing the evolution matrix
 $\unicode[STIX]{x1D653}(t,t_{0})$
of the system of ordinary differential equations – cf. Trefethen et al. (Reference Trefethen, Trefethen, Reddy and Driscoll1993), Schmid & Henningson (Reference Schmid and Henningson2001) and Schmid (Reference Schmid2007) for details. The energy
 $E$
is then given in terms of
 $\unicode[STIX]{x1D653}$
and the initial condition. Details of the implementation are given in appendix A. By computing
 $E(t)$
one way or the other, we can compute the amplification
 $G$
from time
 $t_{0}$
to
 $t$
of the optimal perturbation for wavenumbers
 $\unicode[STIX]{x1D6FC}$
and
 $\unicode[STIX]{x1D6FD}$
:
 $$\begin{eqnarray}G(\unicode[STIX]{x1D6FC},\unicode[STIX]{x1D6FD},t_{0},t,Re_{\unicode[STIX]{x1D6FF}})=\max _{(w_{0},\unicode[STIX]{x1D701}_{0})}\frac{E(t)}{E(t_{0})}.\end{eqnarray}$$
We remark that the initial condition
 $(w_{0},\unicode[STIX]{x1D701}_{0})$
from which the optimal perturbation starts might be different for each point in time
 $t$
, when tracing
 $G$
as a function of
 $t$
(cf. § 3). The maximum amplification
 $G_{max}(Re_{\unicode[STIX]{x1D6FF}})$
that can be reached for a given Reynolds number
 $Re_{\unicode[STIX]{x1D6FF}}$
is obtained by maximizing
 $G$
over time, initial time and wavenumbers:
 $$\begin{eqnarray}G_{max}=\max _{\unicode[STIX]{x1D6FC},\unicode[STIX]{x1D6FD},t_{0},t}G.\end{eqnarray}$$
In the following, we shall distinguish between three types of perturbations:
Streamwise streaks. These are perturbations independent of the streamwise coordinate
 $x$
. They can be computed by setting
 $\unicode[STIX]{x1D6FC}=0$
.
Two-dimensional perturbations. These perturbations are independent of the spanwise coordinate
 $y$
and can be computed by setting
 $\unicode[STIX]{x1D6FD}=0$
. In this case, (2.23) and (2.24) are decoupled. These two-dimensional perturbations can be considered non-modal Tollmien–Schlichting waves resulting from an optimization of the initial conditions of (2.23) and (2.24). Therefore, they display larger growth than modal Tollmien–Schlichting waves resulting from the Orr–Sommerfeld equation. This will be presented in more detail in § 4.
Oblique perturbations. These are all remaining perturbations with
 $\unicode[STIX]{x1D6FC}\neq 0$
and
 $\unicode[STIX]{x1D6FD}\neq 0$
.
3 Results and discussion
3.1 Monotonic stability
In this section, we shall determine the critical Reynolds number
 $Re_{A}$
behind which perturbations display growth. To this aim, the energy criterion in Davis & von Kerczek (Reference Davis and von Kerczek1973) will be used. We solve (2.19) and (2.20) for a given pair of wavenumbers
 $(\unicode[STIX]{x1D6FC},\unicode[STIX]{x1D6FD})$
and note the Reynolds number
 $Re_{\unicode[STIX]{x1D6FF}}$
for which the largest eigenvalue
 $\unicode[STIX]{x1D707}$
changes from minus to plus. At first, we compute the curves of critical Reynolds numbers
 $Re_{\unicode[STIX]{x1D6FF}}(\unicode[STIX]{x1D6FC})$
and
 $Re_{\unicode[STIX]{x1D6FF}}(\unicode[STIX]{x1D6FD})$
by setting
 $\unicode[STIX]{x1D6FD}=0$
and
 $\unicode[STIX]{x1D6FC}=0$
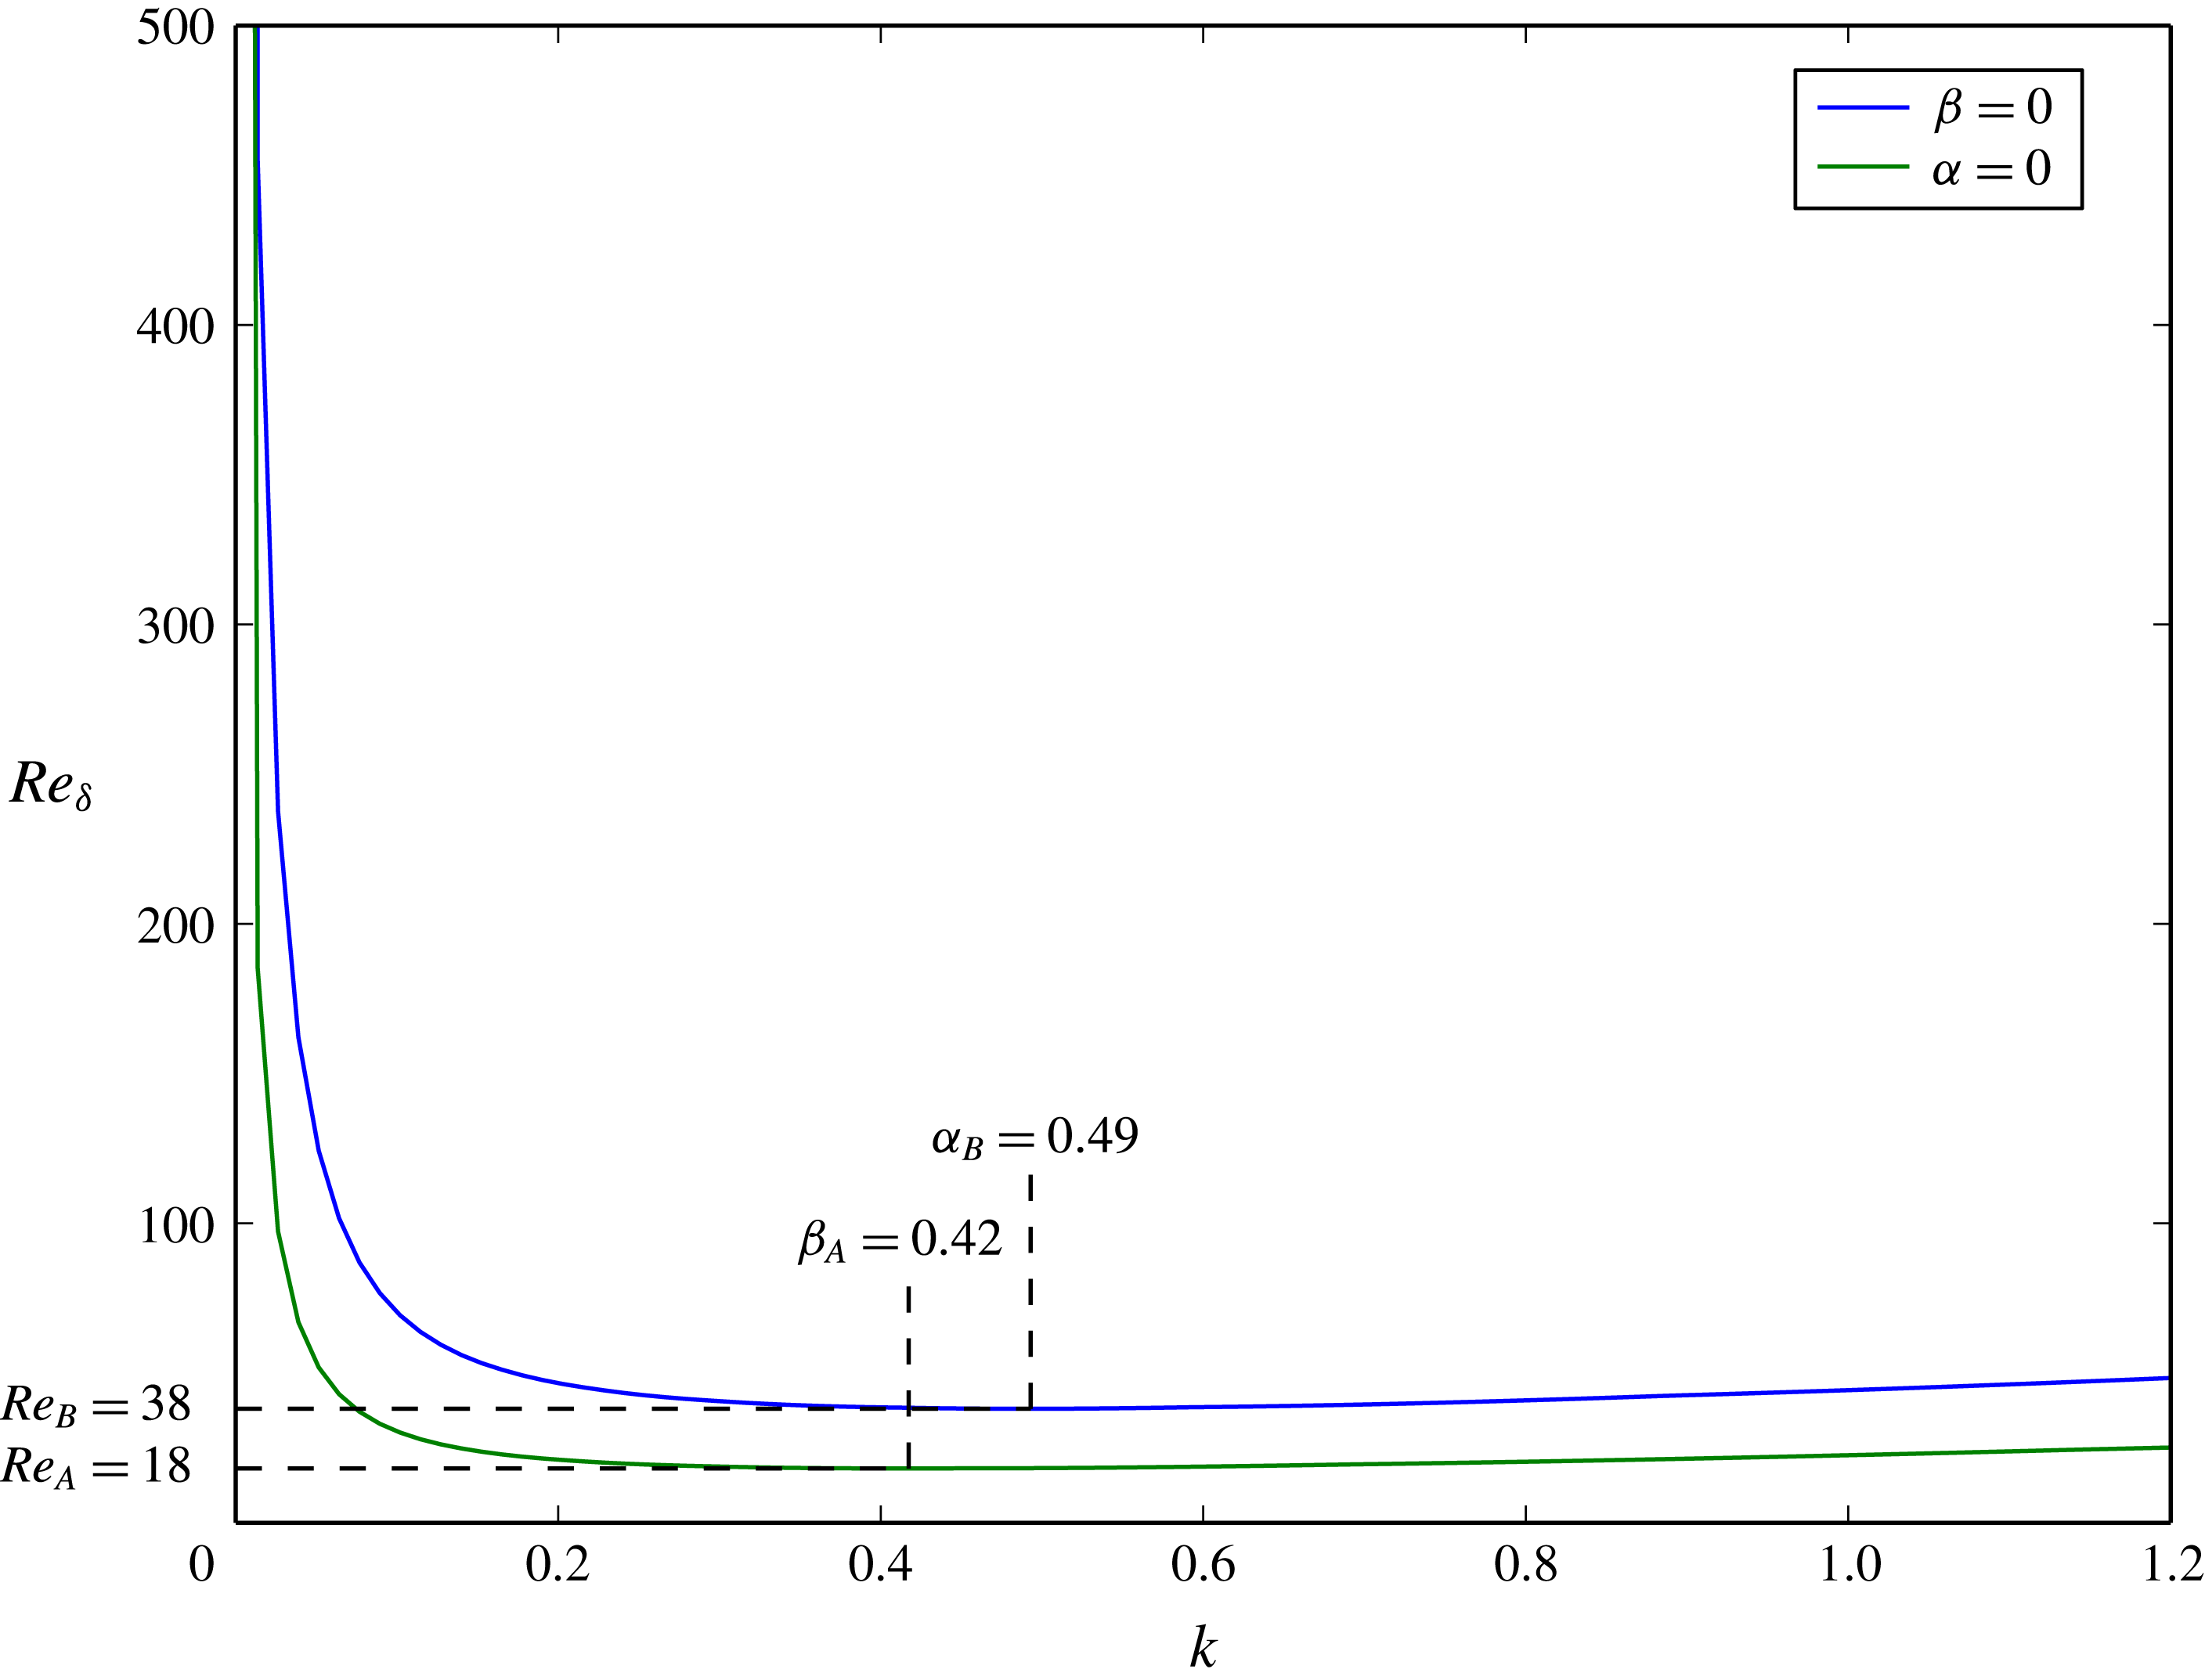
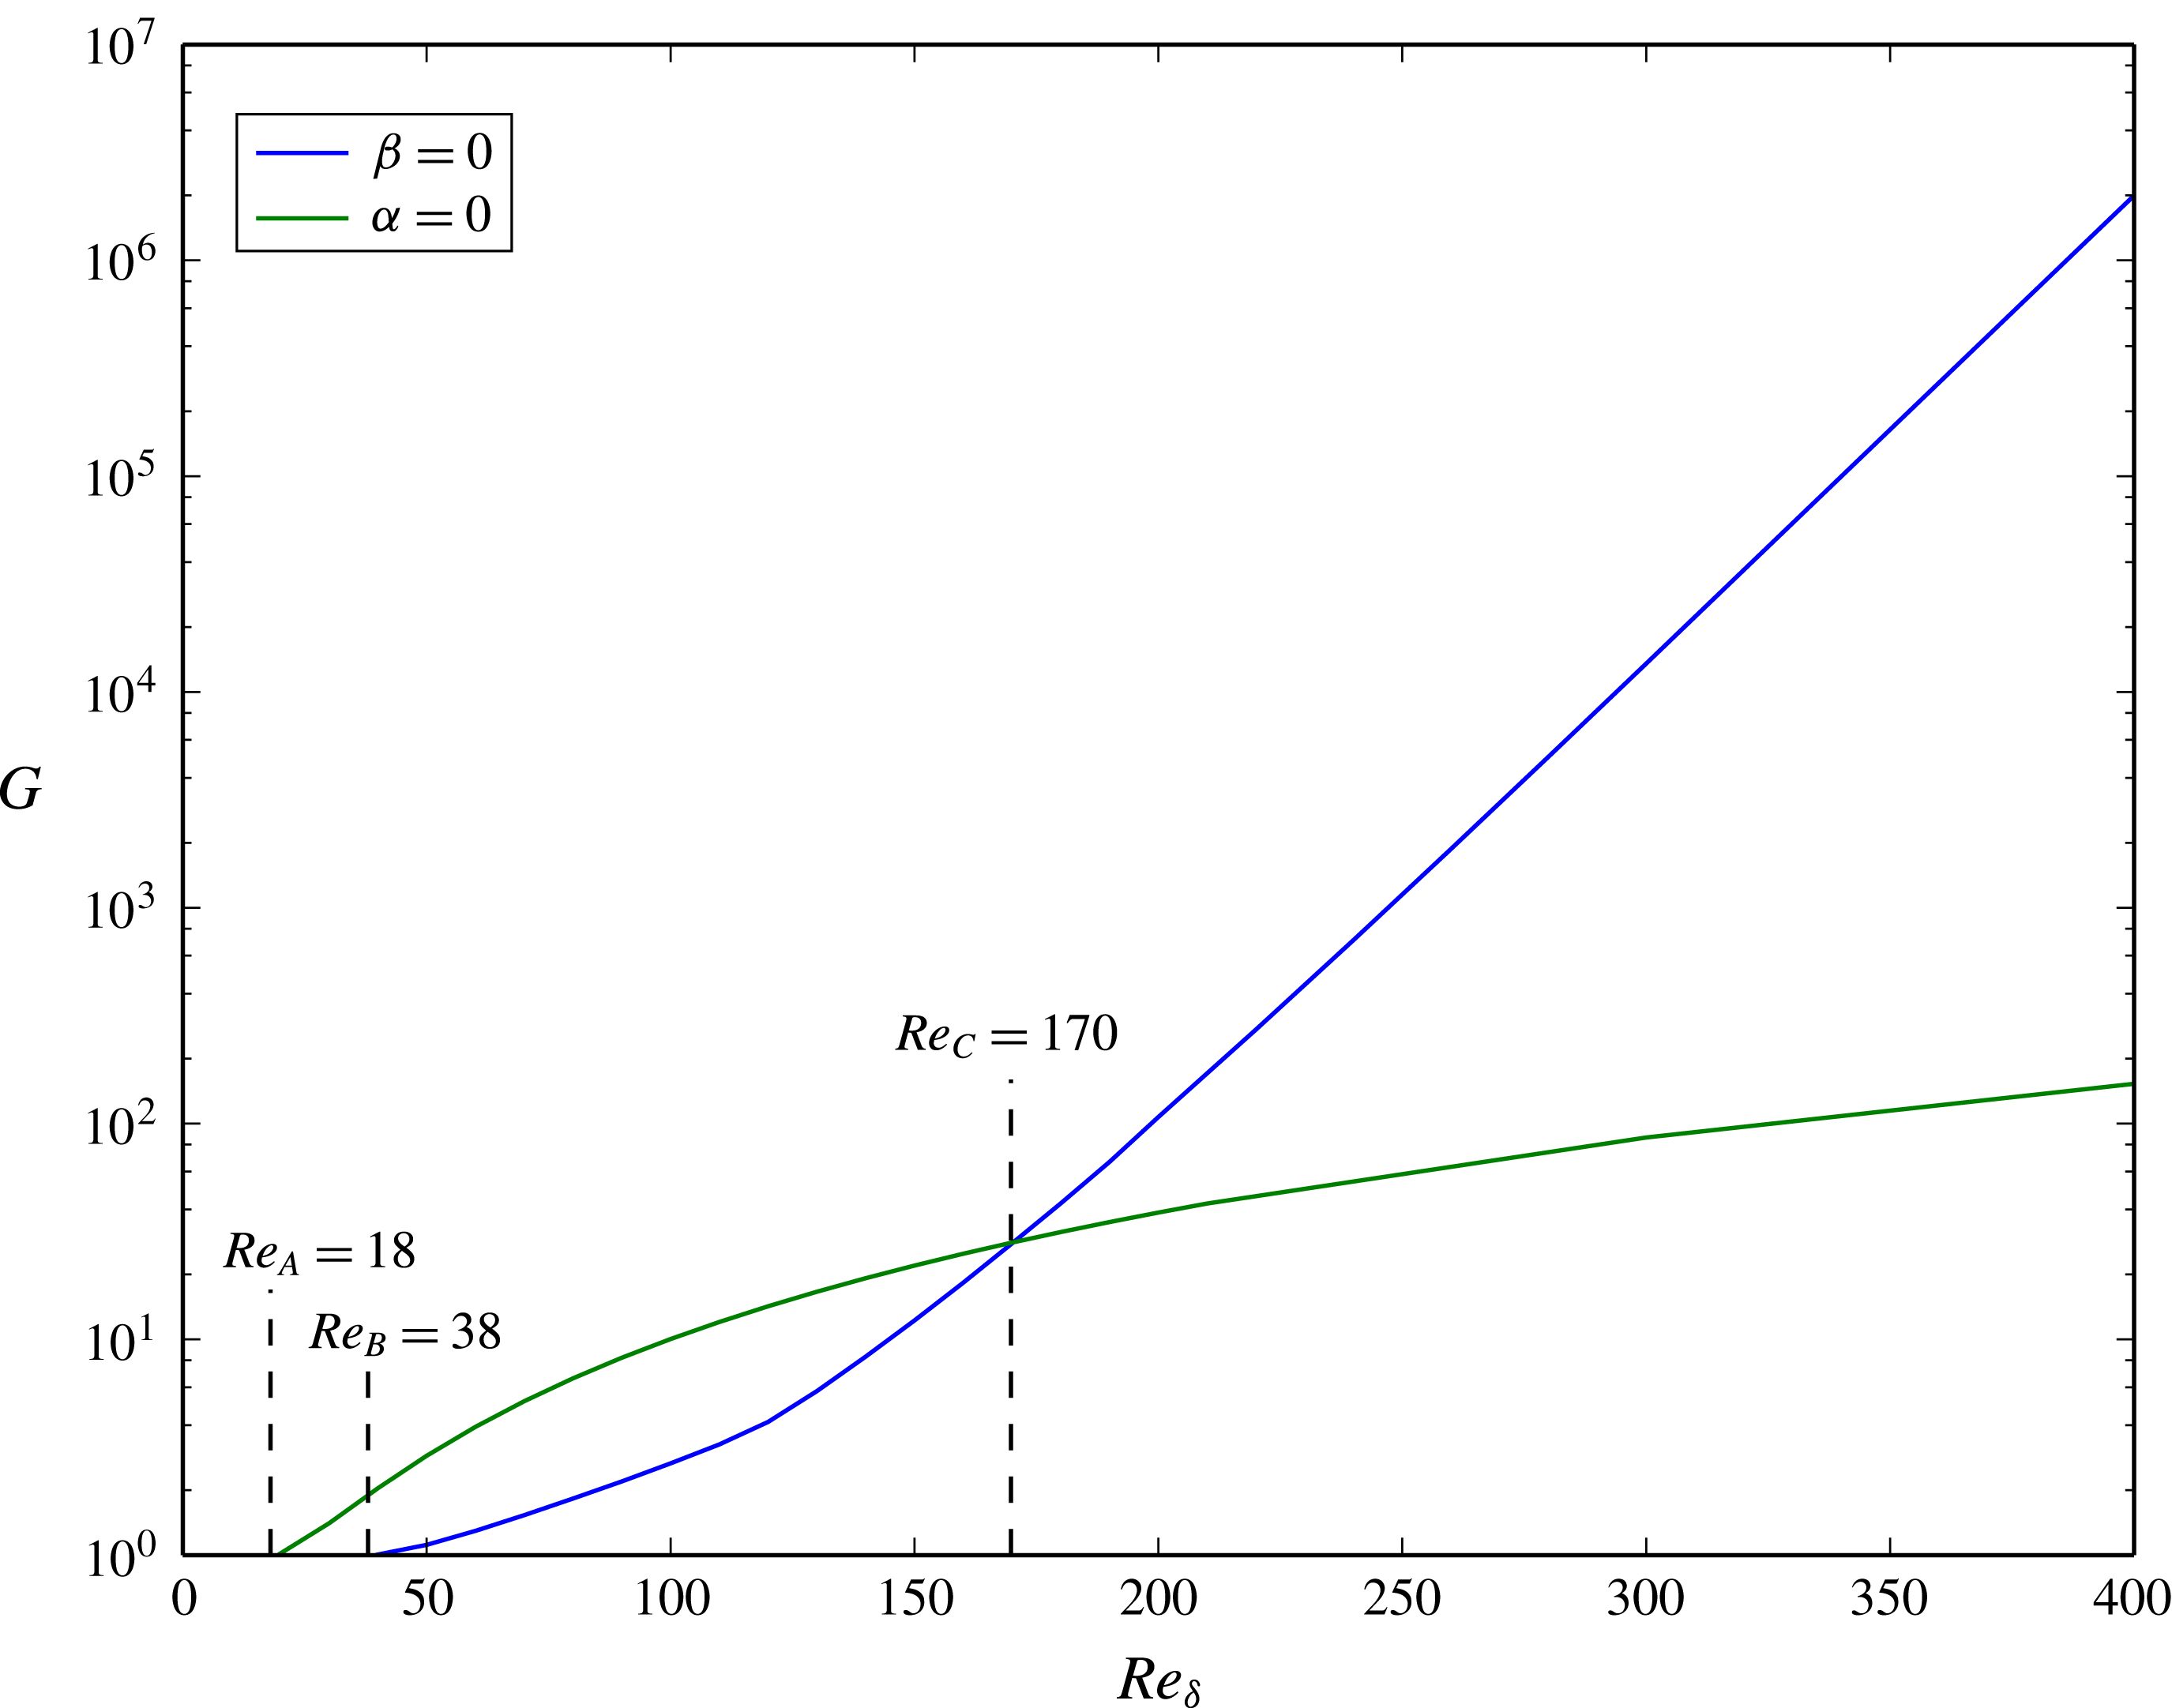
, respectively. These curves are plotted in figure 2. As it turns out, all other cases, i.e.
 $\unicode[STIX]{x1D6FC}\neq 0$
and
 $\unicode[STIX]{x1D6FD}\neq 0$
, have their critical Reynolds number lying in the region between these two curves. From figure 2, we can infer that the flow is monotonically stable for all Reynolds numbers
 $Re_{\unicode[STIX]{x1D6FF}}$
smaller than
 $Re_{A}=18$
. The physical significance of this critical Reynolds number is, however, limited. For example, the water depth of a surface solitary wave with amplitude ratio
 $\unicode[STIX]{x1D716}=0.1$
would be approximately
 $1~\text{cm}$
for this case. For these small water depths, other physical effects, such as capillary effects and not least the dissipative effect of the boundary layers on the solitary wave, are not negligible anymore. The solitary wave solution would thus not be valid in the first place. From figure 2, we observe that streamwise streaks will grow first. Two-dimensional perturbations, on the other hand, can only grow for flows with a Reynolds number larger than
 $Re_{B}=38$
.
Isolines of
 $\unicode[STIX]{x1D707}=0$
for the energy bound of Davis & von Kerczek (Reference Davis and von Kerczek1973), equations (2.19) and (2.20), as a function of the wavenumber
 $k^{2}=\unicode[STIX]{x1D6FC}^{2}+\unicode[STIX]{x1D6FD}^{2}$
and the Reynolds number
 $Re_{\unicode[STIX]{x1D6FF}}$
. The blue and green lines correspond to the cases
 $\unicode[STIX]{x1D6FD}=0$
and
 $\unicode[STIX]{x1D6FC}=0$
, respectively. All other cases have their critical Reynolds number in the space between these lines.

3.2 Optimal perturbation
3.2.1 Theoretical considerations
Before turning to the computation of the amplification
 $G$
, equation (2.26), we shall first consider a scaling argument, as in Gustavsson (Reference Gustavsson1991) and Schmid & Henningson (Reference Schmid and Henningson2001). For streamwise streaks (
 $\unicode[STIX]{x1D6FC}=0$
), (2.23) and (2.24) can be written as
 $$\begin{eqnarray}\displaystyle & \displaystyle \left(\frac{\unicode[STIX]{x2202}}{\unicode[STIX]{x2202}t}-\frac{1}{2}{\mathcal{L}}\right){\mathcal{L}}w=0, & \displaystyle\end{eqnarray}$$
 $$\begin{eqnarray}\displaystyle & \displaystyle \left(\frac{\unicode[STIX]{x2202}}{\unicode[STIX]{x2202}t}-\frac{1}{2}{\mathcal{L}}\right)\tilde{\unicode[STIX]{x1D701}}-\text{i}\unicode[STIX]{x1D6FD}w\frac{\unicode[STIX]{x2202}}{\unicode[STIX]{x2202}z}U_{base}=0, & \displaystyle\end{eqnarray}$$
where
 $\tilde{\unicode[STIX]{x1D701}}$
is scaled by
 $Re_{\unicode[STIX]{x1D6FF}}/2$
:
 $$\begin{eqnarray}\tilde{\unicode[STIX]{x1D701}}=\frac{2}{Re_{\unicode[STIX]{x1D6FF}}}\unicode[STIX]{x1D701}(z,t).\end{eqnarray}$$
Equation (3.1) corresponds to slow viscous damping of
 $w$
, as also the homogeneous part of (3.2) for
 $\tilde{\unicode[STIX]{x1D701}}$
. On the other hand, the second term in (3.2) represents a forcing term, which varies on the temporal scale of the outer flow. Therefore, streamwise streaks display temporal variations on the time scale of the outer flow. As for steady flows (Gustavsson Reference Gustavsson1991; Schmid & Henningson Reference Schmid and Henningson2001), the energy
 $E_{\unicode[STIX]{x1D701}}$
is proportional to the square of the Reynolds number for the present unsteady flow:
 $$\begin{eqnarray}E_{\unicode[STIX]{x1D701}}\propto Re_{\unicode[STIX]{x1D6FF}}^{2}.\end{eqnarray}$$
For large Reynolds numbers,
 $E_{\unicode[STIX]{x1D701}}$
will dominate. Therefore, the maximum amplification
 $G$
for streamwise streaks is expected to behave as
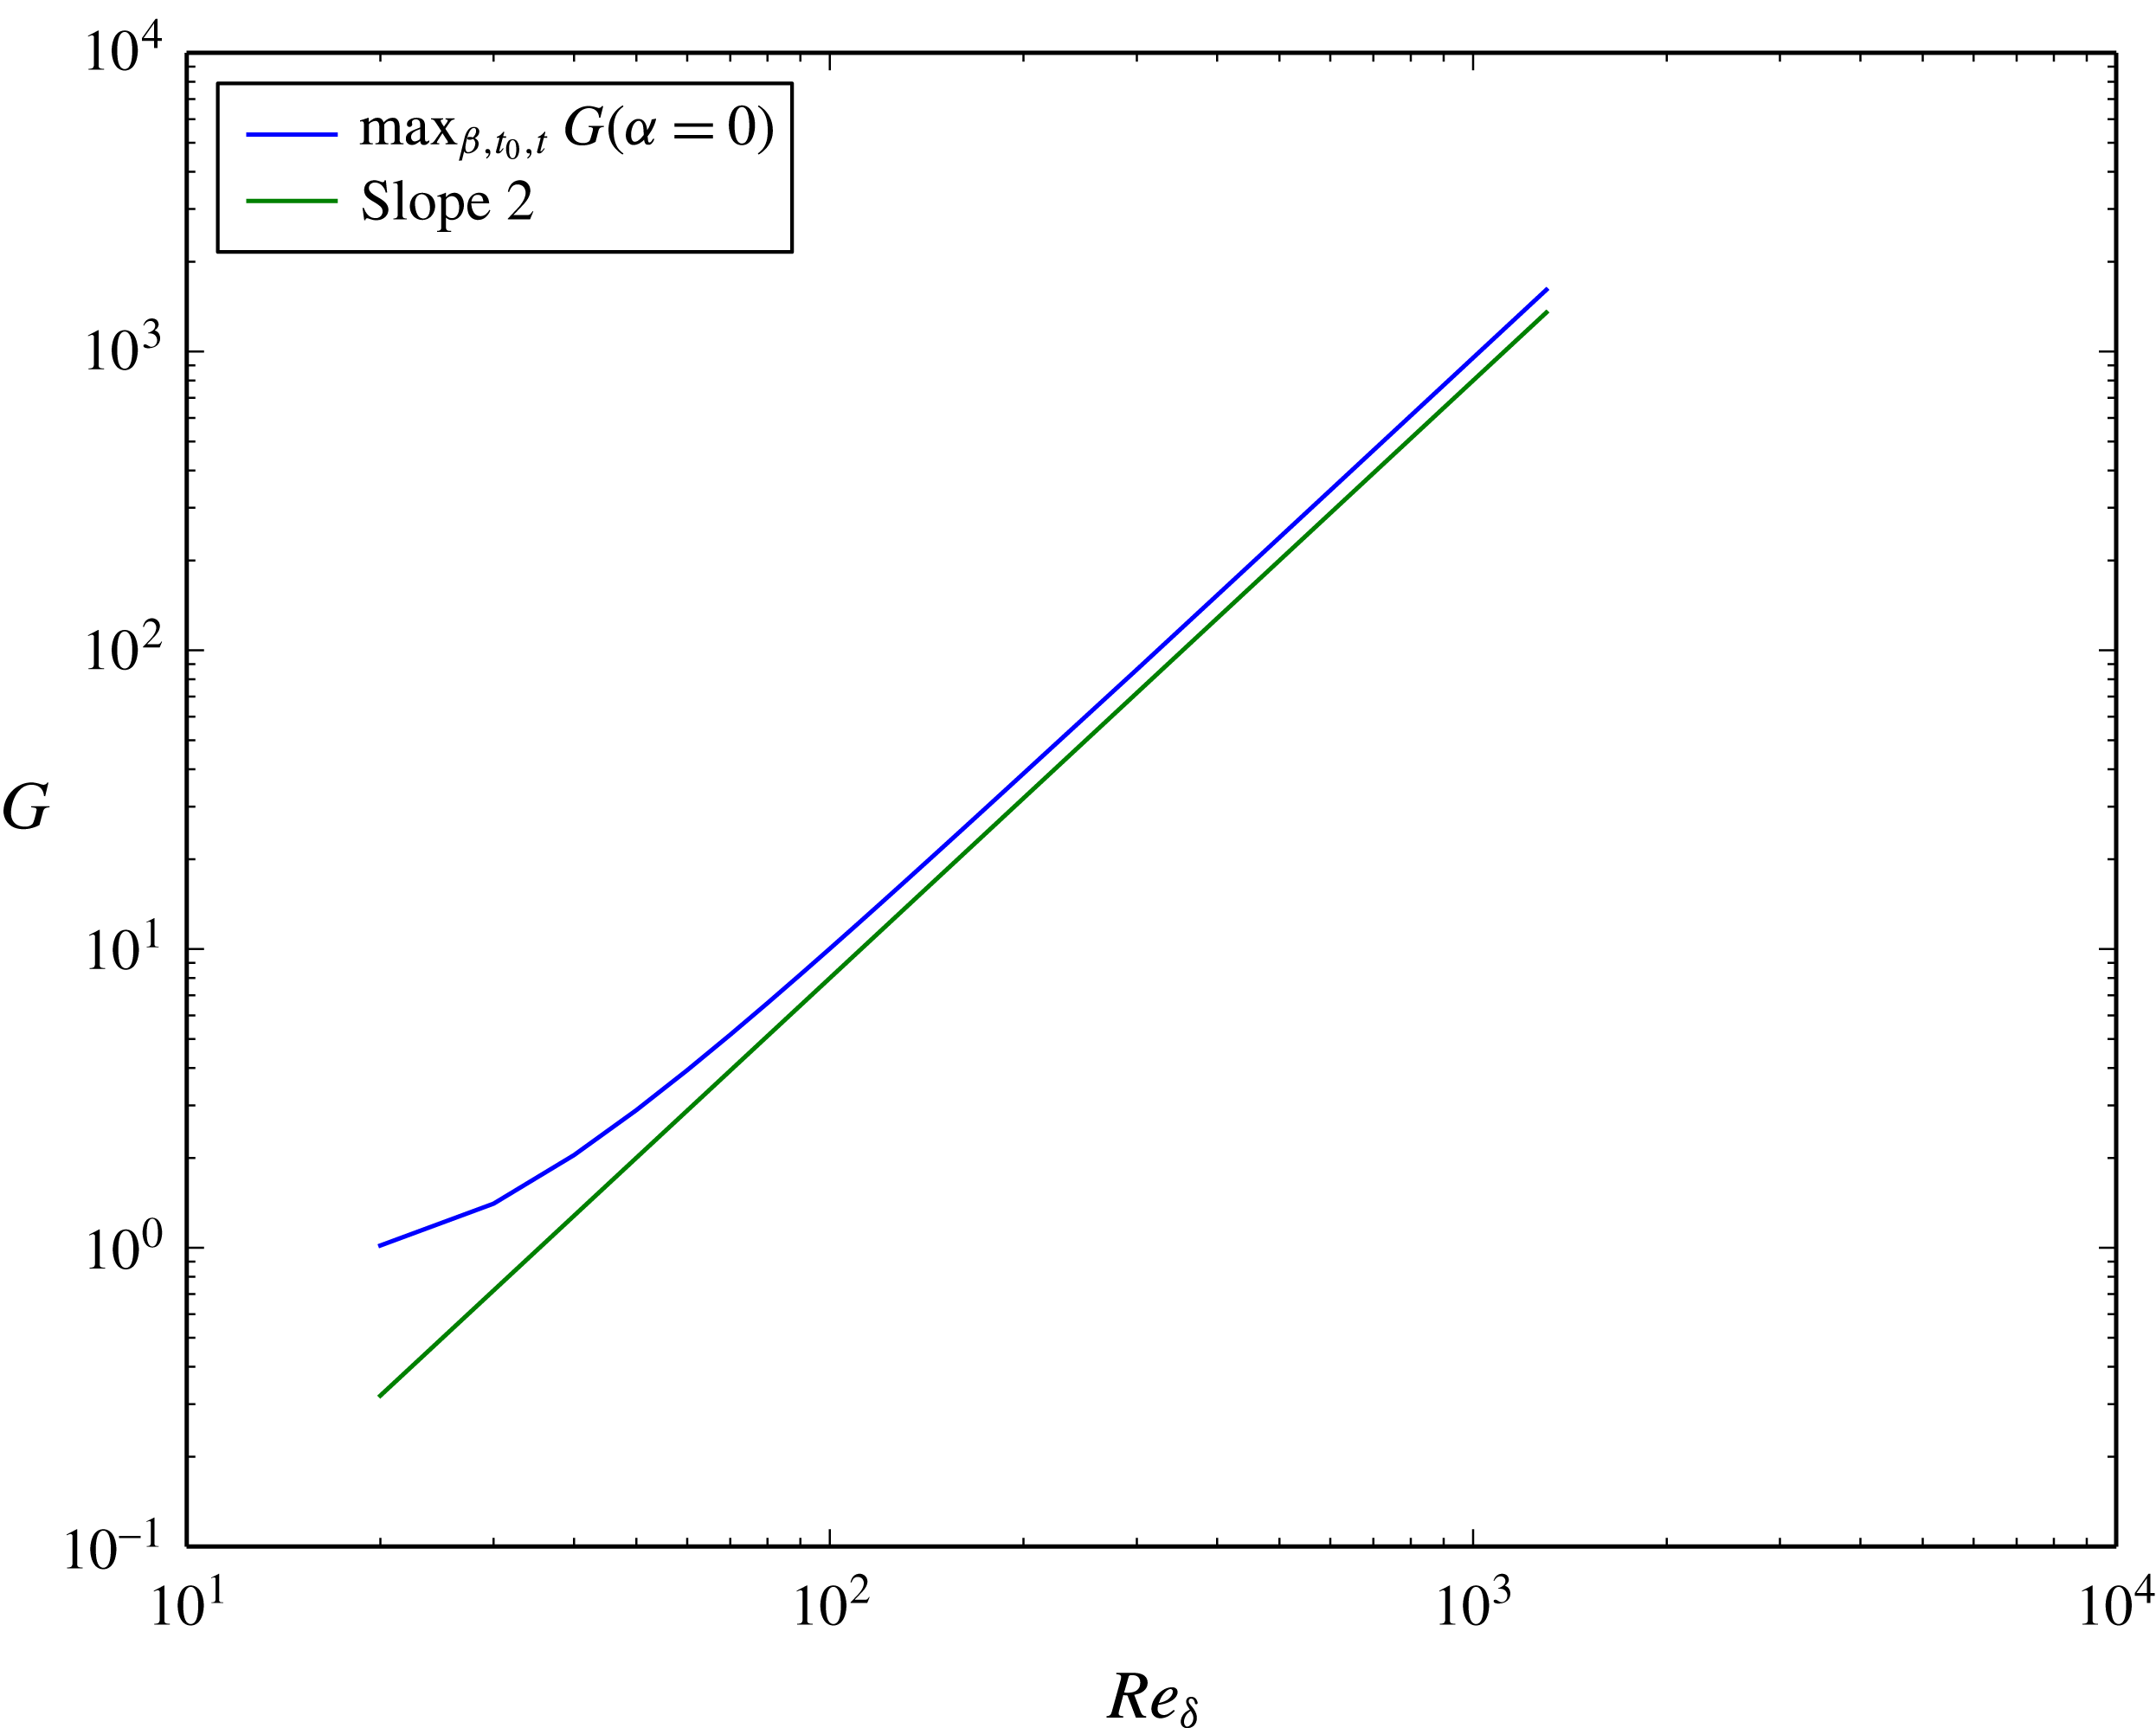
 $$\begin{eqnarray}\max _{\unicode[STIX]{x1D6FD},t_{0},t}G(\unicode[STIX]{x1D6FC}=0,\unicode[STIX]{x1D6FD},t_{0},t,Re_{\unicode[STIX]{x1D6FF}})\approx Re_{\unicode[STIX]{x1D6FF}}^{2},\quad Re_{\unicode[STIX]{x1D6FF}}\gg 1.\end{eqnarray}$$
This quadratic growth of streamwise streaks can be contrasted to the exponential growth of
 $E_{w}$
for perturbations with
 $\unicode[STIX]{x1D6FC}>0$
, as we shall see in the following. To this end, we use a decomposition (or integrating factor) as in the parabolized stability equation (Bertolotti, Herbert & Spalart Reference Bertolotti, Herbert and Spalart1992) for the normal velocity component
 $w$
:
 $$\begin{eqnarray}w=\tilde{w}(z,t)\exp \left(\int _{t_{0}}^{t}\unicode[STIX]{x1D714}(t^{\prime })\,\text{d}t^{\prime }\right),\end{eqnarray}$$
where the imaginary part of
 $\unicode[STIX]{x1D714}$
accounts for the oscillatory character of
 $w$
and the real part of
 $\unicode[STIX]{x1D714}$
is the growth rate of the perturbation. In order to define the shape function
 $\tilde{w}$
unequivocally, all growth is restricted to
 $\unicode[STIX]{x1D714}$
. Somewhat different to Bertolotti et al. (Reference Bertolotti, Herbert and Spalart1992), we define the normalization condition on the entire kinetic energy
 $\tilde{E}$
of the shape function
 $\tilde{w}$
:
 $$\begin{eqnarray}\tilde{E}=\frac{1}{2}\int _{0}^{\infty }\frac{1}{k^{2}}|\text{D}\tilde{w}|^{2}+|\tilde{w}|^{2}\,\text{d}z,\end{eqnarray}$$
where we have written
 $\text{D}=\unicode[STIX]{x2202}/\unicode[STIX]{x2202}z$
. Thus, the normalization constraint on
 $\tilde{w}$
is given by the following two conditions:
 $$\begin{eqnarray}\int _{0}^{\infty }\frac{\unicode[STIX]{x2202}\tilde{w}^{\dagger }}{\unicode[STIX]{x2202}t}{\mathcal{L}}\tilde{w}\,\text{d}z=\int _{0}^{\infty }\tilde{w}^{\dagger }{\mathcal{L}}\frac{\unicode[STIX]{x2202}\tilde{w}}{\unicode[STIX]{x2202}t}\,\text{d}z=0.\end{eqnarray}$$
From this, it follows that we can define the energy of the shape function to be unity for all times:
 $$\begin{eqnarray}\frac{\unicode[STIX]{x2202}}{\unicode[STIX]{x2202}t}\int _{0}^{\infty }\tilde{w}^{\dagger }{\mathcal{L}}\tilde{w}\,\text{d}z=0\quad \text{or}\quad \tilde{E}=-\frac{1}{2k^{2}}\int _{0}^{\infty }\tilde{w}^{\dagger }{\mathcal{L}}\tilde{w}\,\text{d}z=1.\end{eqnarray}$$
Equation (2.23) then becomes
 $$\begin{eqnarray}\unicode[STIX]{x2202}_{t}{\mathcal{L}}\tilde{w}+\unicode[STIX]{x1D714}{\mathcal{L}}\tilde{w}={\textstyle \frac{1}{2}}{\mathcal{L}}^{2}\tilde{w}+\text{i}\unicode[STIX]{x1D6FC}{\textstyle \frac{1}{2}}Re_{\unicode[STIX]{x1D6FF}}(\text{D}^{2}U_{0}-U_{0}{\mathcal{L}})\tilde{w}.\end{eqnarray}$$
Multiplying by
 $\tilde{w}^{\dagger }$
and integrating in
 $z$
, leads to a formula for
 $\unicode[STIX]{x1D714}$
:
 $$\begin{eqnarray}\unicode[STIX]{x1D714}=-\frac{1}{4k^{2}}\int _{0}^{\infty }\tilde{w}^{\dagger }{\mathcal{L}}^{2}\tilde{w}\,\text{d}z-\frac{\text{i}\unicode[STIX]{x1D6FC}}{4k^{2}}Re_{\unicode[STIX]{x1D6FF}}\int _{0}^{\infty }\tilde{w}^{\dagger }\text{D}^{2}U_{base}\tilde{w}-\tilde{w}^{\dagger }U_{base}{\mathcal{L}}\tilde{w}\,\text{d}z.\end{eqnarray}$$
The growth rate, i.e. the real part of
 $\unicode[STIX]{x1D714}$
, is given by
 $$\begin{eqnarray}\unicode[STIX]{x1D714}_{r}=-\frac{1}{4k^{2}}\int _{0}^{\infty }{\mathcal{L}}\tilde{w}^{\dagger }{\mathcal{L}}\tilde{w}\,\text{d}z+Re_{\unicode[STIX]{x1D6FF}}\frac{\unicode[STIX]{x1D6FC}}{4k^{2}}\int _{0}^{\infty }\text{D}U_{base}\{\tilde{w}_{r}\text{D}\tilde{w}_{i}-\tilde{w}_{i}\text{D}\tilde{w}_{r}\}\,\text{d}z.\end{eqnarray}$$
The first term on the right-hand side represents viscous dissipation and is always negative. The second term, however, can, depending on
 $U_{base}$
and
 $\tilde{w}$
, be positive or negative. Only when this term is positive and larger in magnitude than the viscous dissipation can growth of
 $E_{w}$
be observed. We observe that this term is multiplied by
 $\unicode[STIX]{x1D6FC}/(\unicode[STIX]{x1D6FC}^{2}+\unicode[STIX]{x1D6FD}^{2})$
, which for a given
 $\unicode[STIX]{x1D6FC}$
is maximal for
 $\unicode[STIX]{x1D6FD}=0$
. This indicates that the possible growth rate for two-dimensional perturbations is larger than that for oblique perturbations when considering exponential growth in
 $E_{w}$
and neglecting quadratic growth in
 $E_{\unicode[STIX]{x1D701}}$
. We shall return to this point when discussing the numerical results. For the decomposition in (3.6), the continuity equation can be written as
 $$\begin{eqnarray}\text{i}\unicode[STIX]{x1D6FC}\tilde{u} +\text{i}\unicode[STIX]{x1D6FD}\tilde{v}=-\text{D}\tilde{w},\end{eqnarray}$$
where we have normalized the horizontal velocities:
 $$\begin{eqnarray}\tilde{u} =u\exp \left(-\int _{t_{0}}^{t}\unicode[STIX]{x1D714}\,\text{d}t^{\prime }\right),\quad \tilde{v}=v\exp \left(-\int _{t_{0}}^{t}\unicode[STIX]{x1D714}\,\text{d}t^{\prime }\right).\end{eqnarray}$$
Then the growth rate
 $\unicode[STIX]{x1D714}_{r}$
, equation (3.12), can be written as
 $$\begin{eqnarray}\unicode[STIX]{x1D714}_{r}=-\frac{1}{4k^{2}}\int _{0}^{\infty }|{\mathcal{L}}\tilde{w}|^{2}\,\text{d}z-\frac{Re_{\unicode[STIX]{x1D6FF}}}{4}\int _{0}^{\infty }(\tilde{u} _{k}^{\dagger },\tilde{w}^{\dagger })\,\unicode[STIX]{x1D64E}_{k}\left(\begin{array}{@{}c@{}}\tilde{u} _{k}\\ \tilde{w}\end{array}\right),\end{eqnarray}$$
where
 $\tilde{u} _{k}$
is the projection of the horizontal velocity vector onto the wavenumber vector
 $\boldsymbol{k}=(\unicode[STIX]{x1D6FC},\unicode[STIX]{x1D6FD})$
,
 $$\begin{eqnarray}\tilde{u} _{k}=\frac{1}{k}(\unicode[STIX]{x1D6FC}\tilde{u} +\unicode[STIX]{x1D6FD}\tilde{v}),\end{eqnarray}$$
and
 $\unicode[STIX]{x1D64E}_{k}$
, the two-dimensional rate-of-strain tensor of the projection of the base flow on the wavenumber vector
 $\boldsymbol{k}$
, is
 $$\begin{eqnarray}\unicode[STIX]{x1D64E}_{k}=\frac{1}{2}\left(\begin{array}{@{}cc@{}}0 & \text{D}U_{k}\\ \text{D}U_{k} & 0\end{array}\right),\quad U_{k}=\frac{1}{k}\unicode[STIX]{x1D6FC}U_{base}.\end{eqnarray}$$
When considering two-dimensional perturbations (
 $\unicode[STIX]{x1D6FD}=0$
), the growth rate
 $\unicode[STIX]{x1D714}_{r}$
simplifies to
 $$\begin{eqnarray}\unicode[STIX]{x1D714}_{r}=-\frac{1}{4\unicode[STIX]{x1D6FC}^{2}}\int _{0}^{\infty }|{\mathcal{L}}\tilde{w}|^{2}\,\text{d}z-\frac{Re_{\unicode[STIX]{x1D6FF}}}{4}\int _{0}^{\infty }(\tilde{u} ^{\dagger },\tilde{w}^{\dagger })\,\unicode[STIX]{x1D64E}_{2D}\left(\begin{array}{@{}c@{}}\tilde{u} \\ \tilde{w}\end{array}\right),\end{eqnarray}$$
where
 $\unicode[STIX]{x1D64E}_{2D}$
is the two-dimensional rate-of-strain tensor of the base flow,
 $$\begin{eqnarray}\unicode[STIX]{x1D64E}_{2D}=\frac{1}{2}\left(\begin{array}{@{}cc@{}}0 & \text{D}U_{base}\\ \text{D}U_{base} & 0\end{array}\right).\end{eqnarray}$$
In this case (i.e.
 $\unicode[STIX]{x1D6FD}=0$
), equations (2.23) and (2.24) are decoupled. As can be seen from (2.24), the normal vorticity
 $\unicode[STIX]{x1D701}$
experiences only dampening. Growth can therefore only arise in the energy
 $E_{w}$
associated with the normal velocity component
 $w$
, equation (2.25). As mentioned above, the first term on the right-hand side of (3.18) is always negative and represents the viscous dissipation stabilizing the flow. As the eigenvalues of
 $\unicode[STIX]{x1D64E}_{2D}$
are given by
 $\text{D}U_{base}/2$
and
 $-\text{D}U_{base}/2$
, the second term on the right-hand side of (3.18) can, depending on
 $\tilde{w}$
, be positive or negative. All possible growth of two-dimensional perturbations is thus due to the second term where the velocity vector
 $(\tilde{u} ,\tilde{w})^{\text{T}}$
is being tilted by the rate-of-strain tensor
 $\unicode[STIX]{x1D64E}_{2D}$
. Equation (3.18) is an illustrative formula for the Orr mechanism. The growth mechanism itself is thus always inviscid. This holds for any two-dimensional perturbation, also those being the eigenfunctions of the Orr–Sommerfeld equation, the modal Tollmien–Schlichting waves, which are commonly thought of as slow viscous instabilities (see e.g. Brandt et al.
Reference Brandt, Schlatter and Henningson2004; Jimenez Reference Jimenez2013). Whether growth of two-dimensional perturbations is fast or slow is, as formula (3.18) suggests, primarily a property of the base flow profile
 $U_{base}$
. As we shall see below, velocity profiles having an inflection point allow for larger growth rates than profiles without.
As the Reynolds number multiplies the second term in (3.18), we can conclude that, for large
 $Re_{\unicode[STIX]{x1D6FF}}$
, the maximum amplification of two-dimensional perturbations roughly behaves like
 $$\begin{eqnarray}\max _{\unicode[STIX]{x1D6FC},t_{0},t}G(\unicode[STIX]{x1D6FC},\unicode[STIX]{x1D6FD}=0,t_{0},t,Re_{\unicode[STIX]{x1D6FF}})\approx \text{e}^{cRe_{\unicode[STIX]{x1D6FF}}},\quad Re_{\unicode[STIX]{x1D6FF}}\gg 1,\end{eqnarray}$$
where
 $c$
is some constant. This exponential growth of the maximum amplification with the Reynolds number has also been observed for other flows displaying an adverse pressure gradient. For example, Biau (Reference Biau2016) observed that the maximum amplification of two-dimensional perturbations for Stokes’ second problem grows exponentially with the Reynolds number.
In the following, we shall see that the competition of the maximum amplification between the quadratic growth in
 $Re_{\unicode[STIX]{x1D6FF}}$
of streamwise streaks, equation (3.5), and the exponential growth in
 $Re_{\unicode[STIX]{x1D6FF}}$
of two-dimensional structures, equation (3.20), composes the essential primary instability mechanism of this flow.
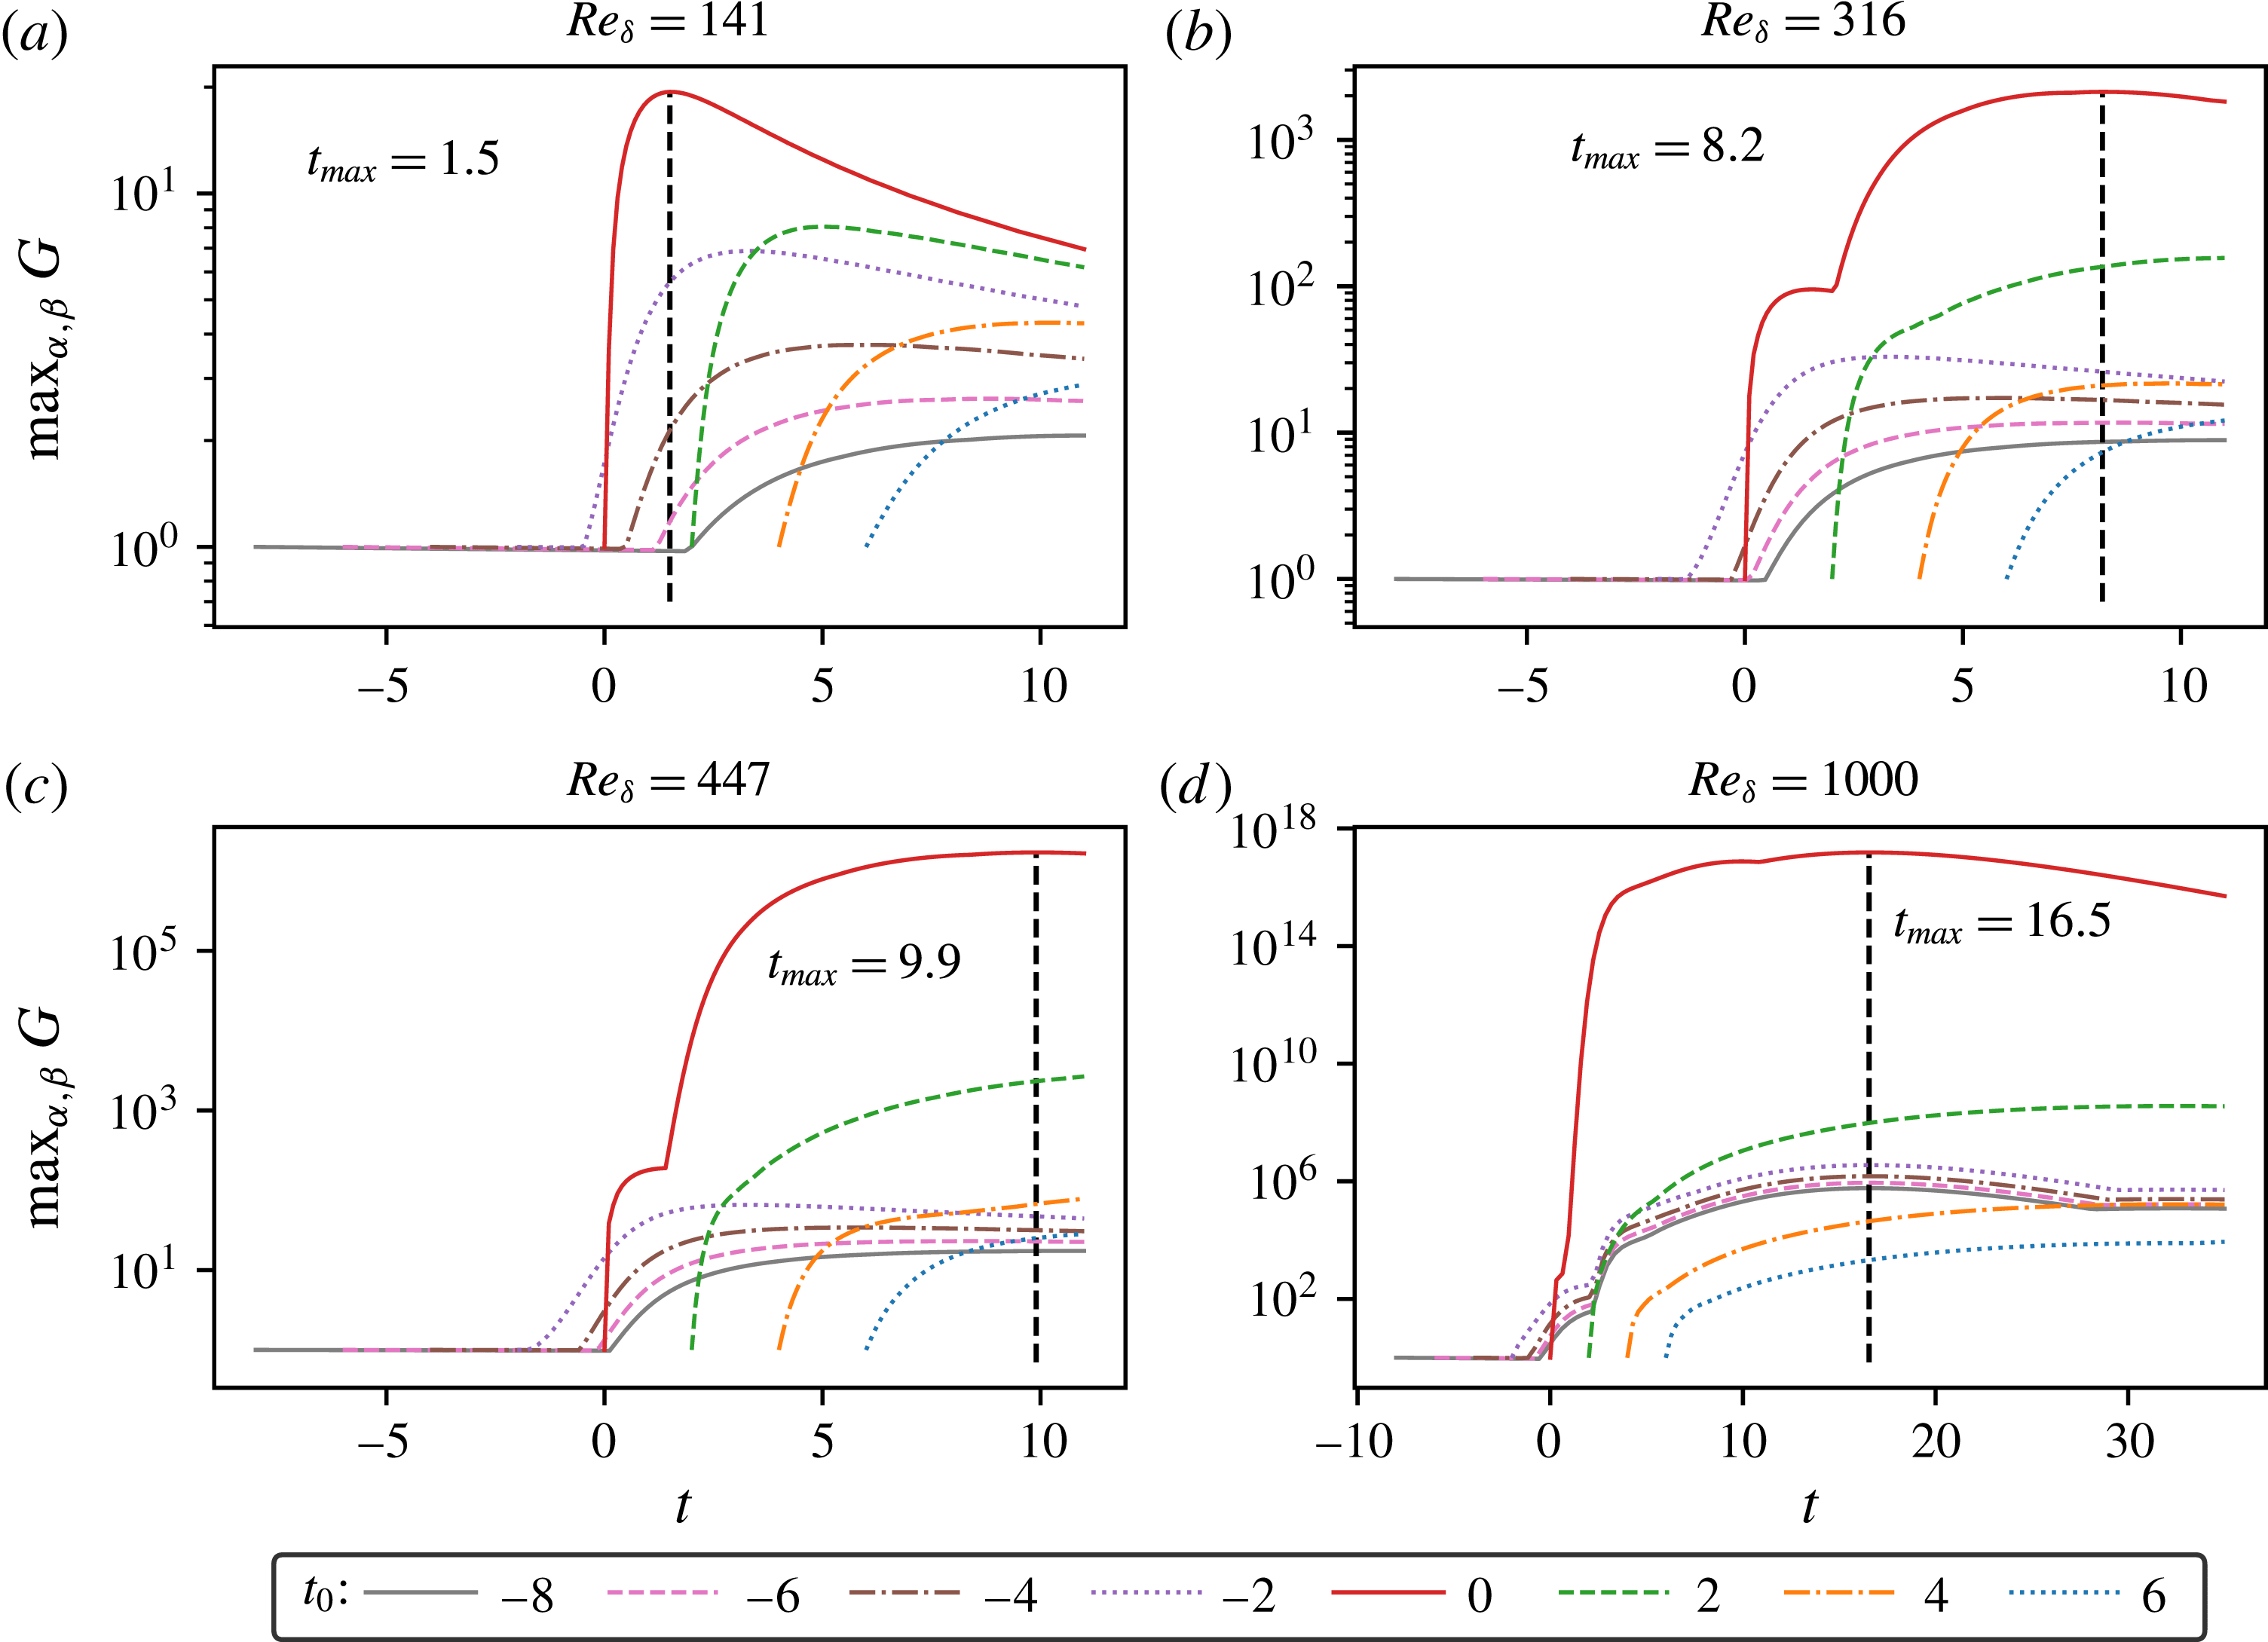
Temporal evolution of the amplification
 $G$
maximized over the wavenumbers
 $\unicode[STIX]{x1D6FC}$
and
 $\unicode[STIX]{x1D6FD}$
for different Reynolds numbers
 $Re_{\unicode[STIX]{x1D6FF}}$
and initial times
 $t_{0}$
.

3.2.2 Numerical results
The amplification
 $G$
, equation (2.26), for the present flow problem depends on five parameters: the wavenumbers
 $\unicode[STIX]{x1D6FC}$
and
 $\unicode[STIX]{x1D6FD}$
, the initial time
 $t_{0}$
, the time
 $t$
and the Reynolds number
 $Re_{\unicode[STIX]{x1D6FF}}$
. We start our numerical analysis by tracing the evolution of
 $\max _{\unicode[STIX]{x1D6FC},\unicode[STIX]{x1D6FD}}G$
for a given Reynolds number
 $Re_{\unicode[STIX]{x1D6FF}}$
and a given initial time
 $t_{0}$
. In figure 3, we plot the temporal evolution of
 $\max _{\unicode[STIX]{x1D6FC},\unicode[STIX]{x1D6FD}}G$
for the Reynolds numbers
 $Re_{\unicode[STIX]{x1D6FF}}=141,316,447$
and
 $1000$
(
 $Re_{Sumer}=10^{4},5\times 10^{4},10^{5},5\times 10^{5}$
) and initial times
 $t_{0}=-8,-6,\ldots ,6$
. For the case
 $Re_{\unicode[STIX]{x1D6FF}}=141$
(cf. figure 3
a), we observe that growth of perturbations is mainly restricted to the deceleration region of the flow, i.e. where
 $t>0$
. Only the optimal perturbation starting at
 $t_{0}=-2$
displays some growth before the arrival of the crest of the solitary wave. Among the initial conditions
 $t_{0}$
chosen, the optimal perturbation with
 $t_{0}=0$
displays the maximum amplification at
 $t_{max}=1.5$
with
 $G\approx 20$
. This is due to the acceleration region of the flow (
 $t<0$
) having a damping effect on the perturbations starting before
 $t=0$
. On the other hand, the perturbations starting at later times
 $t_{0}\geqslant 2$
already miss out a great deal of the destabilizing effect of the adverse pressure gradient. All curves display a maximum at some time. For some cases, this maximum lies outside of the plotting domain.
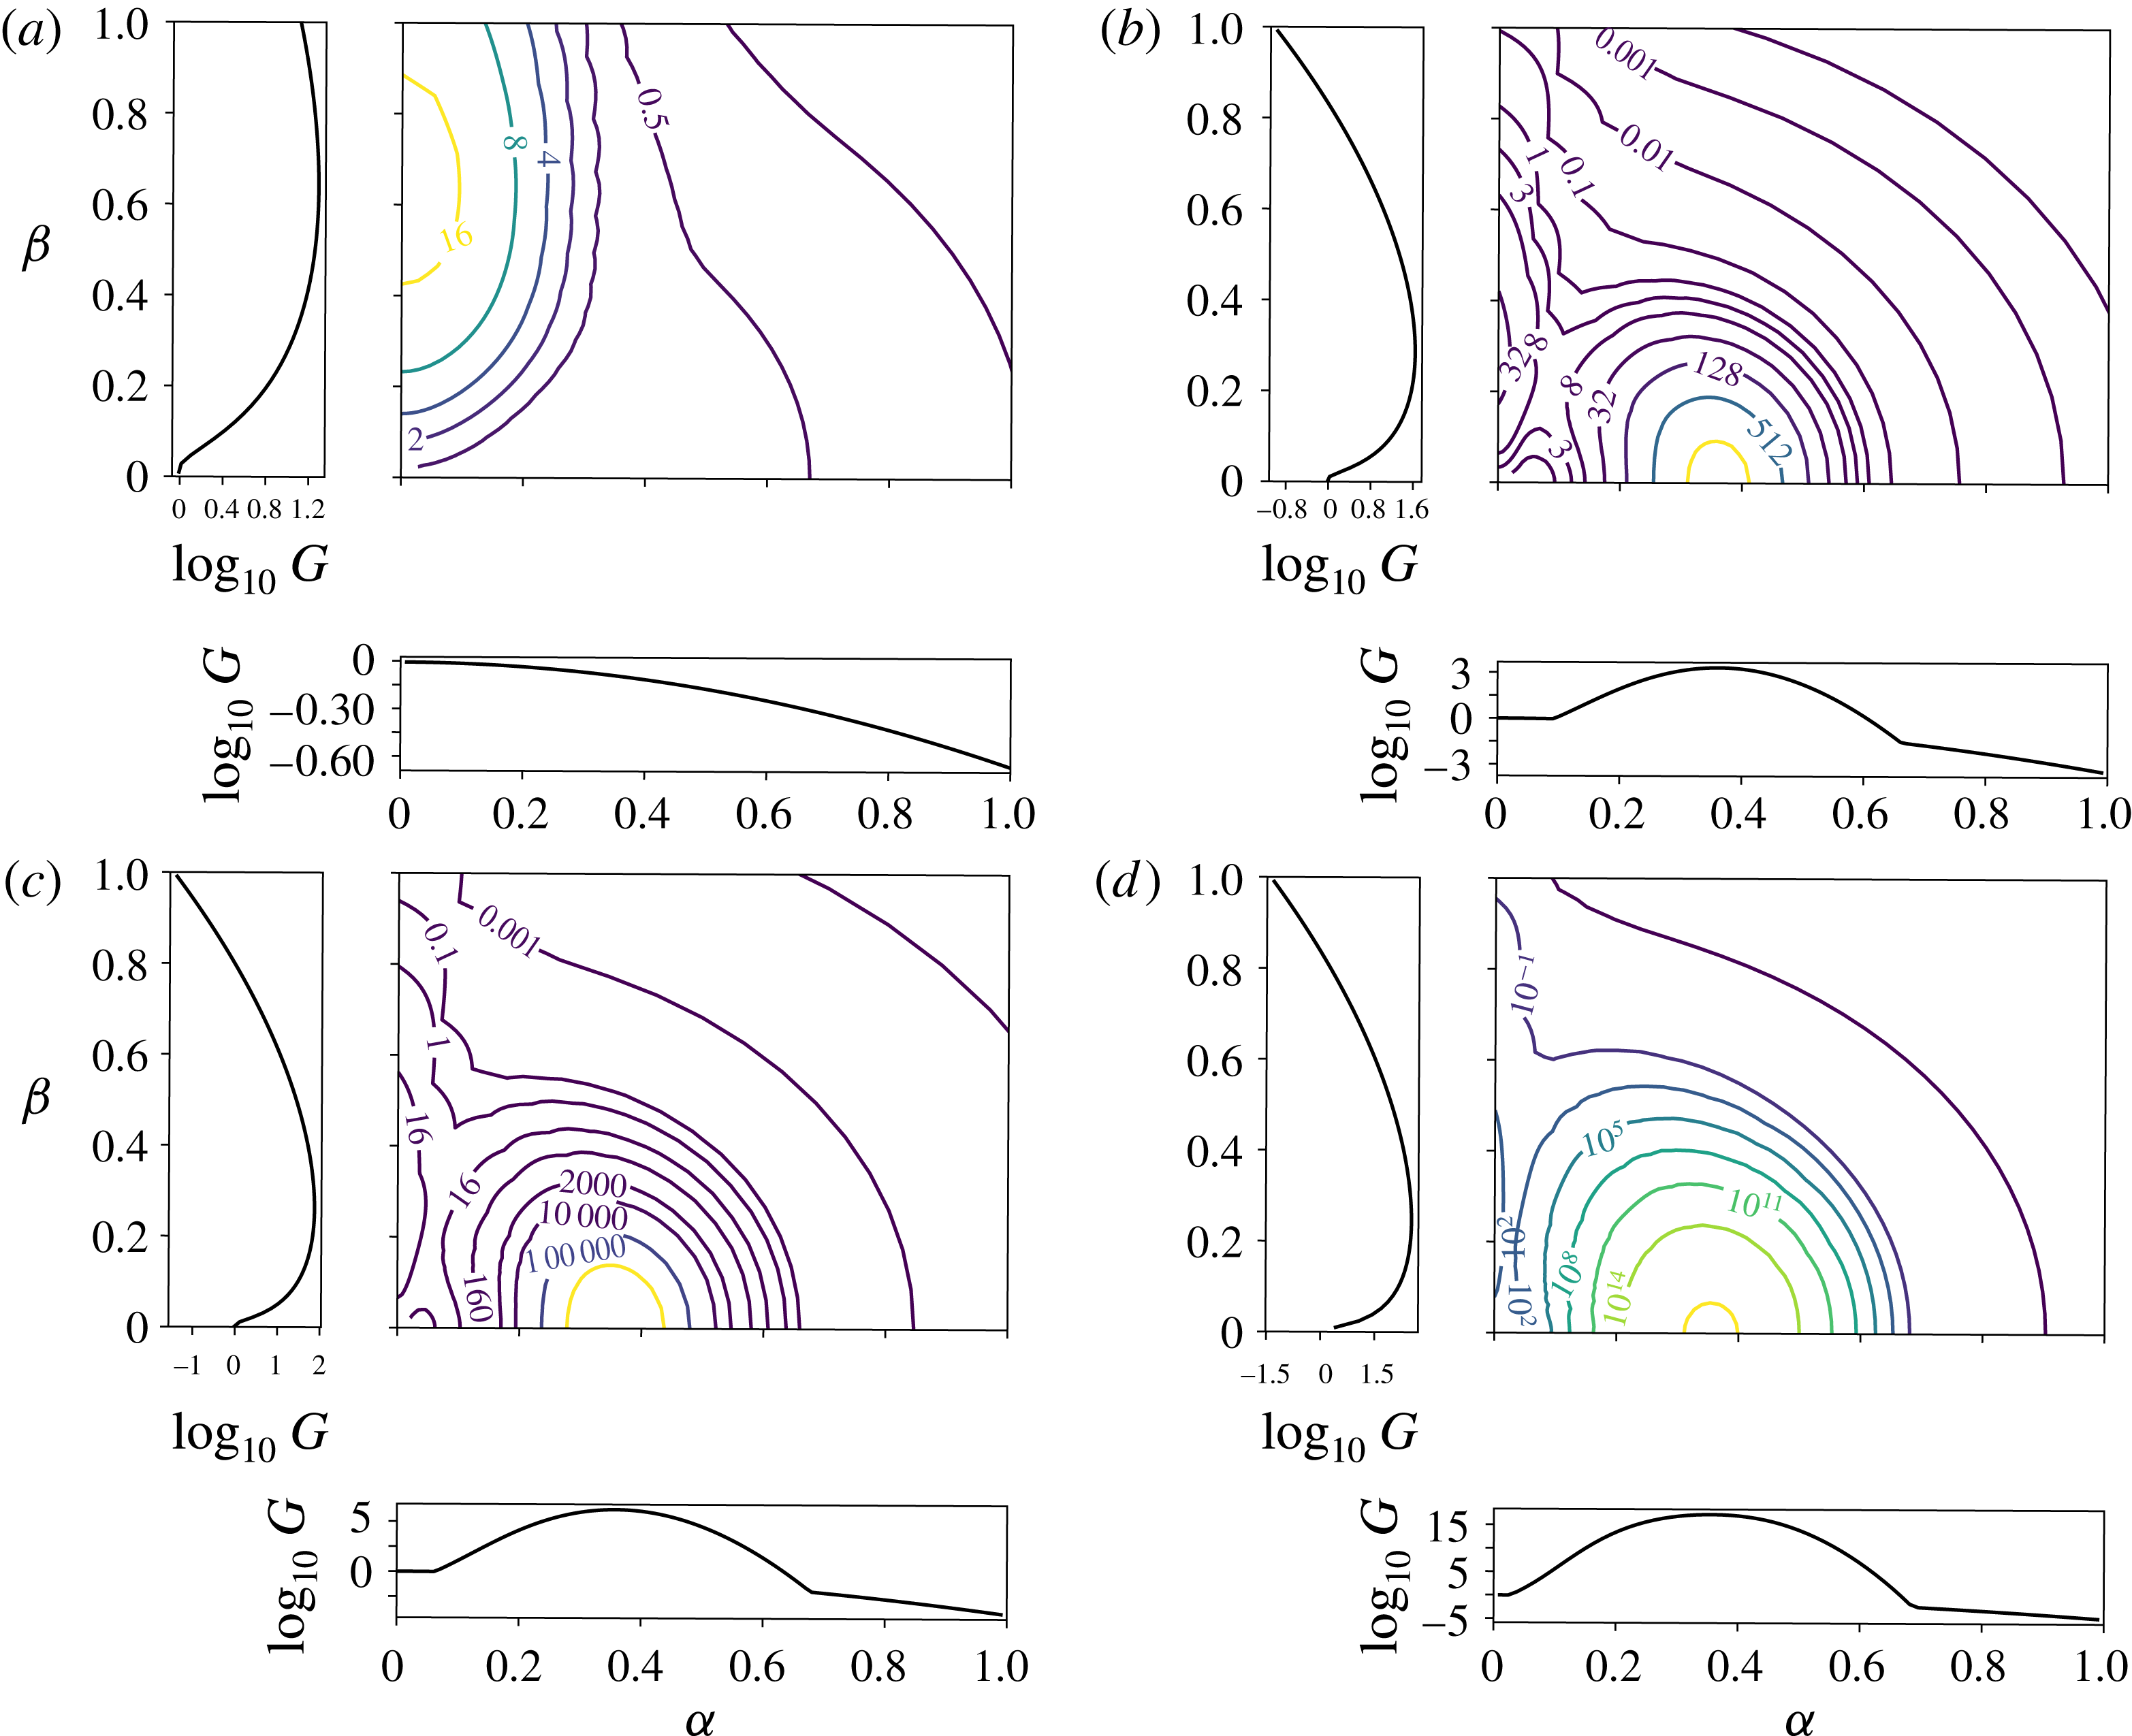
Contour plots of the amplification
 $G(\unicode[STIX]{x1D6FC},\unicode[STIX]{x1D6FD},t_{0}=0,t_{max},Re_{\unicode[STIX]{x1D6FF}})$
at
 $t_{max}=1.5,8.2,9.9,16.5$
(a–d respectively) for the cases
 $Re_{\unicode[STIX]{x1D6FF}}=141,316,447,1000$
, respectively. The plots to the left of and below the contour plot show a slice along the
 $\unicode[STIX]{x1D6FD}$
and
 $\unicode[STIX]{x1D6FC}$
axes, respectively.

For a slightly larger Reynolds number (cf. figure 3
b) with
 $Re_{\unicode[STIX]{x1D6FF}}=316$
, we observe a qualitatively similar behaviour for the perturbations starting at
 $t_{0}<0$
, with the difference being that growth of these perturbations sets in somewhat earlier in time than in the
 $Re_{\unicode[STIX]{x1D6FF}}=141$
case and leads also to higher amplifications. However, the optimal perturbation starting at
 $t_{0}=0$
behaves differently from the corresponding one for the
 $Re_{\unicode[STIX]{x1D6FF}}=141$
case. At early times, i.e. for
 $t\lesssim 2$
, the evolution of this perturbation is similar to the
 $Re_{\unicode[STIX]{x1D6FF}}=141$
case. The perturbation grows to a maximum
 $G\approx 100$
at
 $t\approx 1.5$
, before decaying again, but, at time
 $t\approx 2$
, the amplification curve displays a kink and a sudden growth to
 $G\approx 2000$
at time
 $t_{max}=8.2$
. A similar, however less expressive, kink is also visible in the curve for
 $t_{0}=2$
.
Increasing the Reynolds number to
 $Re_{\unicode[STIX]{x1D6FF}}=447$
(cf. figure 3
c) does not change the picture qualitatively. However, the maximum amplification of the optimal perturbation starting at
 $t_{0}=0$
has increased by a factor of approximately 1000 compared to the
 $Re_{\unicode[STIX]{x1D6FF}}=316$
case. In comparison, the maximum of the optimal perturbation starting at
 $t_{0}=-2$
has only increased by a factor of approximately 1.25 when going from
 $Re_{\unicode[STIX]{x1D6FF}}=316$
to
 $Re_{\unicode[STIX]{x1D6FF}}=447$
. This violent growth for the optimal perturbation starting at
 $t_{0}$
is also visible for the
 $Re_{\unicode[STIX]{x1D6FF}}=1000$
case (cf. figure 3
d). However, for this case, even the curves of the perturbations starting at earlier times display a similar kink and sudden growth in the deceleration region.
In figure 4, we show contour plots of the amplification
 $G(\unicode[STIX]{x1D6FC},\unicode[STIX]{x1D6FD},t_{0}=0,t_{max},Re_{\unicode[STIX]{x1D6FF}})$
at
 $t_{max}=1.5,~8.2,~9.9,~16.5$
for the cases
 $Re_{\unicode[STIX]{x1D6FF}}=141,~316,~447,~1000$
, respectively. For the case
 $Re_{\unicode[STIX]{x1D6FF}}=141$
(cf. figure 4
a), we find a single maximum lying on the
 $\unicode[STIX]{x1D6FD}$
axis. On the other hand, the
 $Re_{\unicode[STIX]{x1D6FF}}=316$
case is different (cf. figure 4
b). Whereas all two-dimensional perturbations display decay at
 $t_{max}=1.5$
for the
 $Re_{\unicode[STIX]{x1D6FF}}=141$
case, the amplification of two-dimensional perturbations displays a peak at around
 $\unicode[STIX]{x1D6FC}=0.35$
for the
 $Re_{\unicode[STIX]{x1D6FF}}=316$
case. A second peak, lying on the
 $\unicode[STIX]{x1D6FD}$
axis, is significantly smaller than the peak of two-dimensional perturbations on the
 $\unicode[STIX]{x1D6FC}$
axis. Increasing the Reynolds number (cf. figure 4
c,d) increases the magnitude of the peaks, with the peak on the
 $\unicode[STIX]{x1D6FC}$
axis growing faster with
 $Re_{\unicode[STIX]{x1D6FF}}$
than the peak on the
 $\unicode[STIX]{x1D6FD}$
axis. This competition between streamwise streaks and two-dimensional structures is characteristic for flows with adverse pressure gradients and has also been observed for steady flows. The Falkner–Skan boundary layer with adverse pressure gradient displays contour levels similar to the present ones (see e.g. Corbett & Bottaro Reference Corbett and Bottaro2000; Levin & Henningson Reference Levin and Henningson2003, figure 10d). Another example is the flow of three-dimensional swept boundary layers investigated in Corbett & Bottaro (Reference Corbett and Bottaro2001).
Temporal evolution of
 $\max _{\unicode[STIX]{x1D6FD}}G(\unicode[STIX]{x1D6FC}=0,\unicode[STIX]{x1D6FD},t_{0}=0,t,Re_{\unicode[STIX]{x1D6FF}}=316)$
,
 $\max _{\unicode[STIX]{x1D6FC}}G(\unicode[STIX]{x1D6FC},\unicode[STIX]{x1D6FD}=0,t_{0}=0,t,Re_{\unicode[STIX]{x1D6FF}}=316)$
and
 $\max _{\unicode[STIX]{x1D6FC},\unicode[STIX]{x1D6FD}}G(\unicode[STIX]{x1D6FC},\unicode[STIX]{x1D6FD},t_{0}=0,t,Re_{\unicode[STIX]{x1D6FF}}=316)$
.

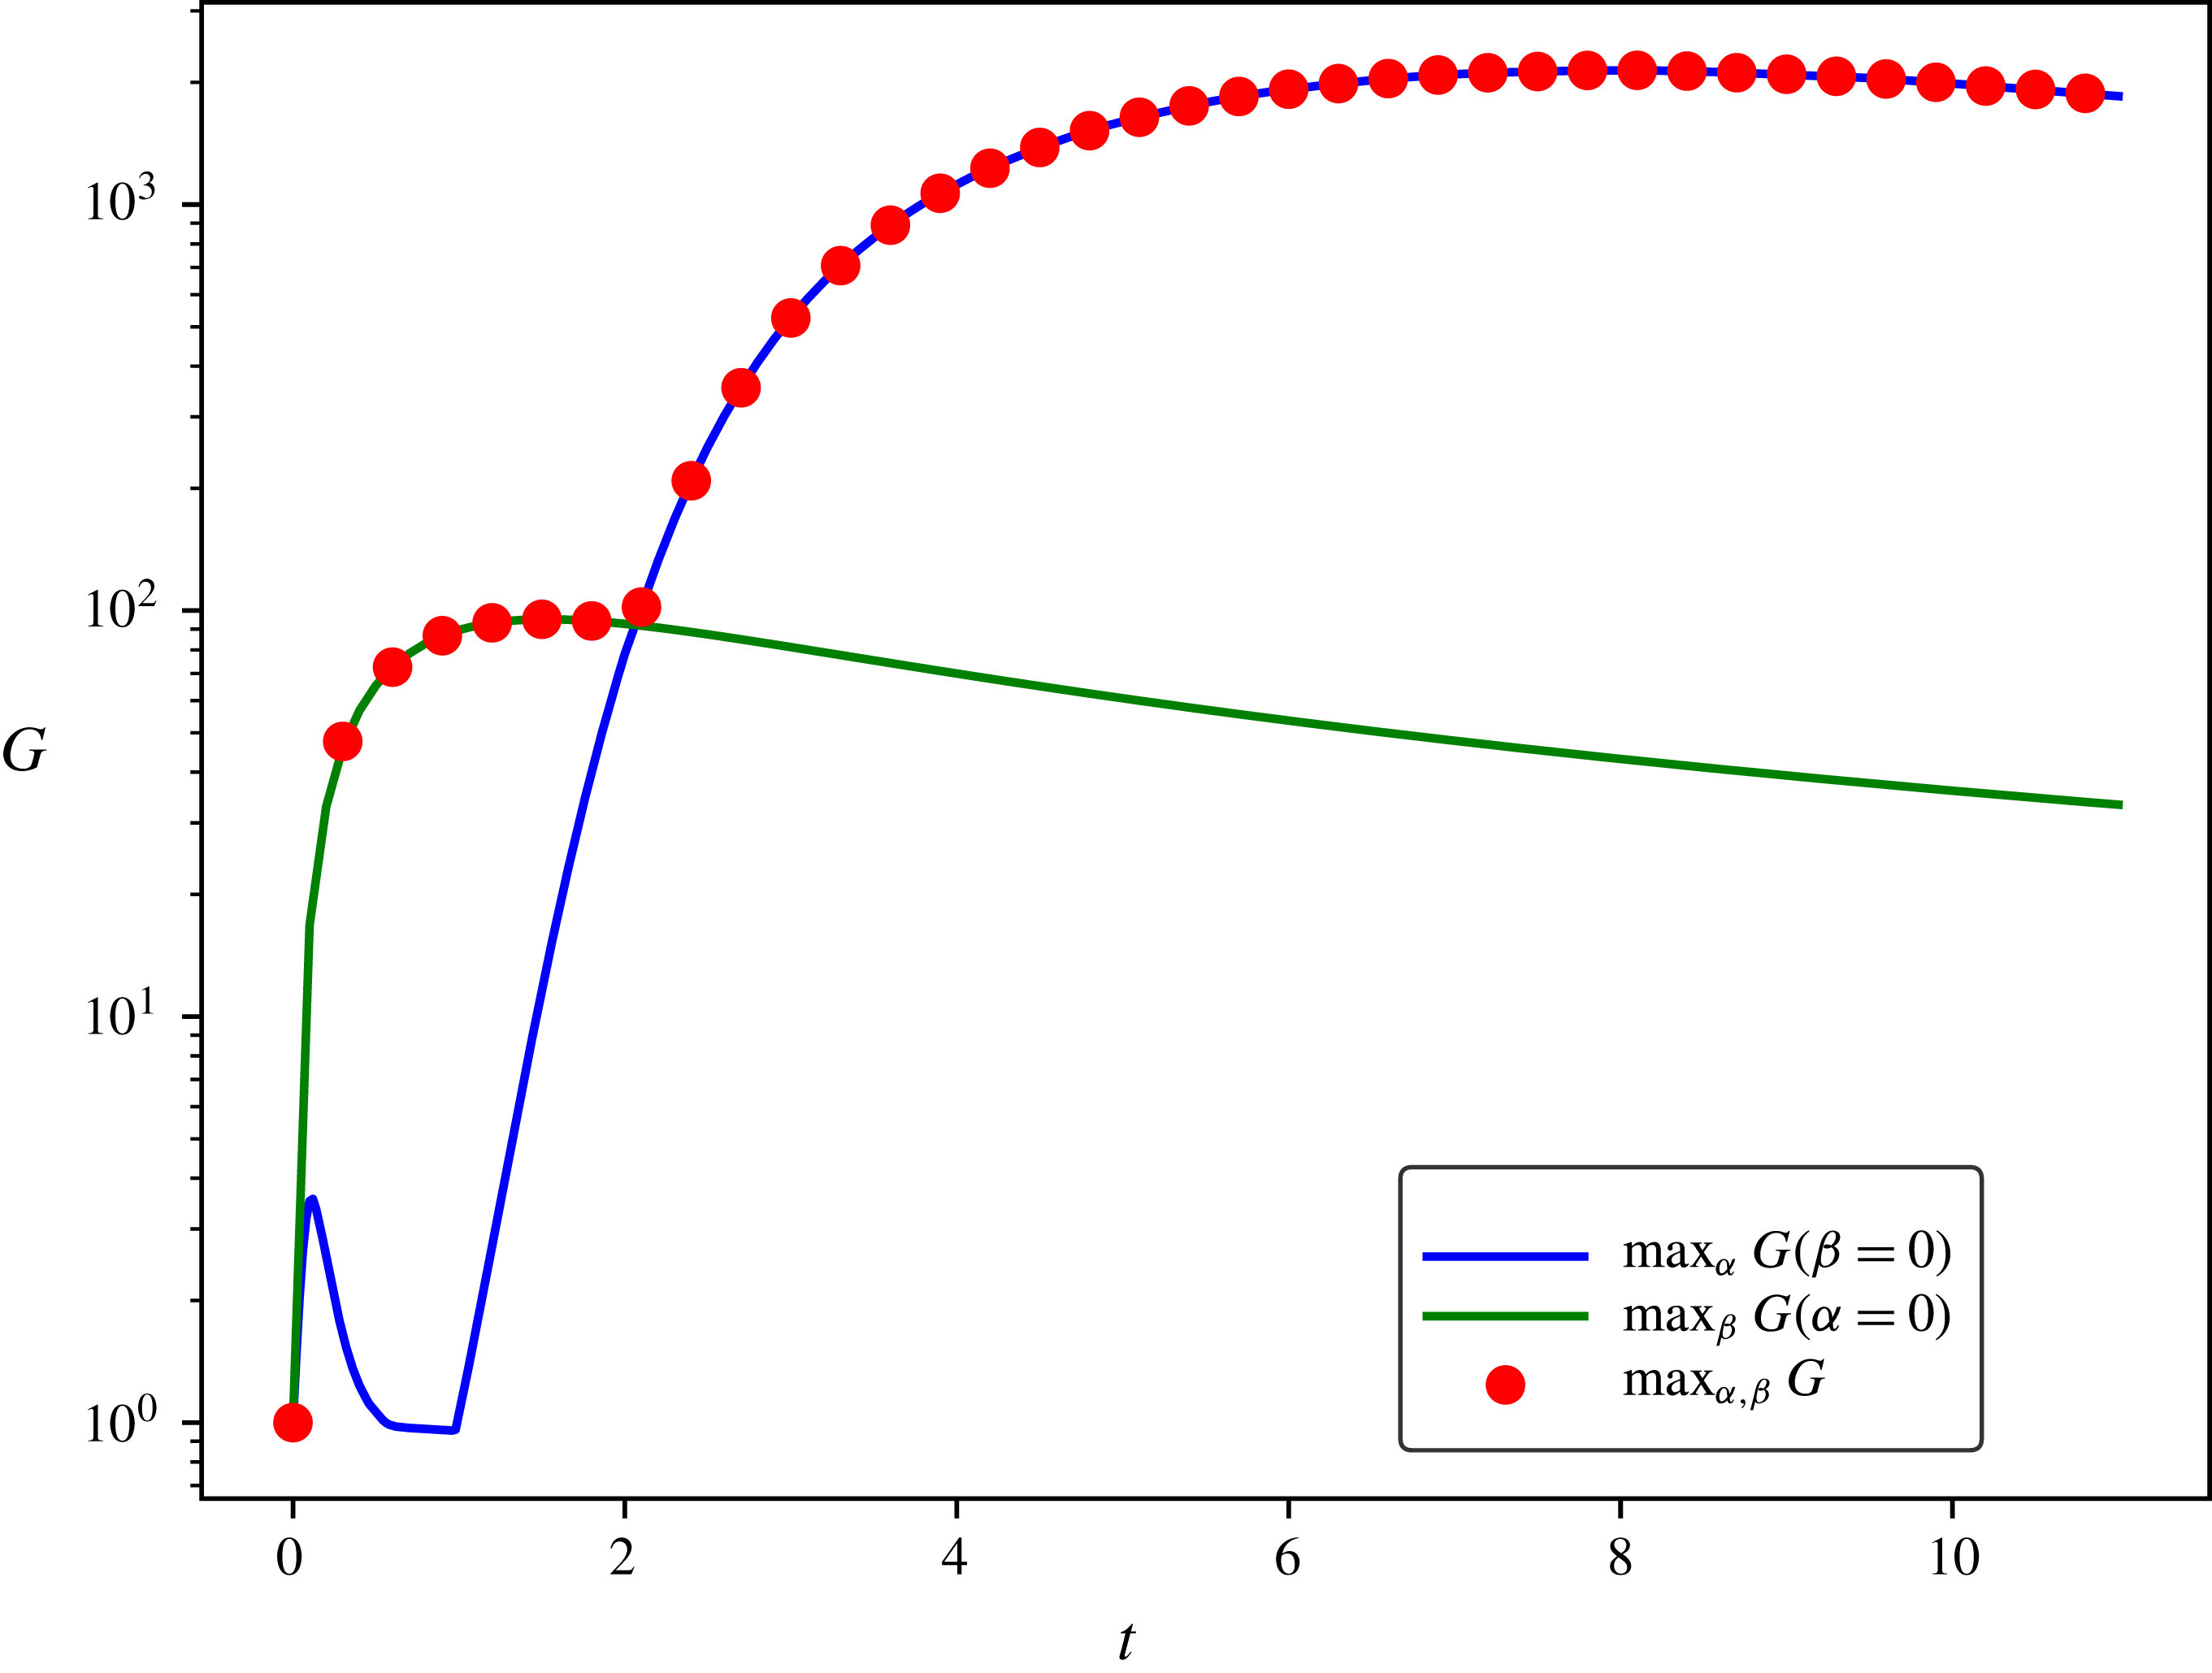
The competition between streamwise streaks and two-dimensional perturbations can also be observed in the temporal evolution of the amplification of the optimal perturbation. In figure 5, we compare the temporal evolution of
 $\max _{\unicode[STIX]{x1D6FD}}G(\unicode[STIX]{x1D6FC}=0,\unicode[STIX]{x1D6FD},t_{0}=0,t,Re_{\unicode[STIX]{x1D6FF}}=316)$
,
 $\max _{\unicode[STIX]{x1D6FC}}G(\unicode[STIX]{x1D6FC},\unicode[STIX]{x1D6FD}=0,t_{0}=0,t,Re_{\unicode[STIX]{x1D6FF}}=316)$
and
 $\max _{\unicode[STIX]{x1D6FC},\unicode[STIX]{x1D6FD}}G(\unicode[STIX]{x1D6FC},\unicode[STIX]{x1D6FD},t_{0}=0,t,Re_{\unicode[STIX]{x1D6FF}}=316)$
. For early times (
 $0<t\lesssim 2$
) the streamwise streaks display a larger amplification than the two-dimensional perturbations, but at time
 $t\approx 2$
, the two-dimensional perturbations overtake the streaks. Maximizing over
 $\unicode[STIX]{x1D6FC}$
and
 $\unicode[STIX]{x1D6FD}$
chooses either perturbation displaying maximum amplification. The amplification of oblique perturbations seems to be most often smaller than that of streamwise streaks or two-dimensional perturbations. This allows us to trace the maximum amplification
 $G_{max}$
, equation (2.27), by considering only the amplification of the cases
 $(\unicode[STIX]{x1D6FC}=0,\unicode[STIX]{x1D6FD})$
and
 $(\unicode[STIX]{x1D6FC},\unicode[STIX]{x1D6FD}=0)$
instead of maximizing over all possible wavenumbers
 $(\unicode[STIX]{x1D6FC},\unicode[STIX]{x1D6FD})$
. Growth of streamwise streaks is associated with the lift-up effect (Ellingsen & Palm Reference Ellingsen and Palm1975), whereas the growth of two-dimensional perturbations is associated with the Orr mechanism (Jimenez Reference Jimenez2013). We remark that other growth mechanisms exist, such as the Reynolds stress mechanism (cf. Butler & Farrell Reference Butler and Farrell1992), which can lead to the maximum amplification of streaks not being exactly on the
 $\unicode[STIX]{x1D6FD}$
axis, but having a non-zero
 $\unicode[STIX]{x1D6FC}$
component. However, as also shown for other flows (Butler & Farrell Reference Butler and Farrell1992), this
 $\unicode[STIX]{x1D6FC}$
component is negligibly small and therefore not considered in the present work.
Maximum amplification of streamwise streaks
 $\max _{\unicode[STIX]{x1D6FD},t_{0},t}$
 $G(\unicode[STIX]{x1D6FC}=0,\unicode[STIX]{x1D6FD},t_{0},t,Re_{\unicode[STIX]{x1D6FF}})$
and two-dimensional perturbations
 $\max _{\unicode[STIX]{x1D6FC},t_{0},t}G(\unicode[STIX]{x1D6FC},\unicode[STIX]{x1D6FD}=0,t_{0},t,Re_{\unicode[STIX]{x1D6FF}})$
.

In figure 6, the amplification of streamwise streaks and two-dimensional perturbations maximized over the initial time
 $t_{0}$
and time
 $t$
is plotted against the Reynolds number. As predicted in § 3.1 by the energy bound of Davis & von Kerczek (Reference Davis and von Kerczek1973), streamwise streaks start to grow for Reynolds numbers larger than
 $Re_{A}=18$
, whereas two-dimensional perturbations start growing for
 $Re_{B}>38$
. We can define a third critical Reynolds number
 $Re_{C}=170$
for this flow, which stands for the value when the maximum amplification of two-dimensional perturbations overtakes the maximum amplification of streamwise streaks. This happens for rather low levels of amplification, the maximum amplification being
 $G_{max}=28$
for
 $Re_{\unicode[STIX]{x1D6FF}}=170$
. As in Biau (Reference Biau2016) for Stokes’ second problem, the amplification of two-dimensional perturbations is observed to be exponential. For flows with a Reynolds number larger than
 $Re_{C}$
, which are the most relevant cases, the dominant perturbations are therefore likely to be two-dimensional (up to secondary instability). This supports the observation by Vittori & Blondeaux (Reference Vittori and Blondeaux2008) and Özdemir et al. (Reference Özdemir, Hsu and Balachandar2013) of a transition process via the development of two-dimensional vortex rollers. However, when starting early, i.e. for initial times
 $t_{0}<-1$
, streamwise streaks start growing before two-dimensional structures, as can be seen in figure 3(d). The competition between streamwise streaks and two-dimensional structures to first reach secondary instability might therefore be determined not only by the maximum amplification reached, but also by the point in time at which the amplification of the perturbation is sufficient to trigger secondary instability, be it streaks or two-dimensional perturbations. We shall discuss this point further in § 4.
Maximum amplification of streamwise streaks,
 $\max _{\unicode[STIX]{x1D6FD},t_{0},t}G(\unicode[STIX]{x1D6FC}=0,\unicode[STIX]{x1D6FD},t_{0},t,Re_{\unicode[STIX]{x1D6FF}})$
, versus Reynolds number.

When plotting the maximum amplification of streamwise streaks in a log–log plot (cf. figure 7), we find the expected quadratic behaviour of the maximum amplification. In line with this quadratic growth in
 $Re_{\unicode[STIX]{x1D6FF}}$
, a straightforward calculation (cf. appendix B) shows that, when normalizing the energy
 $E=E_{w}+E_{\unicode[STIX]{x1D701}}$
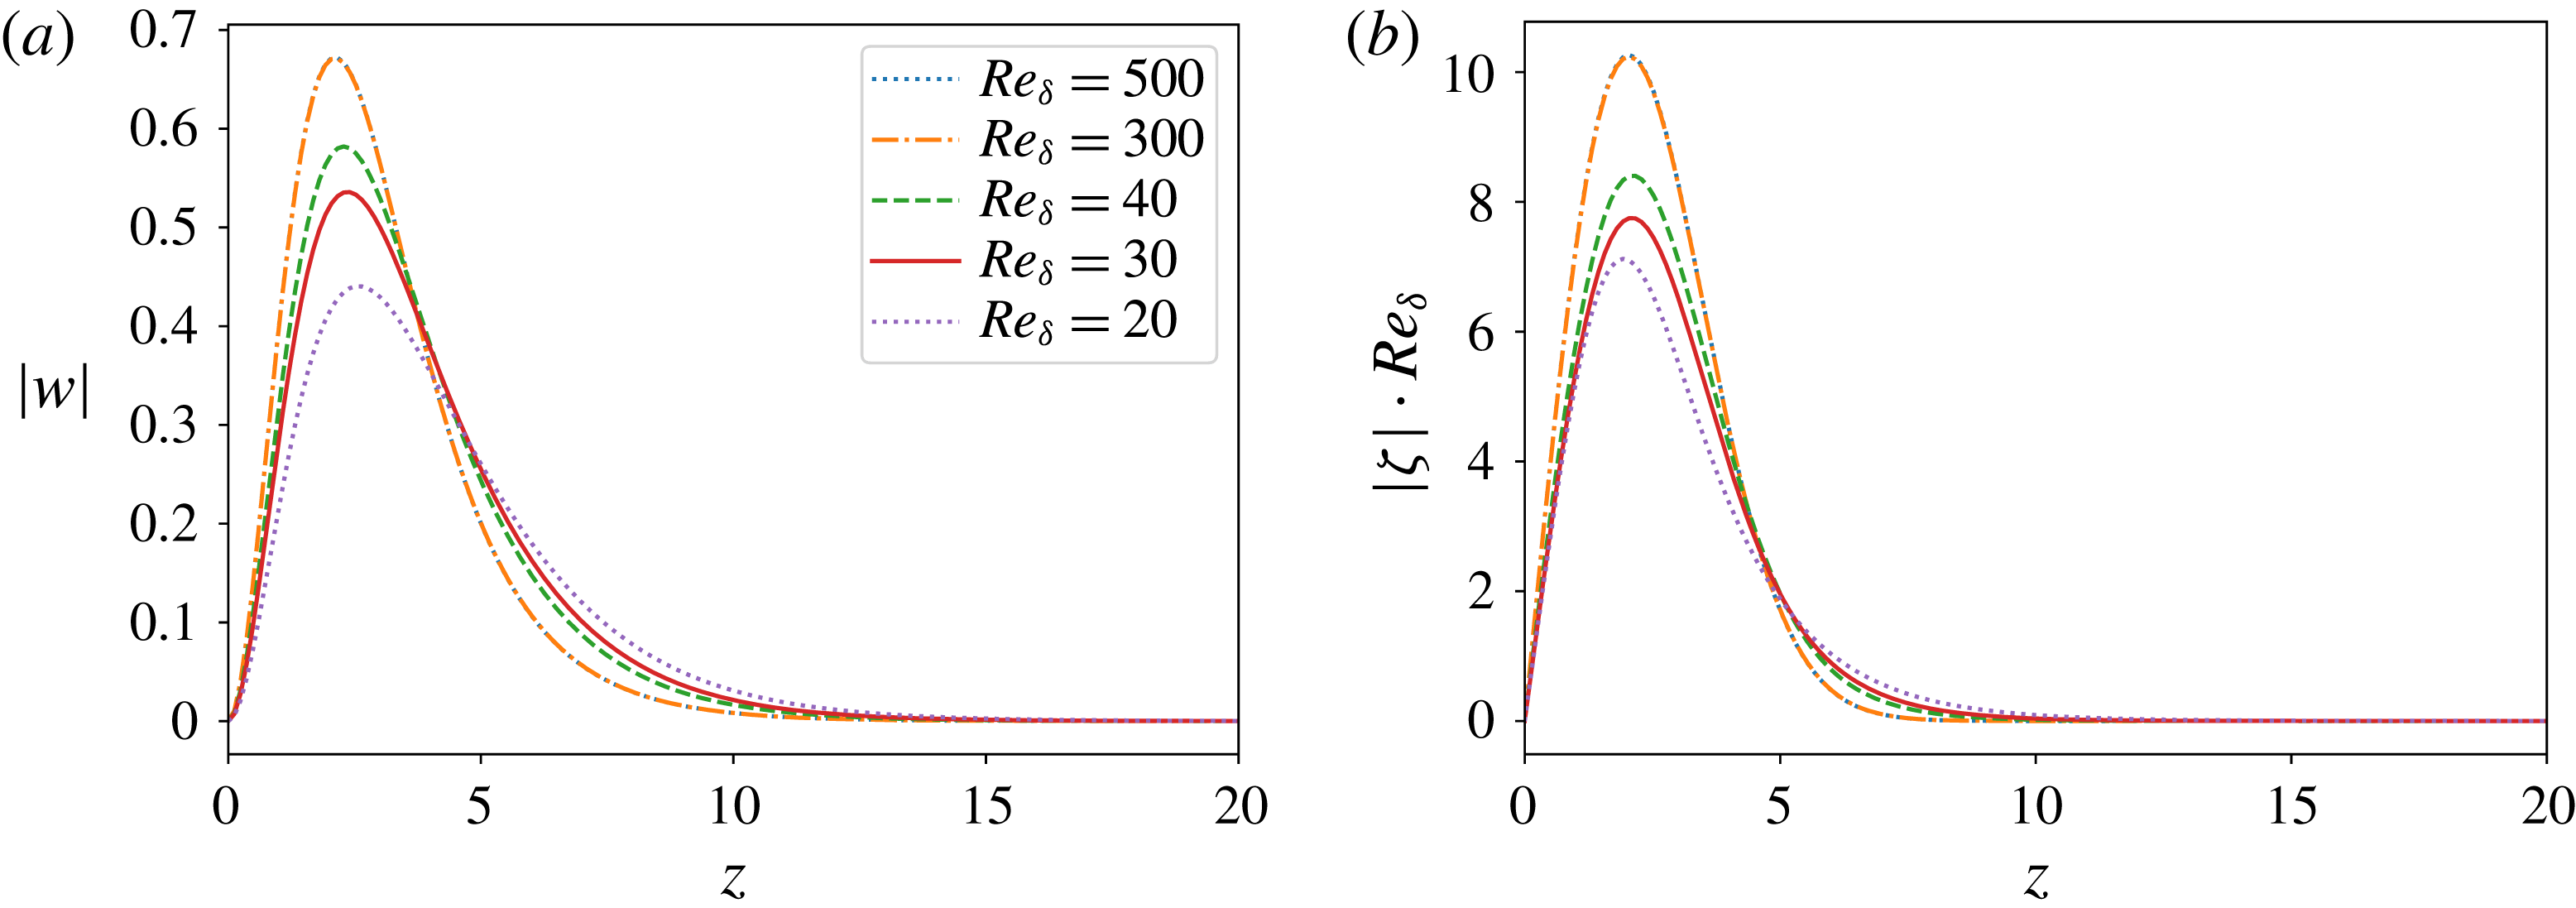
, equation (2.25), of the initial condition of the optimal streamwise streak to unity, the amplitude of the initial normal vorticity scales inversely with the Reynolds number, whereas the amplitude of the normal velocity converges to a constant in the asymptotic limit:
 $$\begin{eqnarray}\max _{z}\unicode[STIX]{x1D701}(z,t_{0})\propto \frac{1}{Re_{\unicode[STIX]{x1D6FF}}},\quad \max _{z}w(z,t_{0})\propto \text{const.}\quad \text{for }Re_{\unicode[STIX]{x1D6FF}}\rightarrow \infty .\end{eqnarray}$$
This can also be observed in figure 8, where we show that, for larger Reynolds numbers, the graphs of
 $|\unicode[STIX]{x1D701}|Re_{\unicode[STIX]{x1D6FF}}$
and
 $|w|$
collapse. In order to visualize the spatial structure of the optimal streamwise streak, we consider the case
 $Re_{\unicode[STIX]{x1D6FF}}=500$
with a maximum amplification of
 $$\begin{eqnarray}\max _{\unicode[STIX]{x1D6FD},t_{0},t}G(\unicode[STIX]{x1D6FC}=0,\unicode[STIX]{x1D6FD},t_{0},t,Re_{\unicode[STIX]{x1D6FF}}=500)=238.6,\end{eqnarray}$$
where the parameters at maximum are given by
 $$\begin{eqnarray}\unicode[STIX]{x1D6FD}=0.64,\quad t_{0}=0.11,\quad t=1.53.\end{eqnarray}$$
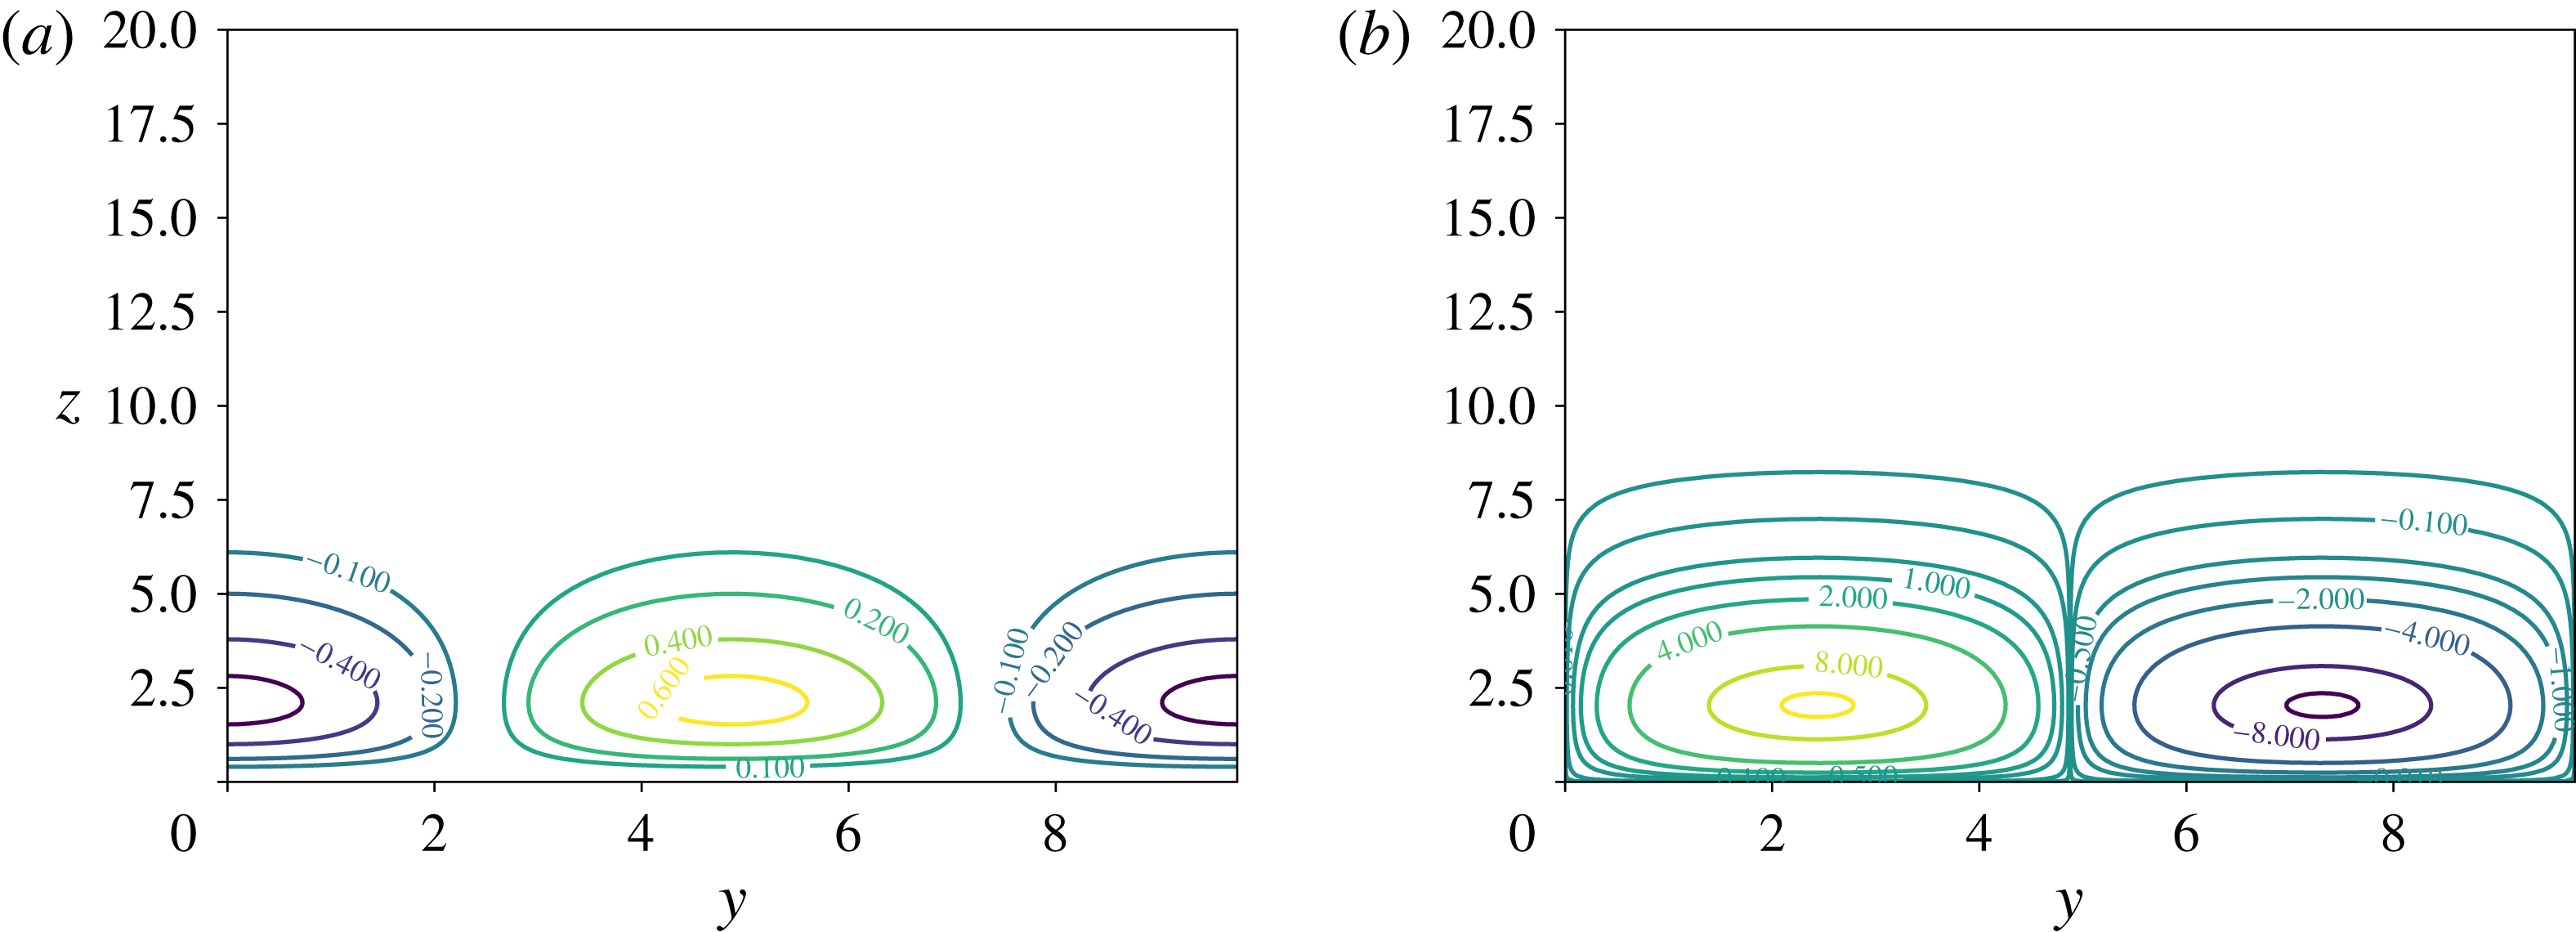
In figure 9, contour plots of the real part of the initial condition at
 $t_{0}=0.11$
of the optimal perturbation in the
 $(y,z)$
plane are shown. When advancing this initial condition to
 $t=1.53$
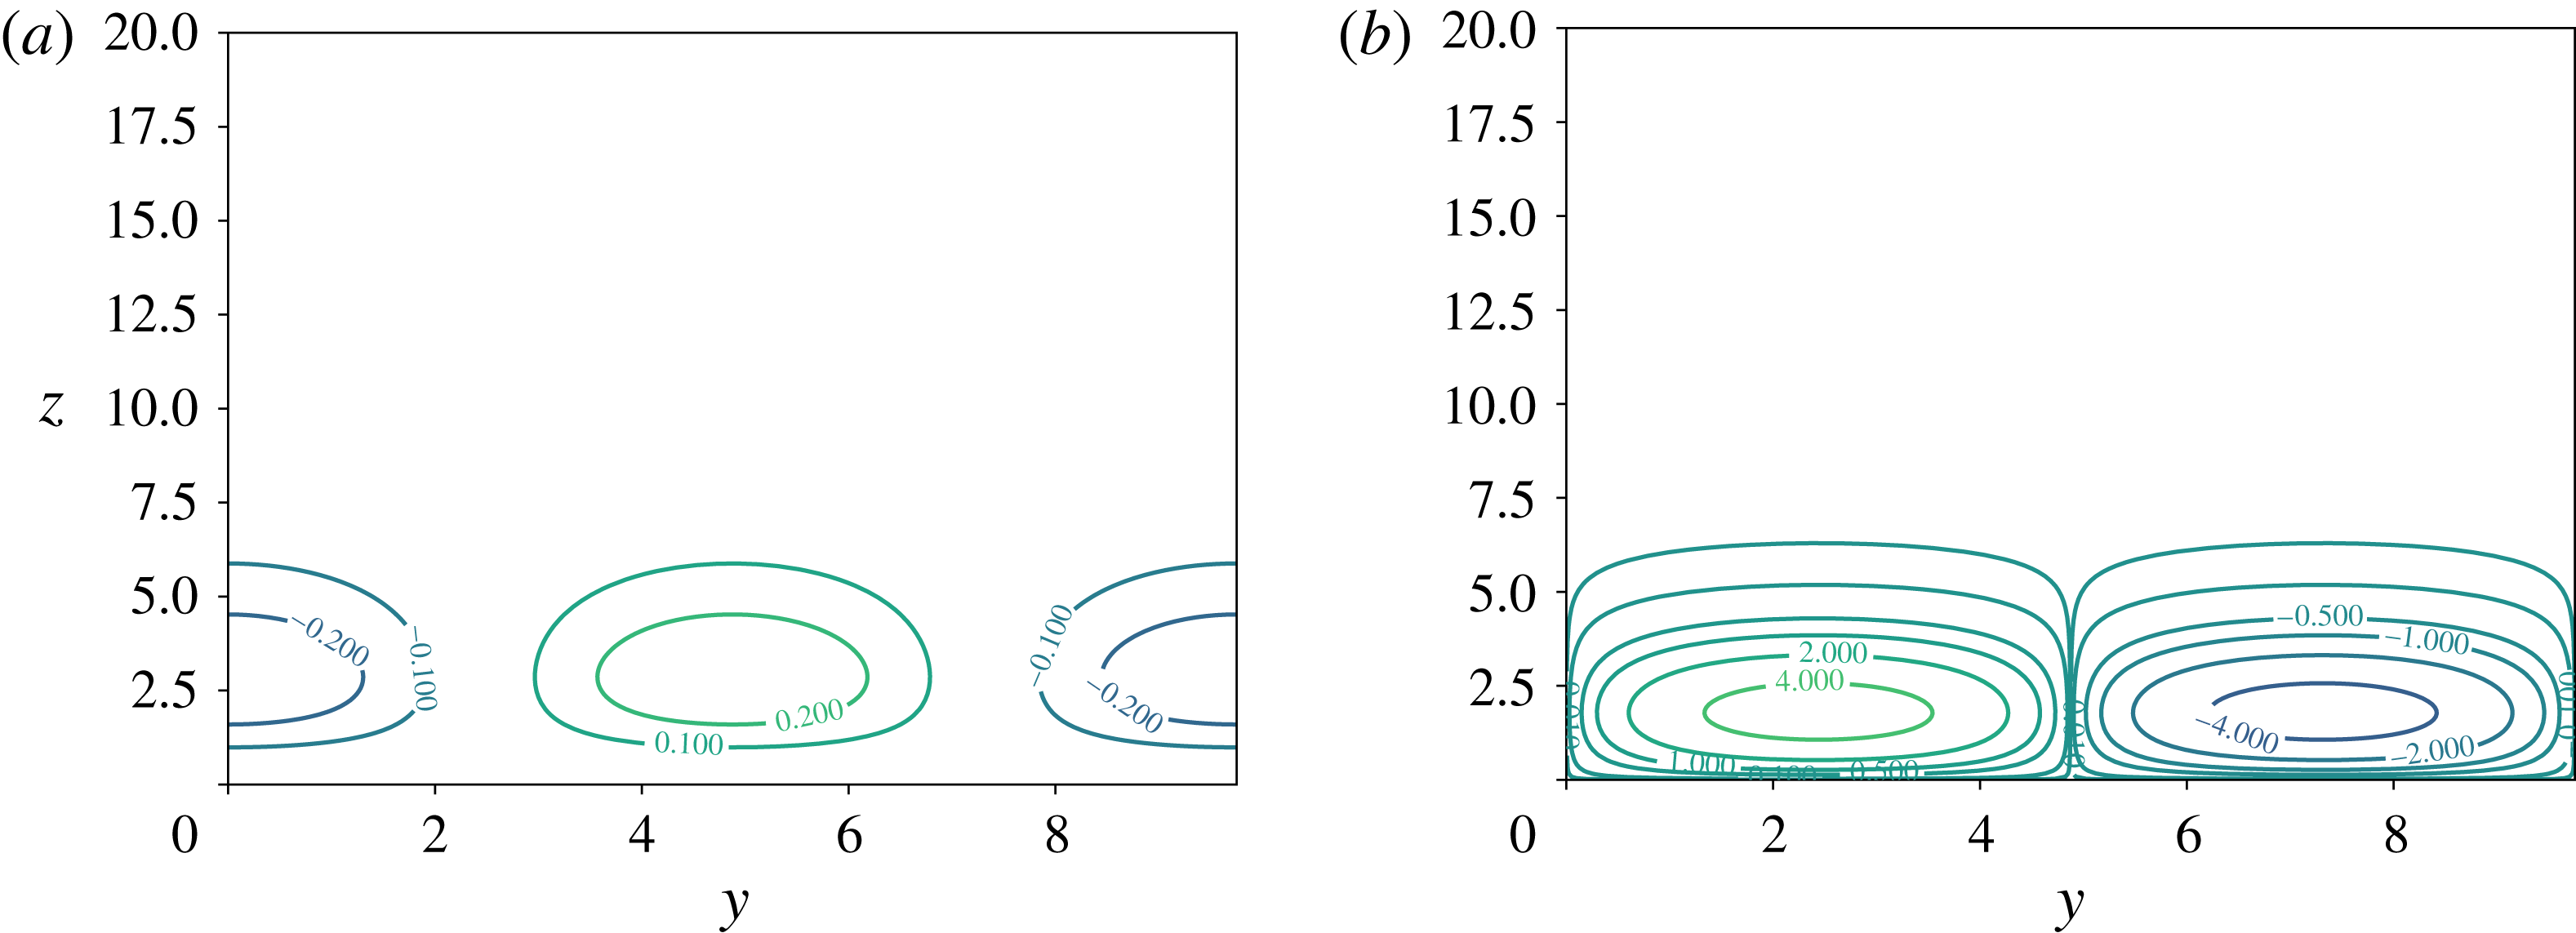
, where the energy of the streamwise streak is maximum (cf. figure 10), we observe that the amplitude of the normal velocity component
 $w$
has decreased by approximately a factor of 2, whereas the amplitude of the normal vorticity
 $\unicode[STIX]{x1D701}$
has increased by approximately a factor of 500.
Initial condition for the streamwise streak with maximum amplification,
 $\max _{\unicode[STIX]{x1D6FD},t_{0},t}G(\unicode[STIX]{x1D6FC}=0,\unicode[STIX]{x1D6FD},t_{0},t,Re_{\unicode[STIX]{x1D6FF}})$
, for different Reynolds numbers.

Contour plots of (a) the real part of
 $w(z,t_{0})\exp (\text{i}\unicode[STIX]{x1D6FD}y)$
and (b) the real part of
 $\unicode[STIX]{x1D701}(z,t_{0})\exp (\text{i}\unicode[STIX]{x1D6FD}y)Re$
, which are the initial condition at
 $t_{0}$
for the optimal perturbation for the case
 $Re=500$
,
 $\unicode[STIX]{x1D6FD}_{max}=0.64$
,
 $t_{0}=0.11$
and
 $t=1.53$
.

Contour plots of (a) the real part of
 $w(z,t)\exp (\text{i}\unicode[STIX]{x1D6FD}y)$
and (b) the real part of
 $\unicode[STIX]{x1D701}(z,t)\exp (\text{i}\unicode[STIX]{x1D6FD}y)Re\times 10^{-3}$
, which are obtained by advancing the initial condition in figure 9 to time
 $t=1.53$
for the optimal perturbation for the case
 $Re=500$
,
 $\unicode[STIX]{x1D6FD}_{max}=0.64$
and
 $t_{0}=0.11$
.

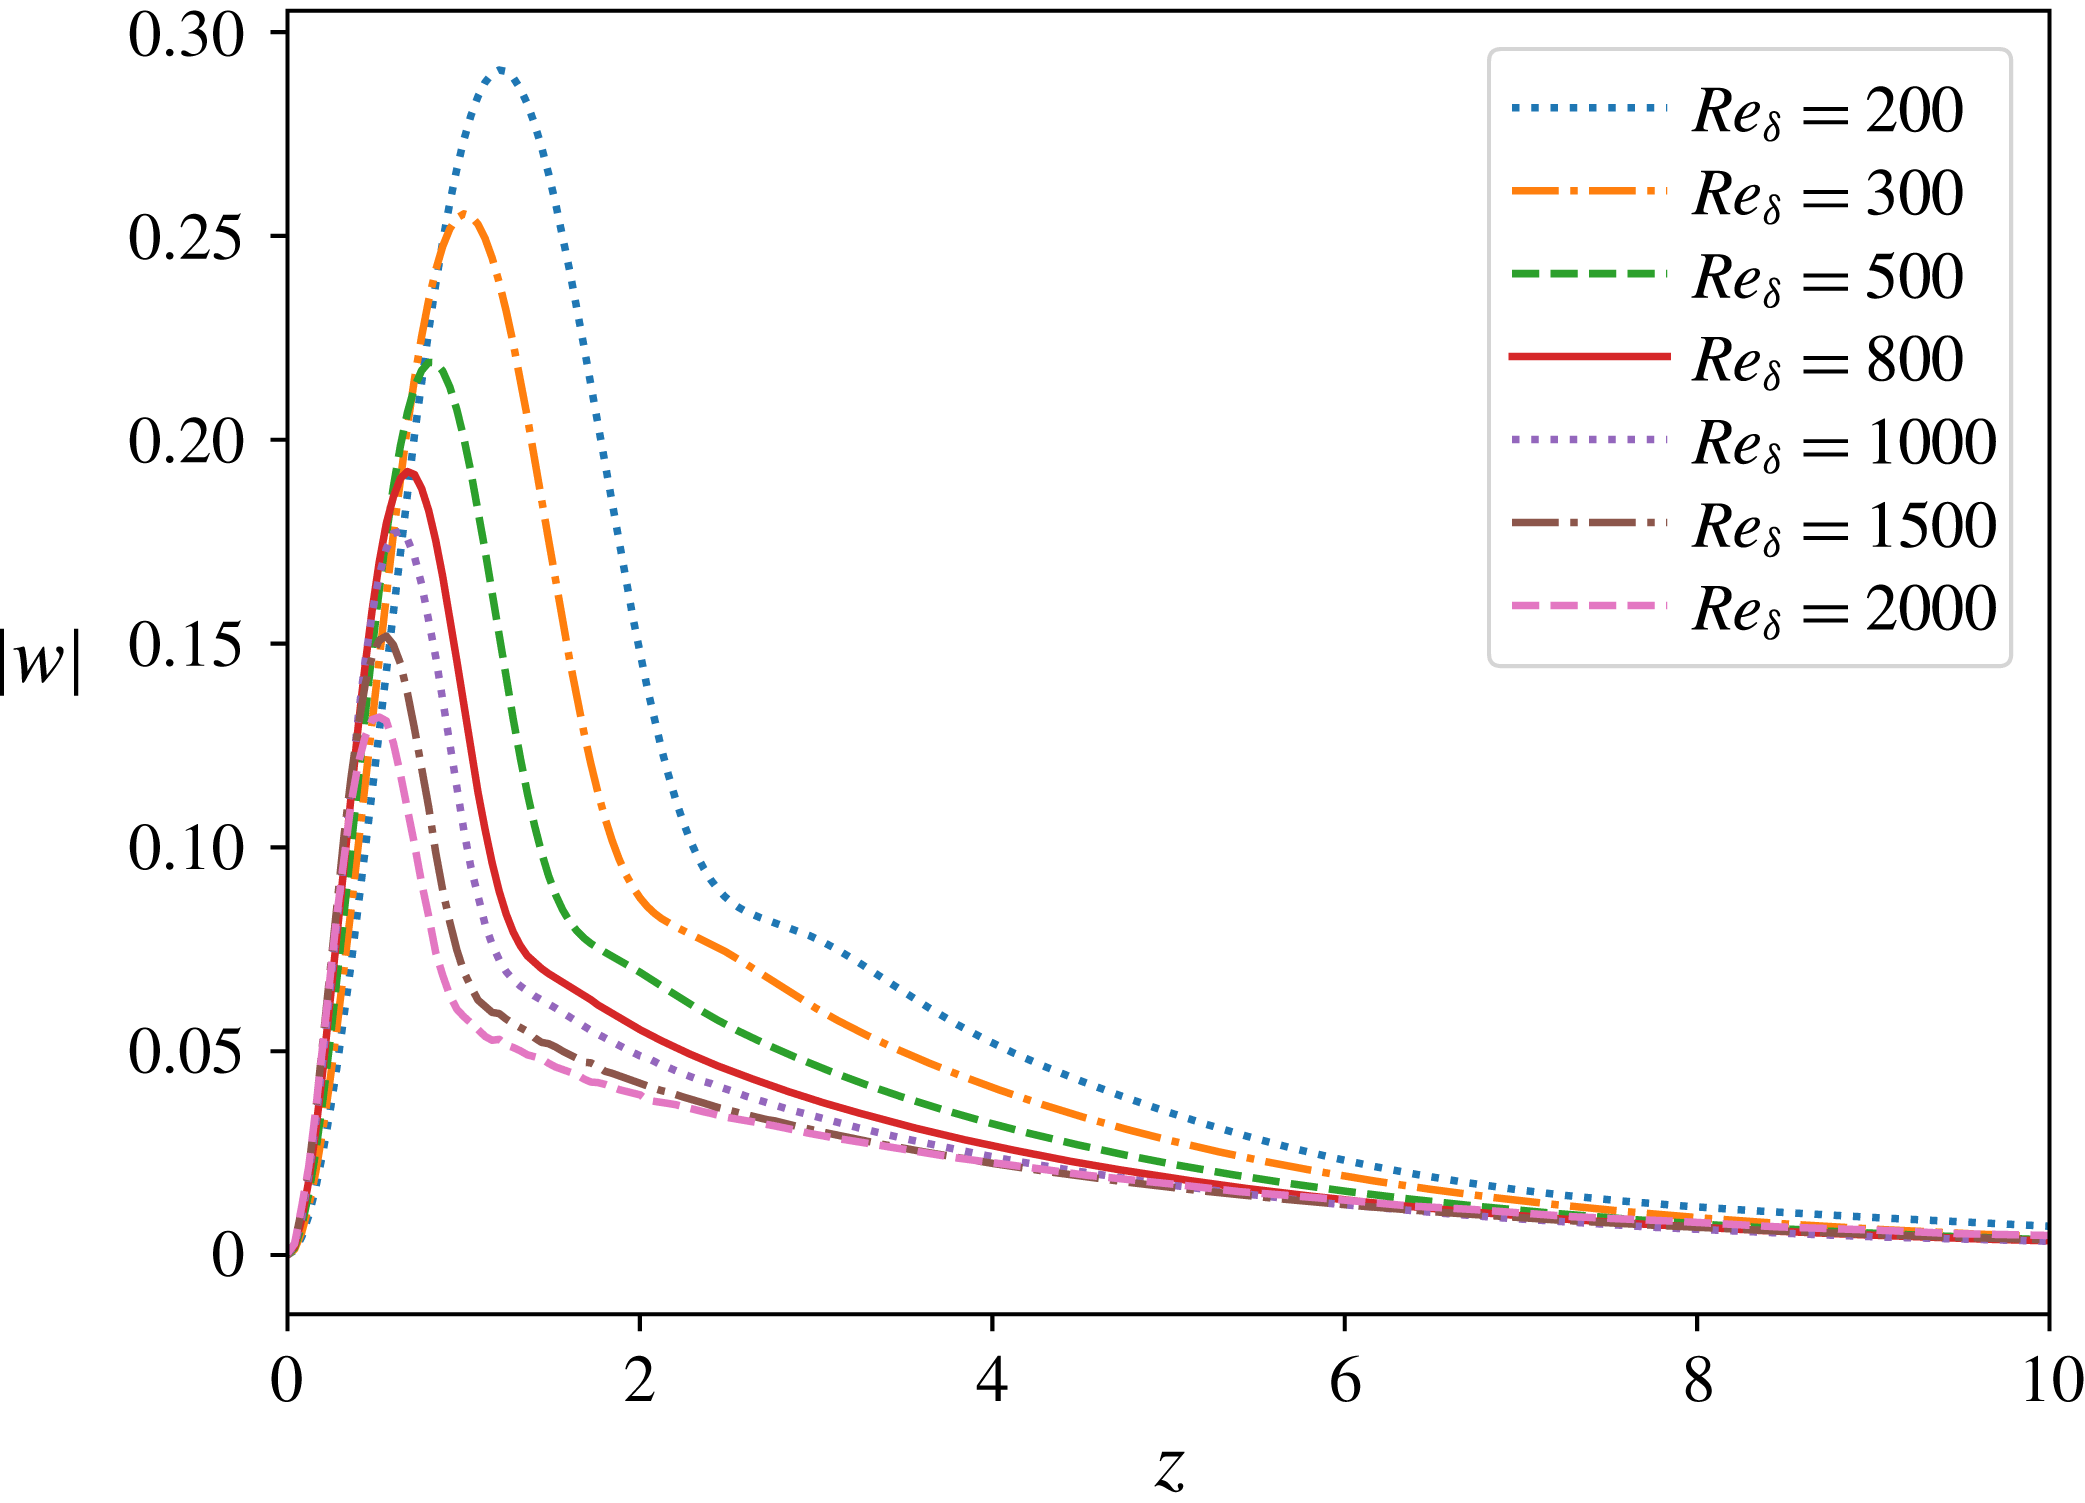
Initial condition
 $w$
for the two-dimensional perturbations withmaximum amplification,
 $\max _{\unicode[STIX]{x1D6FC},t_{0},t}G(\unicode[STIX]{x1D6FC},\unicode[STIX]{x1D6FD}=0,t_{0},t,Re_{\unicode[STIX]{x1D6FF}})$
, for different Reynolds numbers.

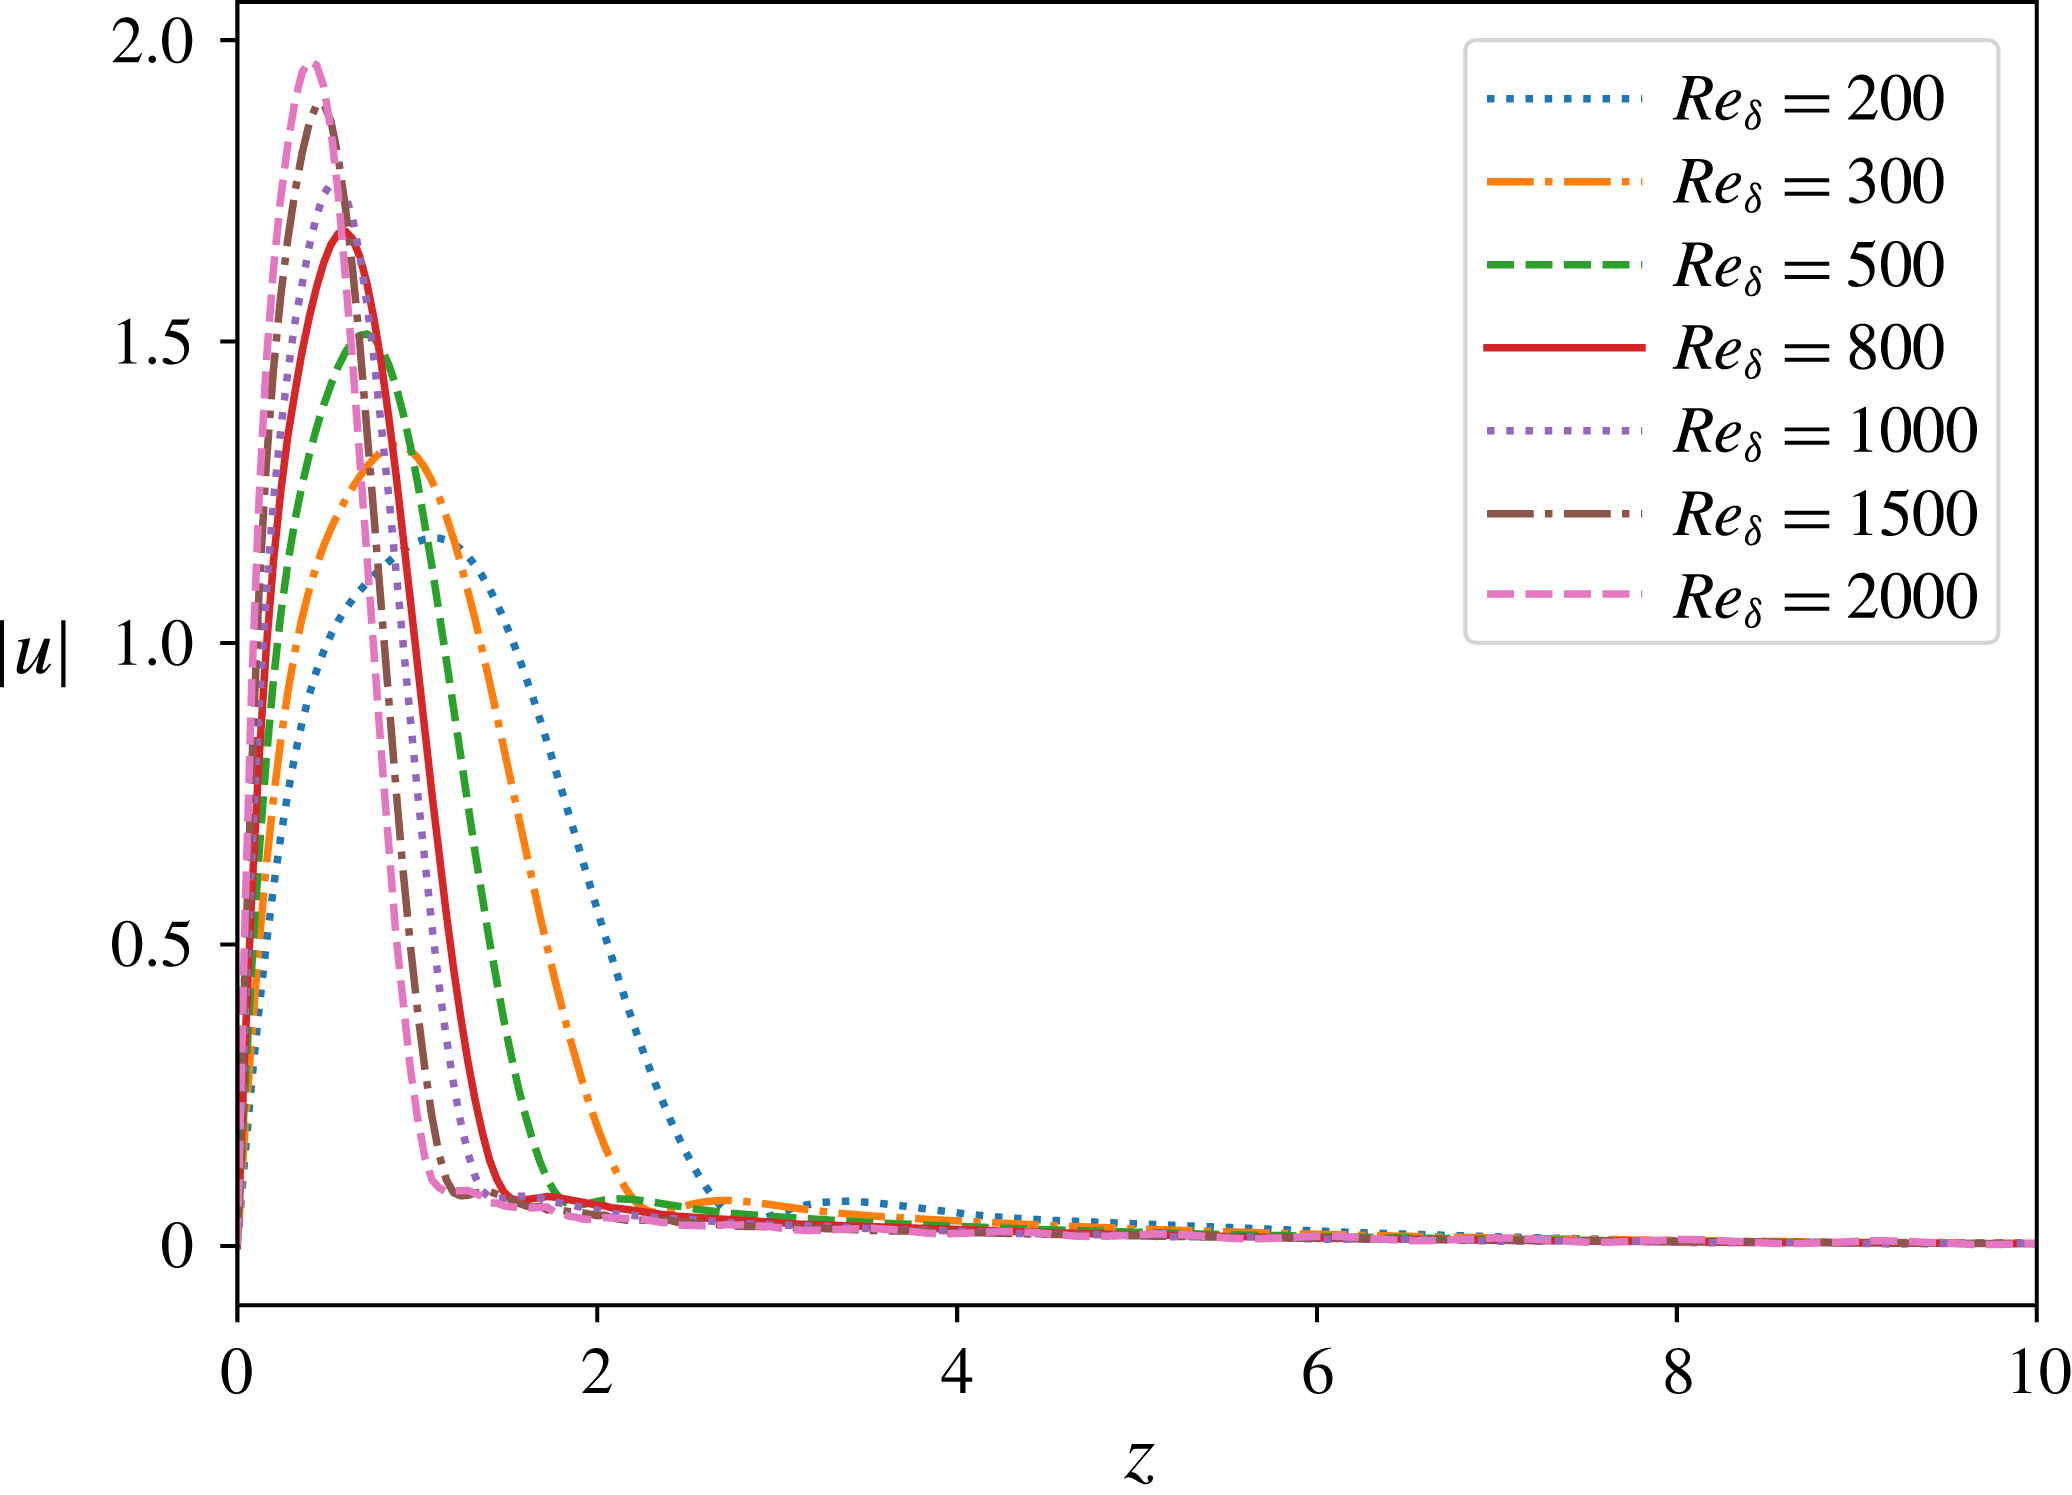
The horizontal component
 $u=\text{i}\text{D}w/\unicode[STIX]{x1D6FC}$
of the initial condition for two-dimensional perturbations with maximum amplification,
 $\max _{\unicode[STIX]{x1D6FC},t_{0},t}G(\unicode[STIX]{x1D6FC},\unicode[STIX]{x1D6FD}=0,t_{0},t,Re_{\unicode[STIX]{x1D6FF}})$
, for different Reynolds numbers.

For two-dimensional perturbations, on the other hand, the energy is distributed between the normal component
 $w$
and the horizontal component
 $u=\text{i}\text{D}w/\unicode[STIX]{x1D6FC}$
. As can be observed from figure 11, for increasing Reynolds number, the amplitude of
 $w$
decreases. Its share of the initial energy goes down as well. Since the initial energy is normalized to unity, this implies that the energy contribution associated with
 $u$
must increase. Corresponding to this energy increase, we observe that the amplitude of
 $u$
increases for increasing Reynolds number (cf. figure 12). We choose the case
 $Re_{\unicode[STIX]{x1D6FF}}=1000$
in order to visualize the spatial structure of the optimal two-dimensional perturbation. For this case the maximum amplification is given by
 $$\begin{eqnarray}\max _{\unicode[STIX]{x1D6FC},t_{0},t}G(\unicode[STIX]{x1D6FC},\unicode[STIX]{x1D6FD}=0,t_{0},t,Re_{\unicode[STIX]{x1D6FF}}=1000)=1.34\times 10^{18},\end{eqnarray}$$
where the parameters at maximum are given by
 $$\begin{eqnarray}\unicode[STIX]{x1D6FC}=0.33,\quad t_{0}=0.26,\quad t=14.2.\end{eqnarray}$$
In figure 13, contour plots in the
 $(x,z)$
plane of the real part of
 $w\exp (\text{i}\unicode[STIX]{x1D6FC}x)$
at initial time
 $t_{0}$
and at time
 $t$
when it reaches maximal amplification are plotted. Initially, the perturbation is confined to a thin layer inside the boundary layer. While reaching its maximum amplification, its spatial structure grows in the wall-normal direction.
Contour plots of the real part of
 $w\exp (\text{i}\unicode[STIX]{x1D6FC}x)$
at (a) initial time
 $t_{0}=0.26$
and (b) time
 $t=14.2$
(
 $w$
multiplied by
 $10^{-8}$
), when it reaches its maximum amplification, for the optimal perturbation for the case
 $Re=1000$
with
 $\unicode[STIX]{x1D6FC}_{max}=0.33$
.

Amplification
 $G(\unicode[STIX]{x1D6FC}=0.35,\unicode[STIX]{x1D6FD}=0,t_{0},t,Re_{\unicode[STIX]{x1D6FF}})$
of the non-modal two-dimensional perturbation versus corresponding amplification of the modal Tollmien–Schlichting wave with
 $\unicode[STIX]{x1D6FC}=0.35$
computed by means of the Orr–Sommerfeld equation, for
 $Re_{\unicode[STIX]{x1D6FF}}=141$
and
 $447$
. The initial time
 $t_{0}$
is taken from the minimum of the modal Tollmien–Schlichting waves.

4 Relation to previous results in the literature
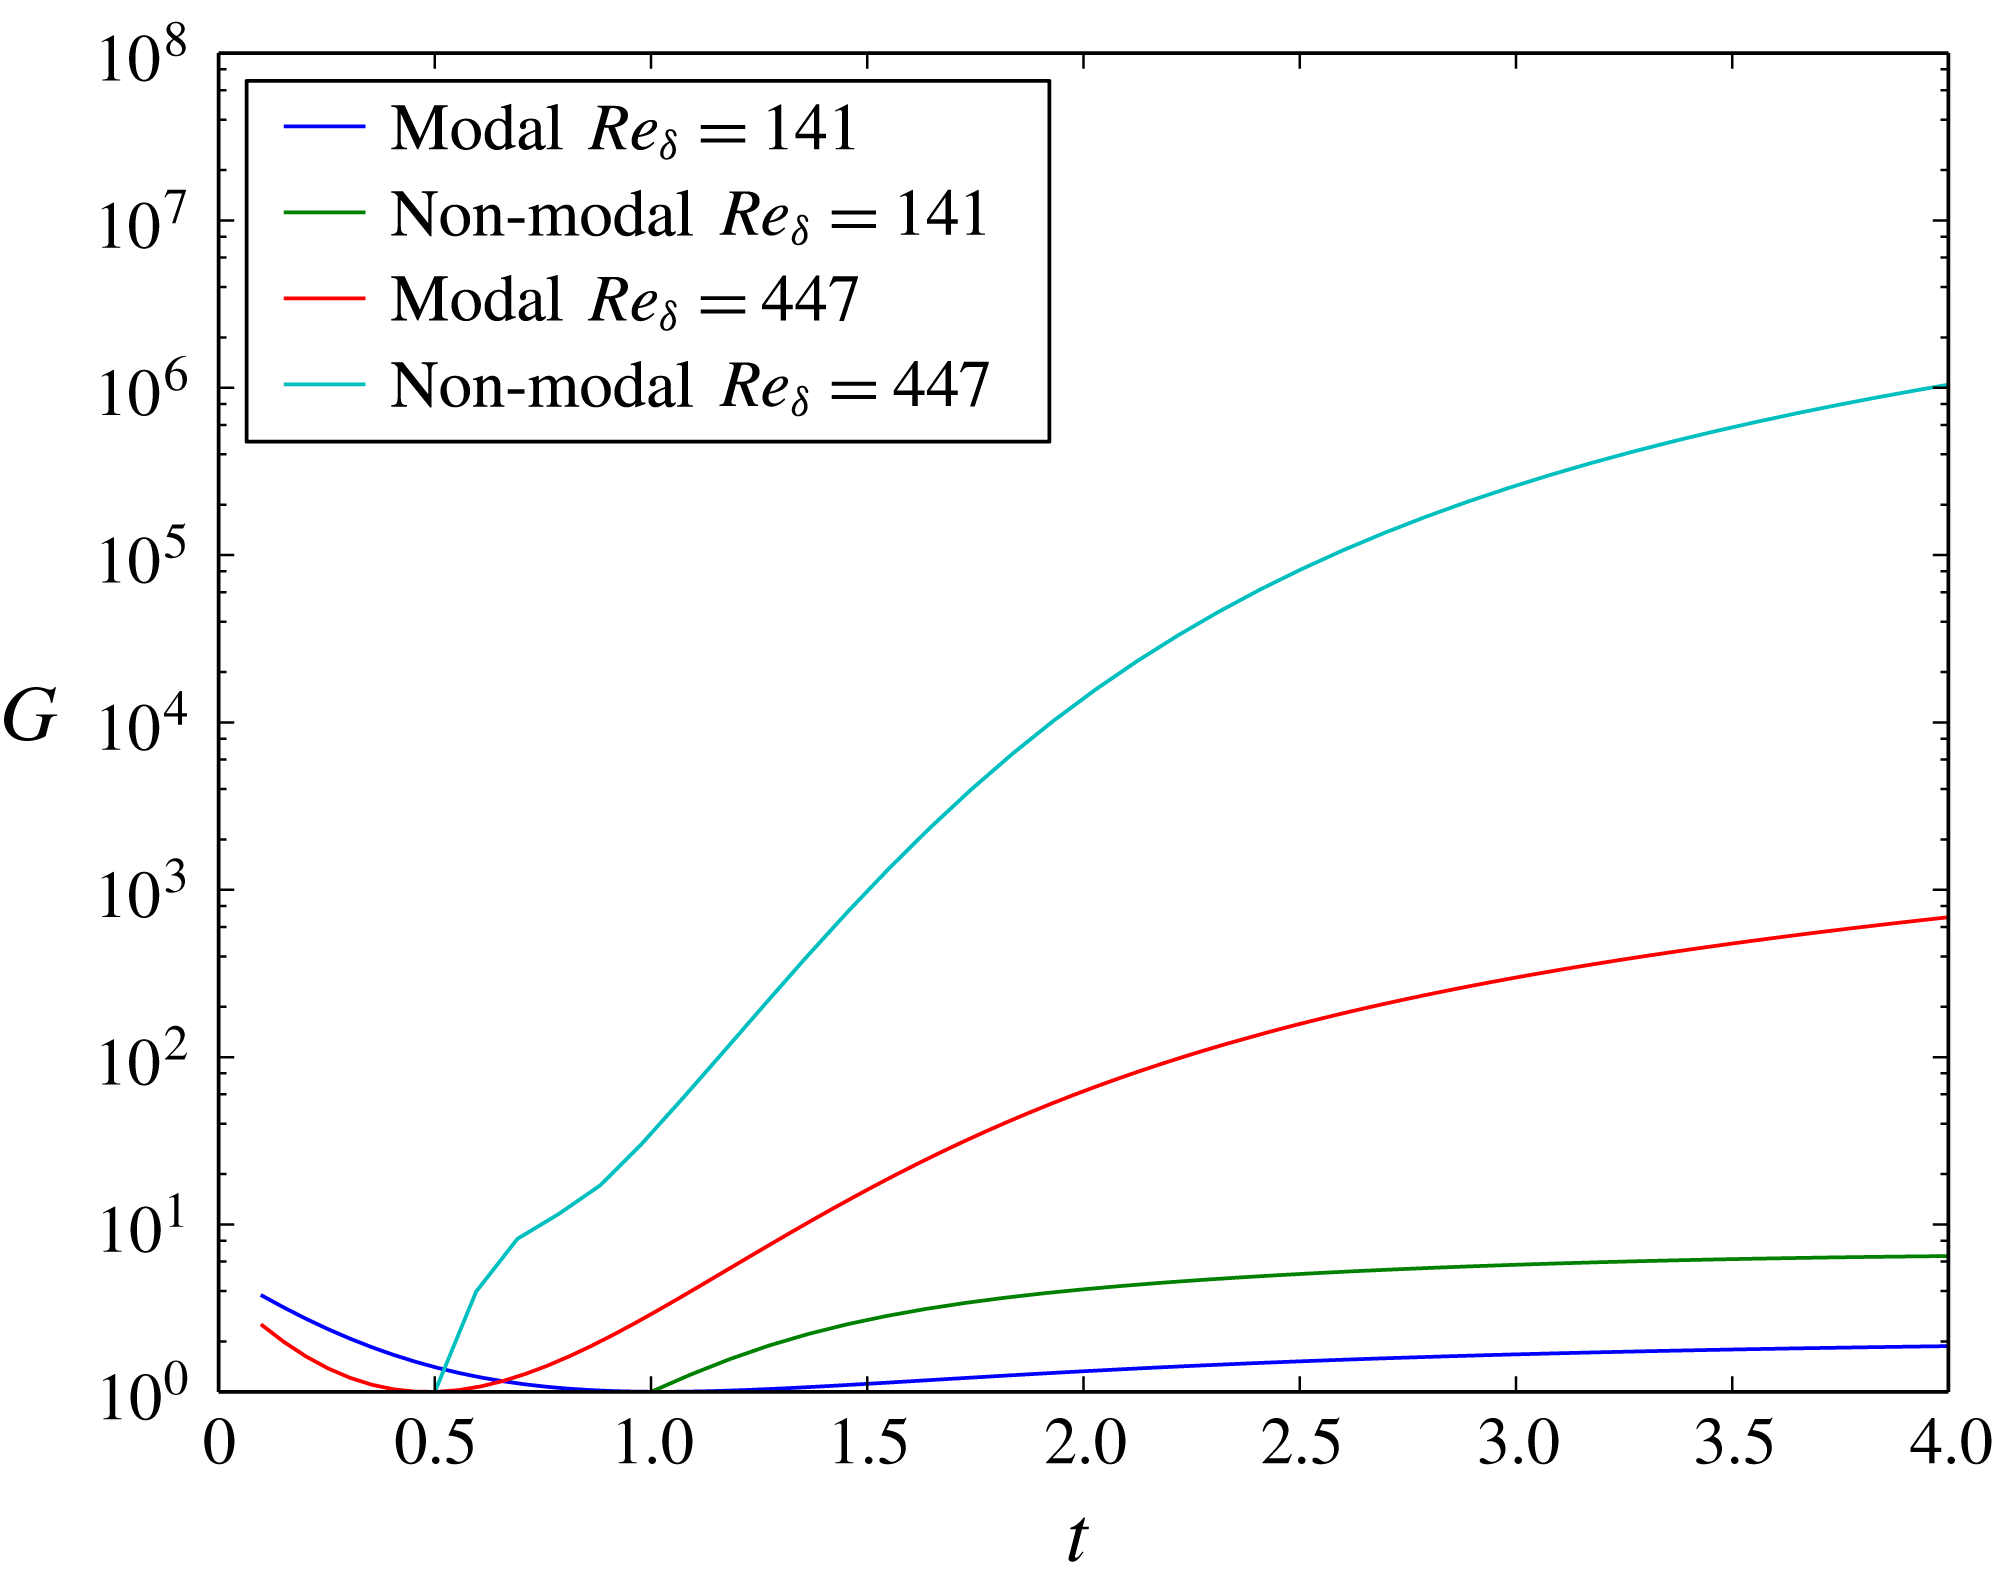
A question that suggests itself immediately is the relation between the present non-modal stability analysis and the modal stability analyses performed previously in Blondeaux et al. (Reference Blondeaux, Pralits and Vittori2012), Verschaeve & Pedersen (Reference Verschaeve and Pedersen2014) and Sadek et al. (Reference Sadek, Parras, Diamessis and Liu2015). Naturally, the amplifications of the optimal perturbations are expected to be larger than the corresponding ones of the modal Tollmien–Schlichting waves. This can be seen in figure 14, where we have solved the Orr–Sommerfeld equation for the present problem in a quasi-static fashion for the wavenumber
 $\unicode[STIX]{x1D6FC}=0.35$
and Reynolds numbers
 $Re_{\unicode[STIX]{x1D6FF}}=141$
and
 $Re_{\unicode[STIX]{x1D6FF}}=447$
. The amplification of the optimal perturbation can be several orders of magnitude larger than that of the corresponding modal Tollmien–Schlichting wave. On the other hand, the main conclusions by Verschaeve & Pedersen (Reference Verschaeve and Pedersen2014) are still supported by the present analysis. Although attempted by several experimental and direct numerical studies (Vittori & Blondeaux Reference Vittori and Blondeaux2008; Sumer et al.
Reference Sumer, Jensen, Sørensen, Fredsøe, Liu and Carstensen2010; Özdemir et al.
Reference Özdemir, Hsu and Balachandar2013), a well-defined transitional Reynolds number cannot be given for this flow. As also pointed out in the present analysis, depending on the characteristics of the external perturbations, such as length scale and intensity, the flow might transition to turbulence for different Reynolds numbers. Without control of the external perturbations, any experiment on the stability properties of this flow will hardly be repeatable. On the other hand, as we have shown above, a critical Reynolds number
 $Re_{A}$
can be defined for which the present flow switches from a monotonically stable to a non-monotonically stable flow. This critical Reynolds number has, however, little practical bearing.
Concerning the direct numerical simulations by Vittori & Blondeaux (Reference Vittori and Blondeaux2008, Reference Vittori and Blondeaux2011) and Özdemir et al. (Reference Özdemir, Hsu and Balachandar2013), the present study gives an indication for the transition process happening via two-dimensional vortex rollers observed in their direct numerical simulations. In addition, we are able to answer the question raised by Özdemir et al. (Reference Özdemir, Hsu and Balachandar2013) about the possible mechanism of a bypass transition. However, quantitative differences between the direct numerical results by Özdemir et al. (Reference Özdemir, Hsu and Balachandar2013) and the present ones exist. Özdemir et al. (Reference Özdemir, Hsu and Balachandar2013) introduced a random disturbance at
 $t_{0}=-\unicode[STIX]{x03C0}$
with different amplitudes in their simulations and monitored the evolution of the amplitude of these disturbances – cf. figure 10 in Özdemir et al. (Reference Özdemir, Hsu and Balachandar2013). From that figure, we see the characteristic kink of two-dimensional perturbations overtaking streamwise streaks appearing in their simulations only for
 $Re_{\unicode[STIX]{x1D6FF}}=2000$
and higher. If we compare this to the optimal perturbations with initial times
 $t_{0}=-4$
and
 $t_{0}=-2$
in figure 3, we see this kink developing already for a much lower Reynolds number, namely
 $Re_{\unicode[STIX]{x1D6FF}}=1000$
(cf. figure 3
d). The reasons for this discrepancy are unclear. Although Özdemir et al. (Reference Özdemir, Hsu and Balachandar2013) employed perturbation amplitudes with values up to 20 % of the base flow, which might trigger nonlinear effects, the acceleration region of the flow has a strong damping effect, such that the initial perturbation growth starting in the deceleration region is most likely governed by linear effects. We might, however, point out that, in order for a Navier–Stokes solver to capture the growth of two-dimensional perturbations correctly, an extremely fine resolution in space and time is needed, as can be seen in Verschaeve & Pedersen (Reference Verschaeve and Pedersen2014, appendix A) for modal Tollmien–Schlichting waves. In particular, when the resolution requirements are not met, these perturbations tend to be damped instead of amplified. In this respect, it is interesting to note that Vittori & Blondeaux (Reference Vittori and Blondeaux2008, Reference Vittori and Blondeaux2011) found that regular vortex tubes appeared in their simulation for a Reynolds number around
 $Re_{\unicode[STIX]{x1D6FF}}=1000$
(
 $Re_{Sumer}=5\times 10^{5}$
), which corresponds relatively well with the present findings. However, it cannot be excluded that this is for the wrong reason, as a larger level of background noise resulting from, for example, the numerical approximation error by their low-order solver, might be present in their simulations.
The Reynolds number in the experiments by Liu et al. (Reference Liu, Park and Cowen2007) lies in the range
 $Re_{\unicode[STIX]{x1D6FF}}=72{-}143$
, which is larger than
 $Re_{A}=18$
. However, as can be seen from figure 3, the maximum amplification for these cases is around a factor of
 $30$
. Therefore, without any induced disturbance, growth of streamwise streaks from background noise is probably not observable and has not been observed in Liu et al. (Reference Liu, Park and Cowen2007). On the other hand, in the experiments by Sumer et al. (Reference Sumer, Jensen, Sørensen, Fredsøe, Liu and Carstensen2010), vortex rollers appeared in the range
 $630\leqslant Re_{\unicode[STIX]{x1D6FF}}<1000$
. Assuming that the initial level of external perturbations in the experiments is higher than in the direct numerical simulations, the observation by Sumer et al. fits the present picture. However, for
 $Re_{\unicode[STIX]{x1D6FF}}>1000$
, they observed the development of turbulent spots in the deceleration region of the flow. This is in contrast to the results by Özdemir et al. (Reference Özdemir, Hsu and Balachandar2013) of a K-type transition. The present analysis supports the finding of a transition process via the growth of two-dimensional perturbations. However, whether these non-modal Tollmien–Schlichting waves break down via a K-type transition as in Özdemir et al. (Reference Özdemir, Hsu and Balachandar2013) or whether they break up randomly producing turbulent spots (Shaikh & Gaster Reference Shaikh and Gaster1994; Gaster Reference Gaster2016) is difficult to say from this primary instability analysis. In addition, more information on the initial disturbances in the experiments is needed to come to any conclusions. Whereas random noise is applied in Vittori & Blondeaux (Reference Vittori and Blondeaux2008, Reference Vittori and Blondeaux2011) and Özdemir et al. (Reference Özdemir, Hsu and Balachandar2013), the initial disturbance in Sumer et al. (Reference Sumer, Jensen, Sørensen, Fredsøe, Liu and Carstensen2010) might stem from residual motion in their facility, probably exhibiting certain characteristics. Depending on these characteristics, perturbations other than the one showing optimal amplification might induce secondary instability. In addition, it cannot be excluded that a completely different instability mechanism is at work in the experiments of Sumer et al. (Reference Sumer, Jensen, Sørensen, Fredsøe, Liu and Carstensen2010). The focus in the present analysis is on the response to initial conditions and does not take into account any response to external forcing, which would be modelled by adding a source term to (2.23) and (2.24). It is possible that the present flow system displays some sensitivity to certain frequencies of vibrations present in the experimental set-up, altering the behaviour of the system for larger Reynolds numbers. In particular, different perturbations, such as streamwise streaks, might be favoured, leaving the possibility open that the turbulent spots nevertheless result from the breakdown of streamwise streaks (Andersson et al.
Reference Andersson, Brandt, Bottaro and Henningson2001; Brandt et al.
Reference Brandt, Schlatter and Henningson2004).
5 Conclusions
In the present work, a non-modal stability analysis of the bottom boundary layer flow under solitary waves is performed. Two competing mechanism can be identified: growing streamwise streaks and growing two-dimensional perturbations (non-modal Tollmien–Schlichting waves). By means of an energy bound, it is shown that the present flow is monotonically stable for Reynolds numbers below
 $Re_{\unicode[STIX]{x1D6FF}}=18$
after which it turns non-monotonically stable, with streamwise streaks growing first. Two-dimensional perturbations display growth only for Reynolds numbers larger than
 $Re_{\unicode[STIX]{x1D6FF}}=38$
. However, their maximum amplification overtakes that of streamwise streaks at
 $Re_{\unicode[STIX]{x1D6FF}}=170$
. As for steady flows, the maximum amplification of streamwise streaks displays quadratic growth with
 $Re_{\unicode[STIX]{x1D6FF}}$
for the present unsteady flow. On the other hand, the maximum amplification of two-dimensional perturbations shows a near-exponential growth with the Reynolds number in the deceleration region of the flow. Therefore, during primary instability, the dominant perturbations in the deceleration region of this flow are expected to be two-dimensional. This corresponds to the findings in the direct numerical simulations by Vittori & Blondeaux (Reference Vittori and Blondeaux2008) and Özdemir et al. (Reference Özdemir, Hsu and Balachandar2013) and in the experiments by Sumer et al. (Reference Sumer, Jensen, Sørensen, Fredsøe, Liu and Carstensen2010) of growing two-dimensional vortex rollers in the deceleration region of the flow. However, further investigation of the secondary instability mechanism and of receptivity to external (statistical) forcing is needed in order to explain the subsequent breakdown to turbulence in the boundary layer.
The boundary layer under solitary waves is a relatively simple model for a boundary layer flow with a favourable and an adverse pressure gradient. But, just for this reason, it allows one to analyse stability mechanisms being otherwise shrouded in more complicated flows.
The implementation of the numerical method has been done using the open source libraries Armadillo (Sanderson & Curtin Reference Sanderson and Curtin2016), FFTW (Frigo & Johnson Reference Frigo and Johnson2005) and GSL (Galassi et al. Reference Galassi, Davies, Theiler, Gough, Jungman, Alken, Booth and Rossi2009).
At this point, the first author would like to thank Caroline Lie for pointing out a mistake in Verschaeve & Pedersen (Reference Verschaeve and Pedersen2014). In figures 20, 22, 24 and 26 in Verschaeve & Pedersen (Reference Verschaeve and Pedersen2014), the frequency
 $\unicode[STIX]{x1D714}$
is incorrectly scaled. However, this does not affect any of the conclusions of that article. The first author apologizes for any inconvenience this might represent.
Appendix A. Numerical implementation
A.1 Numerical implementation for the energy bound
We expand
 $\unicode[STIX]{x1D701}$
and
 $w$
in (2.19)–(2.20) on the Shen–Legendre polynomials
 $\unicode[STIX]{x1D719}_{j}$
and
 $\unicode[STIX]{x1D713}_{j}$
for the Poisson and biharmonic operator, respectively (cf. Shen Reference Shen1994):
 $$\begin{eqnarray}\unicode[STIX]{x1D701}=\mathop{\sum }_{j=0}^{N-2}\unicode[STIX]{x1D701}_{j}\unicode[STIX]{x1D719}_{j}(z),\quad w=\mathop{\sum }_{j=0}^{N-4}w_{j}\unicode[STIX]{x1D713}_{j}(z),\end{eqnarray}$$
where
 $N$
is the number of Legendre polynomials. The semi-infinite domain
 $[0,\infty )$
is truncated at
 $h$
, where
 $h$
is chosen large enough by numerical inspection. The basis functions
 $\unicode[STIX]{x1D719}_{j}$
and
 $\unicode[STIX]{x1D713}_{j}$
are linear combinations of Legendre polynomials, such that a total number of
 $N$
Legendre polynomials is used for each expansion in (A 1). The basis functions
 $\unicode[STIX]{x1D719}_{j}$
satisfy the homogeneous Dirichlet conditions, whereas
 $\unicode[STIX]{x1D713}_{j}$
honours the clamped boundary conditions. A Galerkin formulation is then chosen for the discrete system:
 $$\begin{eqnarray}\left(\begin{array}{@{}cc@{}}\unicode[STIX]{x1D63C} & \unicode[STIX]{x1D63D}\\ \unicode[STIX]{x1D63D}^{\text{T}} & \unicode[STIX]{x1D63F}\end{array}\right)\left(\begin{array}{@{}c@{}}\boldsymbol{w}\\ \unicode[STIX]{x1D73B}\end{array}\right)=\unicode[STIX]{x1D707}\left(\begin{array}{@{}cc@{}}\unicode[STIX]{x1D640} & \mathbf{0}\\ \mathbf{0} & \unicode[STIX]{x1D643}\end{array}\right)\left(\begin{array}{@{}c@{}}\boldsymbol{w}\\ \unicode[STIX]{x1D73B}\end{array}\right).\end{eqnarray}$$
The elements of the matrices are given by
 $$\begin{eqnarray}\displaystyle \unicode[STIX]{x1D608}_{ij} & = & \displaystyle \frac{1}{Re}\left\{\int _{0}^{h}\text{D}^{2}\unicode[STIX]{x1D713}_{i}\text{D}^{2}\unicode[STIX]{x1D713}_{j}\,\text{d}z+2(\unicode[STIX]{x1D6FC}^{2}+\unicode[STIX]{x1D6FD}^{2})\int _{0}^{h}\text{D}\unicode[STIX]{x1D713}_{i}\text{D}\unicode[STIX]{x1D713}_{j}\,\text{d}z+(\unicode[STIX]{x1D6FC}^{2}+\unicode[STIX]{x1D6FD}^{2})^{2}\int _{0}^{h}\unicode[STIX]{x1D713}_{i}\unicode[STIX]{x1D713}_{j}\,\text{d}z\right\}\nonumber\\ \displaystyle & & \displaystyle +\,\frac{\text{i}\unicode[STIX]{x1D6FC}}{2}\left\{\int _{0}^{h}\unicode[STIX]{x1D713}_{i}\text{D}^{2}U_{base}\unicode[STIX]{x1D713}_{j}\,\text{d}z+2\int _{0}^{h}\unicode[STIX]{x1D713}_{i}\unicode[STIX]{x2202}_{z}U_{base}\text{D}\unicode[STIX]{x1D713}_{j}\,\text{d}z\right\},\end{eqnarray}$$
 $$\begin{eqnarray}\displaystyle & \displaystyle \unicode[STIX]{x1D609}_{ij}=\frac{\text{i}\unicode[STIX]{x1D6FD}}{2}\int _{0}^{h}\unicode[STIX]{x1D713}_{i}\text{D}U_{base}\unicode[STIX]{x1D719}_{j}\,\text{d}z, & \displaystyle\end{eqnarray}$$
 $$\begin{eqnarray}\displaystyle & \displaystyle \unicode[STIX]{x1D60B}_{ij}=\frac{1}{Re}\left\{\int _{0}^{h}\text{D}\unicode[STIX]{x1D719}_{i}\text{D}\unicode[STIX]{x1D719}_{j}\,\text{d}z+(\unicode[STIX]{x1D6FC}^{2}+\unicode[STIX]{x1D6FD}^{2})\int _{0}^{h}\unicode[STIX]{x1D719}_{i}\unicode[STIX]{x1D719}_{j}\,\text{d}z\right\}, & \displaystyle\end{eqnarray}$$
 $$\begin{eqnarray}\displaystyle & \displaystyle 2\unicode[STIX]{x1D60C}_{ij}=-\int _{0}^{h}\text{D}\unicode[STIX]{x1D713}_{i}\text{D}\unicode[STIX]{x1D713}_{j}\,\text{d}z-(\unicode[STIX]{x1D6FC}^{2}+\unicode[STIX]{x1D6FD}^{2})\int _{0}^{h}\unicode[STIX]{x1D713}_{i}\unicode[STIX]{x1D713}_{j}\,\text{d}z, & \displaystyle\end{eqnarray}$$
 $$\begin{eqnarray}\displaystyle & \displaystyle 2\unicode[STIX]{x1D60F}_{ij}=-\int _{0}^{h}\unicode[STIX]{x1D719}_{i}\unicode[STIX]{x1D719}_{j}\,\text{d}z. & \displaystyle\end{eqnarray}$$
For the verification and validation of the method, manufactured solutions have been used. In addition, the Reynolds numbers
 $Re_{A}$
and
 $Re_{B}$
for Stokes’ second problem have been computed, resulting in
 $Re_{A}=18.986$
and
 $Re_{B}=38.951$
, corresponding well with the numbers
 $19.0$
and
 $38.9$
obtained by Davis & von Kerczek (Reference Davis and von Kerczek1973, table 1).
A.2 Numerical implementation for the non-modal analysis
The basis functions
 $\unicode[STIX]{x1D713}_{j}$
and
 $\unicode[STIX]{x1D719}_{j}$
for
 $w$
and
 $\unicode[STIX]{x1D701}$
are in this case given by the Shen–Chebyshev polynomials (cf. Shen Reference Shen1995), instead of the Shen–Legendre polynomials as before. This allows us to use the fast Fourier transform for computing derivatives. Equations (2.23)–(2.24) are written in discrete form as
 $$\begin{eqnarray}\frac{2}{Re_{\unicode[STIX]{x1D6FF}}}\left(\begin{array}{@{}cc@{}}\unicode[STIX]{x1D647}^{\unicode[STIX]{x1D713}} & 0\\ 0 & \unicode[STIX]{x1D648}^{\unicode[STIX]{x1D719}}\end{array}\right)\frac{\text{d}}{\text{d}t}\left(\begin{array}{@{}c@{}}\boldsymbol{w}\\ \unicode[STIX]{x1D73B}\end{array}\right)=\left(\begin{array}{@{}cc@{}}\unicode[STIX]{x1D647}^{OSE} & \mathbf{0}\\ \unicode[STIX]{x1D647}^{C} & \unicode[STIX]{x1D647}^{SC}\end{array}\right)\left(\begin{array}{@{}c@{}}\boldsymbol{w}\\ \unicode[STIX]{x1D73B}\end{array}\right),\end{eqnarray}$$
where the elements of the matrices are given by
 $$\begin{eqnarray}\displaystyle & \displaystyle \unicode[STIX]{x1D614}_{ij}^{\unicode[STIX]{x1D713}}=\int _{0}^{h}\unicode[STIX]{x1D713}_{i}\unicode[STIX]{x1D713}_{j}\,\text{d}z, & \displaystyle\end{eqnarray}$$
 $$\begin{eqnarray}\displaystyle & \displaystyle \unicode[STIX]{x1D60E}_{ij}^{\unicode[STIX]{x1D713}}=\int _{0}^{h}\text{D}\unicode[STIX]{x1D713}_{i}\text{D}\unicode[STIX]{x1D713}_{j}\,\text{d}z, & \displaystyle\end{eqnarray}$$
 $$\begin{eqnarray}\displaystyle & \displaystyle \unicode[STIX]{x1D608}_{ij}^{\unicode[STIX]{x1D713}}=\int _{0}^{h}\text{D}^{2}\unicode[STIX]{x1D713}_{i}\text{D}^{2}\unicode[STIX]{x1D713}_{j}\,\text{d}z, & \displaystyle\end{eqnarray}$$
 $$\begin{eqnarray}\displaystyle & \displaystyle \unicode[STIX]{x1D614}_{ij}^{\unicode[STIX]{x1D719}}=\int _{0}^{h}\unicode[STIX]{x1D719}_{i}\unicode[STIX]{x1D719}_{j}\,\text{d}z, & \displaystyle\end{eqnarray}$$
 $$\begin{eqnarray}\displaystyle & \displaystyle \unicode[STIX]{x1D60E}_{ij}^{\unicode[STIX]{x1D719}}=\int _{0}^{h}\text{D}\unicode[STIX]{x1D719}_{i}\text{D}\unicode[STIX]{x1D719}_{j}\,\text{d}z, & \displaystyle\end{eqnarray}$$
 $$\begin{eqnarray}\displaystyle & \displaystyle \unicode[STIX]{x1D617}_{ij}^{1}=\int _{0}^{h}\unicode[STIX]{x2202}_{z}^{2}U_{base}\unicode[STIX]{x1D713}_{i}\unicode[STIX]{x1D713}_{j}\,\text{d}z, & \displaystyle\end{eqnarray}$$
 $$\begin{eqnarray}\displaystyle & \displaystyle \unicode[STIX]{x1D617}_{ij}^{2}=\int _{0}^{h}U_{base}\unicode[STIX]{x1D713}_{i}(\text{D}^{2}-(\unicode[STIX]{x1D6FC}^{2}+\unicode[STIX]{x1D6FD}^{2}))\unicode[STIX]{x1D713}_{j}\,\text{d}z, & \displaystyle\end{eqnarray}$$
 $$\begin{eqnarray}\displaystyle & \displaystyle \unicode[STIX]{x1D617}_{ij}^{3}=\int _{0}^{h}U_{base}\unicode[STIX]{x1D719}_{i}\unicode[STIX]{x1D719}_{j}\,\text{d}z, & \displaystyle\end{eqnarray}$$
 $$\begin{eqnarray}\displaystyle & \displaystyle \unicode[STIX]{x1D613}_{ij}^{\unicode[STIX]{x1D713}}=-\unicode[STIX]{x1D60E}_{ij}^{\unicode[STIX]{x1D713}}-(\unicode[STIX]{x1D6FC}^{2}+\unicode[STIX]{x1D6FD}^{2})\unicode[STIX]{x1D614}_{ij}^{\unicode[STIX]{x1D713}}, & \displaystyle\end{eqnarray}$$
 $$\begin{eqnarray}\displaystyle & \displaystyle \unicode[STIX]{x1D613}_{ij}^{OSE}=\text{i}\unicode[STIX]{x1D6FC}\unicode[STIX]{x1D617}_{ij}^{1}-\text{i}\unicode[STIX]{x1D6FC}\unicode[STIX]{x1D617}_{ij}^{2}+\frac{1}{Re}(\unicode[STIX]{x1D608}_{ij}^{\unicode[STIX]{x1D713}}+2(\unicode[STIX]{x1D6FC}^{2}+\unicode[STIX]{x1D6FD}^{2})\unicode[STIX]{x1D60E}_{ij}^{\unicode[STIX]{x1D713}}+(\unicode[STIX]{x1D6FC}^{2}+\unicode[STIX]{x1D6FD}^{2})^{2}\unicode[STIX]{x1D614}_{ij}^{\unicode[STIX]{x1D713}}), & \displaystyle\end{eqnarray}$$
 $$\begin{eqnarray}\displaystyle & \displaystyle \unicode[STIX]{x1D613}_{ik}^{C}=\text{i}\unicode[STIX]{x1D6FD}\int _{0}^{h}\text{D}U_{0}\unicode[STIX]{x1D719}_{i}\unicode[STIX]{x1D713}_{k}\,\text{d}z, & \displaystyle\end{eqnarray}$$
 $$\begin{eqnarray}\displaystyle & \displaystyle \unicode[STIX]{x1D613}_{ij}^{SC}=-\text{i}\unicode[STIX]{x1D6FC}\unicode[STIX]{x1D617}_{ij}^{3}+\frac{1}{Re}(-\unicode[STIX]{x1D60E}_{ij}^{\unicode[STIX]{x1D719}}-(\unicode[STIX]{x1D6FC}^{2}+\unicode[STIX]{x1D6FD}^{2})\unicode[STIX]{x1D614}_{ij}^{\unicode[STIX]{x1D719}}). & \displaystyle\end{eqnarray}$$
For the Shen–Chebyshev polynomials,
 $\unicode[STIX]{x1D647}^{\unicode[STIX]{x1D713}}$
and
 $\unicode[STIX]{x1D648}^{\unicode[STIX]{x1D719}}$
are sparse banded matrices. Therefore, the system (A 8) can be efficiently advanced in time, allowing us to compute the evolution matrix
 $\unicode[STIX]{x1D653}(t,t_{0})$
for a wide range of parameters. The amplification
 $G$
, equation (2.26), for the discrete case can then be computed as suggested in Trefethen et al. (Reference Trefethen, Trefethen, Reddy and Driscoll1993), Schmid & Henningson (Reference Schmid and Henningson2001) and Schmid (Reference Schmid2007). We write
 $$\begin{eqnarray}\boldsymbol{q}=\left(\begin{array}{@{}c@{}}\boldsymbol{w}\\ \unicode[STIX]{x1D73B}\end{array}\right),\end{eqnarray}$$
and note that the energy
 $E$
, equation (2.25), in the discrete case is given by
 $$\begin{eqnarray}E=\boldsymbol{q}^{\ast }\unicode[STIX]{x1D652}\boldsymbol{q},\end{eqnarray}$$
where
 $$\begin{eqnarray}\unicode[STIX]{x1D652}=\frac{1}{2}\left(\begin{array}{@{}cc@{}}\displaystyle \frac{1}{k^{2}}\unicode[STIX]{x1D642}^{\unicode[STIX]{x1D713}}+\unicode[STIX]{x1D648}^{\unicode[STIX]{x1D713}} & 0\\ \displaystyle 0 & \displaystyle \frac{1}{k^{2}}\unicode[STIX]{x1D648}^{\unicode[STIX]{x1D719}}\end{array}\right).\end{eqnarray}$$
Matrices
 $\unicode[STIX]{x1D642}^{\unicode[STIX]{x1D713}}$
,
 $\unicode[STIX]{x1D648}^{\unicode[STIX]{x1D713}}$
and
 $\unicode[STIX]{x1D648}^{\unicode[STIX]{x1D719}}$
are defined in (A 10), (A 9) and (A 12), respectively. The Cholesky factorization of
 $\unicode[STIX]{x1D652}$
is given by
 $$\begin{eqnarray}\boldsymbol{F}^{\text{T}}\boldsymbol{F}=\unicode[STIX]{x1D652}.\end{eqnarray}$$
The coefficients
 $\boldsymbol{q}(t)$
at time
 $t$
can be obtained by means of the evolution matrix
 $\unicode[STIX]{x1D653}$
:
 $$\begin{eqnarray}\boldsymbol{q}(t)=\unicode[STIX]{x1D653}(t,t_{0})\boldsymbol{q}_{0},\end{eqnarray}$$
where
 $\boldsymbol{q}_{0}$
is the initial condition at
 $t_{0}$
. From this it follows that
 $\unicode[STIX]{x1D653}(t_{0},t_{0})$
reduces to the identity matrix. The amplification
 $G$
can then be computed by
 $$\begin{eqnarray}\displaystyle G(\unicode[STIX]{x1D6FC},\unicode[STIX]{x1D6FD},t_{0},t,Re_{\unicode[STIX]{x1D6FF}}) & = & \displaystyle \max _{\boldsymbol{q}_{0}}\frac{\boldsymbol{q}(t)^{\dagger }\unicode[STIX]{x1D652}\boldsymbol{q}(t)}{\boldsymbol{q}_{0}^{\dagger }\unicode[STIX]{x1D652}\boldsymbol{q}_{0}},\end{eqnarray}$$
 $$\begin{eqnarray}\displaystyle & = & \displaystyle \max _{\boldsymbol{q}_{0}}\frac{\boldsymbol{q}_{0}^{\dagger }\unicode[STIX]{x1D653}^{\dagger }\unicode[STIX]{x1D652}\unicode[STIX]{x1D653}\boldsymbol{q}_{0}}{\boldsymbol{q}_{0}^{\dagger }\unicode[STIX]{x1D652}\boldsymbol{q}_{0}}\end{eqnarray}$$
 $$\begin{eqnarray}\displaystyle & = & \displaystyle \max _{\boldsymbol{b}}\frac{\boldsymbol{b}^{\dagger }\boldsymbol{F}^{-T}\unicode[STIX]{x1D653}^{\dagger }\unicode[STIX]{x1D652}\unicode[STIX]{x1D653}\boldsymbol{F}^{-1}\boldsymbol{b}}{\boldsymbol{b}^{\dagger }\boldsymbol{b}}\end{eqnarray}$$
 $$\begin{eqnarray}\displaystyle & = & \displaystyle \Vert \boldsymbol{F}\unicode[STIX]{x1D653}\boldsymbol{F}^{-1}\Vert ^{2},\end{eqnarray}$$
where the matrix norm
 $\Vert \boldsymbol{F}\unicode[STIX]{x1D653}\boldsymbol{F}^{-1}\Vert$
is given by the maximum singular value of
 $\boldsymbol{F}\unicode[STIX]{x1D653}\boldsymbol{F}^{-1}$
, (cf. Trefethen et al.
Reference Trefethen, Trefethen, Reddy and Driscoll1993; Schmid & Henningson Reference Schmid and Henningson2001; Schmid Reference Schmid2007).
The present method consists of two steps. First, the evolution matrix
 $\unicode[STIX]{x1D653}$
needs to be computed by solving equation (A 8) with the identity matrix as initial condition at time
 $t_{0}$
. Then the amplification
 $G$
can be computed using
 $\unicode[STIX]{x1D653}$
. In order to verify the well-functioning of the present time integration, the following manufactured solution has been used:
 $$\begin{eqnarray}w=\cos (\unicode[STIX]{x1D714}_{1}t)\sin ^{2}(5\unicode[STIX]{x03C0}z),\quad \unicode[STIX]{x1D701}=\cos (\unicode[STIX]{x1D714}_{2}t)\sin (3\unicode[STIX]{x03C0}z),\quad U_{base}=\cos (\unicode[STIX]{x1D714}_{3}t)(1-\exp (-2z)).\end{eqnarray}$$
A forcing term is defined by the resulting term, when injecting the above solution into (2.23) and (2.24). Equations (A 8) are advanced by means of the adaptive Runge-Kutta-Cash-Karp-54 time integrator included in the boost library. The absolute and relative error of the time integration are set to
 $10^{-10}$
. For verification, we use the above manufactured solution with the following parameter values:
 $$\begin{eqnarray}\left.\begin{array}{@{}c@{}}Re_{\unicode[STIX]{x1D6FF}}=123,\quad \unicode[STIX]{x1D6FC}=0.3,\quad \unicode[STIX]{x1D6FD}=0.234,\quad h=1,\quad \unicode[STIX]{x1D714}_{1}=1.234,\\ \unicode[STIX]{x1D714}_{2}=1.123,\quad \unicode[STIX]{x1D714}_{3}=0.4567,\quad t_{0}=0,\end{array}\right\}\end{eqnarray}$$
and compare reference and numerical solutions by computing a mean error on the Chebyshev knots. The behaviour of the error for increasing
 $N$
is displayed in figure 15. We observe that the error displays exponential convergence until approximately
 $10^{-9}$
, when the error contribution due to the time integration becomes dominant. In addition, the analytic solution of the energy of this problem can be used to verify parts of the amplification computation (results not shown).
Error convergence of the manufactured problem given by (A 30).

For validation purposes, the case of transient growth for Poiseuille flow with a Reynolds number
 $Re=1000$
and
 $\unicode[STIX]{x1D6FC}=1$
in Schmid (Reference Schmid2007) has been computed by means of the present method for
 $N=65$
. As can be seen from figure 16, the results by the present method correspond well to the data digitized from figure 3 in Schmid (Reference Schmid2007).
Furthermore, the validation with an unsteady base flow is performed by means of Stokes’ second problem whose base flow is given by
 $$\begin{eqnarray}U_{base}=\exp (-z)\cos \left(\frac{2}{Re_{\unicode[STIX]{x1D6FF}}}t-z\right).\end{eqnarray}$$
The results in Luo & Wu (Reference Luo and Wu2010) define a test case for the present method. In Luo & Wu (Reference Luo and Wu2010), the temporal evolution of eigenmodes of the Orr–Sommerfeld equation for
 $t_{0}=0$
is investigated. They consider three cases defined by
 $Re_{\unicode[STIX]{x1D6FF}}=1560$
,
 $1562.8$
and
 $1566$
and
 $\unicode[STIX]{x1D6FC}=0.3$
and
 $\unicode[STIX]{x1D6FD}=0$
. As initial condition, the eigenmodes corresponding to the following eigenvalues
 $\unicode[STIX]{x1D714}_{OSE}$
for each
 $Re_{\unicode[STIX]{x1D6FF}}$
are used:

Amplification
 $G(\unicode[STIX]{x1D6FC}=1,\unicode[STIX]{x1D6FD}=0,t_{0}=0,t,Re=1000)$
of the non-modal perturbation for Poiseuille flow. The present results collapse onto the data from figure 3 in Schmid (Reference Schmid2007).

As a main result from the investigation in Luo & Wu (Reference Luo and Wu2010), the maximum amplitude of the perturbation for
 $Re_{\unicode[STIX]{x1D6FF}}=1560$
decreases from cycle to cycle, whereas for
 $Re_{\unicode[STIX]{x1D6FF}}=1562.8$
the maximum amplitude displays almost no growth from cycle to cycle. However, for
 $Re_{\unicode[STIX]{x1D6FF}}=1566$
, the maximum amplitude increases from cycle to cycle. This can also be observed when using the present method, cf. figure 17, where we have used
 $N=97$
. The amplitude is in our case defined by the ratio between the perturbation energy at time
 $t$
and at time
 $t_{0}=0$
. Luo & Wu (Reference Luo and Wu2010) defined the amplitude differently, namely by the first coefficient of the expansion of the perturbation on all Orr–Sommerfeld modes. Therefore, the exact numerical values in figure 17 and in figure 7 in Luo & Wu (Reference Luo and Wu2010) are not comparable. When comparing the growth rate
 $\unicode[STIX]{x1D714}$
of the present perturbation, given by
 $$\begin{eqnarray}\unicode[STIX]{x1D714}=\frac{1}{E}\frac{\text{d}E}{\text{d}t},\end{eqnarray}$$
with the growth rate given by the real part of the eigenvalue resulting from the Orr–Sommerfeld equation for the case
 $Re_{\unicode[STIX]{x1D6FF}}=1566$
, we confirm the observation by Luo & Wu (Reference Luo and Wu2010, figure 10) that during one cycle the growth rate is relatively well approximated by the Orr–Sommerfeld solution. In addition, the growth rate taken from figure 10 in Luo & Wu (Reference Luo and Wu2010) by digitization follows closely the present one, even if the definition of the amplitude is a different one (cf. figure 18).
Temporal evolution of the amplitude
 $E/E_{0}$
when advancing the Orr–Sommerfeld eigenmode at time
 $t_{0}=0$
forward in time with the present method.

Growth rate of the perturbation when advancing the Orr–Sommerfeld eigenmode at time
 $t_{0}=0$
forward in time with the present method.

Returning to the present flow, we shall consider the case
 $$\begin{eqnarray}Re_{\unicode[STIX]{x1D6FF}}=1000,\quad \unicode[STIX]{x1D6FC}=0.6,\quad \unicode[STIX]{x1D6FD}=0.14,\quad h=30,\quad t_{0}=0,\quad t=6,\end{eqnarray}$$
for determining the discretization parameters. Before solving the non-modal equations (A 8), the base flow solution needs to be generated. This is done by numerically solving the boundary layer equations (2.3)–(2.6), applying the same discretization techniques as for the non-modal equations (2.23) and (2.24). The present boundary layer solver has been verified by comparison to the solution obtained by means of the integral formula in Liu et al. (Reference Liu, Park and Cowen2007). An important ingredient in the numerical solution of the boundary layer equations (2.3)–(2.6) is the choice of a finite value
 $t_{-\infty }$
for imposing the boundary condition (2.5). As the outer flow dies off exponentially towards
 $t\rightarrow \pm \infty$
, we choose
 $t_{-\infty }=-8$
and
 $t_{-\infty }=-12$
as starting point. For these values, the magnitude of the outer flow amounts to
 $U_{outer}(t_{-\infty }=-8)=4.50141\times 10^{-7}$
and
 $U_{outer}(t_{-\infty }=-12)=1.51005\times 10^{-10}$
, respectively. Choosing
 $N=129$
, we solve the above non-modal example problem, equation (A 34), for
 $U_{base}$
computed with
 $t_{-\infty }=-8$
and
 $t_{-\infty }=-12$
. The resulting amplification
 $G$
is given by
 $$\begin{eqnarray}\displaystyle & \displaystyle G(0.6,0.14,0,6,1000)=1.11855\times 10^{9}\quad \text{for }t_{-\infty }=-8, & \displaystyle\end{eqnarray}$$
 $$\begin{eqnarray}\displaystyle & \displaystyle G(0.6,0.14,0,6,1000)=1.11869\times 10^{9}\quad \text{for }t_{-\infty }=-12. & \displaystyle\end{eqnarray}$$
Choosing
 $t_{-\infty }=-12$
and varying the number of Chebyshev polynomials
 $N$
, we observe the following values for
 $G$
:

For the simulations in § 3, computations with
 $N=97$
and
 $N=129$
have been performed to ensure that the results are accurate.
Appendix B. Scaling of the initial condition for streamwise streaks
For streamwise streaks (
 $\unicode[STIX]{x1D6FC}=0$
), we have the governing equations given by (3.1) and (3.2). We shall first find the general solution of
 $\tilde{\unicode[STIX]{x1D701}}$
.
The sine transform of
 $\tilde{\unicode[STIX]{x1D701}}$
is defined as
 $$\begin{eqnarray}\unicode[STIX]{x1D6E9}(\unicode[STIX]{x1D6FE},t)=\int _{0}^{\infty }\tilde{\unicode[STIX]{x1D701}}\sin (\unicode[STIX]{x1D6FE}z)\,\text{d}z.\end{eqnarray}$$
Taking the sine transform of (3.2) gives us
 $$\begin{eqnarray}\frac{\unicode[STIX]{x2202}}{\unicode[STIX]{x2202}t}\unicode[STIX]{x1D6E9}+\frac{1}{2}(\unicode[STIX]{x1D6FE}^{2}+\unicode[STIX]{x1D6FD}^{2})\unicode[STIX]{x1D6E9}-F=0,\end{eqnarray}$$
where
 $$\begin{eqnarray}F(\unicode[STIX]{x1D6FE},t)=\text{i}\unicode[STIX]{x1D6FD}\int _{0}^{\infty }w\text{D}U_{base}\sin (\unicode[STIX]{x1D6FE}z)\,\text{d}z.\end{eqnarray}$$
Solving (B 2) gives us for
 $\unicode[STIX]{x1D6E9}$
:
 $$\begin{eqnarray}\unicode[STIX]{x1D6E9}(\unicode[STIX]{x1D6FE},t)=\left(\unicode[STIX]{x1D6E9}(\unicode[STIX]{x1D6FE},0)+\int _{0}^{t}\frac{F(\unicode[STIX]{x1D6FE},\unicode[STIX]{x1D70F})}{\text{e}^{-(1/2)(\unicode[STIX]{x1D6FD}^{2}+\unicode[STIX]{x1D6FE}^{2})\unicode[STIX]{x1D70F}}}\,\text{d}\unicode[STIX]{x1D70F}\right)\text{e}^{-(1/2)(\unicode[STIX]{x1D6FD}^{2}+\unicode[STIX]{x1D6FE}^{2})t}.\end{eqnarray}$$
The general solution of
 $\tilde{\unicode[STIX]{x1D701}}$
can thus be written as
 $$\begin{eqnarray}\displaystyle \tilde{\unicode[STIX]{x1D701}} & = & \displaystyle \frac{2}{\unicode[STIX]{x03C0}}\int _{0}^{\infty }\unicode[STIX]{x1D6E9}(\unicode[STIX]{x1D6FE},0)\text{e}^{-(1/2)(\unicode[STIX]{x1D6FD}^{2}+\unicode[STIX]{x1D6FE}^{2})t}\sin (\unicode[STIX]{x1D6FE}z)\,\text{d}\unicode[STIX]{x1D6FE}\nonumber\\ \displaystyle & & \displaystyle +\,\frac{2}{\unicode[STIX]{x03C0}}\int _{0}^{\infty }\text{e}^{-(1/2)(\unicode[STIX]{x1D6FD}^{2}+\unicode[STIX]{x1D6FE}^{2})t}\int _{t_{0}}^{t}\frac{F(\unicode[STIX]{x1D6FE},\unicode[STIX]{x1D70F})}{\text{e}^{-(1/2)(\unicode[STIX]{x1D6FD}^{2}+\unicode[STIX]{x1D6FE}^{2})\unicode[STIX]{x1D70F}}}\,\text{d}\unicode[STIX]{x1D70F}\sin (\unicode[STIX]{x1D6FE}z)\,\text{d}\unicode[STIX]{x1D6FE}.\end{eqnarray}$$
Motivated by the findings in § 3.2.2, we shall assume that, in the asymptotic limit
 $Re_{\unicode[STIX]{x1D6FF}}\rightarrow \infty$
, the initial condition of
 $w$
and
 $\tilde{\unicode[STIX]{x1D701}}$
can approximately be written as
 $$\begin{eqnarray}w=w_{m}(Re_{\unicode[STIX]{x1D6FF}}){\hat{w}}(z,t_{0}),\quad \tilde{\unicode[STIX]{x1D701}}=\unicode[STIX]{x1D701}_{m}(Re_{\unicode[STIX]{x1D6FF}})\hat{\unicode[STIX]{x1D701}}(z,t_{0}),\end{eqnarray}$$
where only the coefficients
 $w_{m}$
and
 $\unicode[STIX]{x1D701}_{m}$
depend on
 $Re_{\unicode[STIX]{x1D6FF}}$
. Subsequently, using (B 5), we can write
 $w$
and
 $\tilde{\unicode[STIX]{x1D701}}$
as
 $$\begin{eqnarray}\displaystyle & \displaystyle \tilde{\unicode[STIX]{x1D701}}=\unicode[STIX]{x1D701}_{m}a(z,t)+w_{m}b(z,t), & \displaystyle\end{eqnarray}$$
 $$\begin{eqnarray}\displaystyle & \displaystyle w=w_{m}c(z,t), & \displaystyle\end{eqnarray}$$
where
 $a$
,
 $b$
and
 $c$
are some functions of
 $z$
and
 $t$
, with
 $b(z,t_{0})=0$
. The energy
 $E=E_{w}+E_{\unicode[STIX]{x1D701}}$
, equation (2.25), is then given by
 $$\begin{eqnarray}\displaystyle & \displaystyle E_{w}(t)=w_{m}^{2}\frac{1}{2}\int _{0}^{\infty }\frac{1}{\unicode[STIX]{x1D6FD}^{2}}|\text{D}c|^{2}+|c|^{2}\,\text{d}z, & \displaystyle\end{eqnarray}$$
 $$\begin{eqnarray}\displaystyle & \displaystyle E_{\unicode[STIX]{x1D701}}(t)=\frac{1}{2}\frac{Re_{\unicode[STIX]{x1D6FF}}^{2}}{4}\int _{0}^{\infty }\frac{1}{\unicode[STIX]{x1D6FD}^{2}}(\unicode[STIX]{x1D701}_{m}^{2}a^{2}+2\unicode[STIX]{x1D701}_{m}w_{m}ab+w_{m}^{2}b^{2})\,\text{d}z. & \displaystyle\end{eqnarray}$$
We can thus write
 $$\begin{eqnarray}\displaystyle & \displaystyle E_{w}(t_{0})=w_{m}^{2}A_{0}, & \displaystyle\end{eqnarray}$$
 $$\begin{eqnarray}\displaystyle & \displaystyle E_{w}(t)=w_{m}^{2}A_{1}, & \displaystyle\end{eqnarray}$$
 $$\begin{eqnarray}\displaystyle & \displaystyle E_{\unicode[STIX]{x1D701}}(t_{0})=Re_{\unicode[STIX]{x1D6FF}}^{2}\unicode[STIX]{x1D701}_{m}^{2}B_{0}, & \displaystyle\end{eqnarray}$$
 $$\begin{eqnarray}\displaystyle & \displaystyle E_{\unicode[STIX]{x1D701}}(t)=Re_{\unicode[STIX]{x1D6FF}}^{2}(\unicode[STIX]{x1D701}_{m}^{2}B_{1}+2\unicode[STIX]{x1D701}_{m}w_{m}B_{2}+w_{m}^{2}B_{3}), & \displaystyle\end{eqnarray}$$
where
 $A_{0}$
,
 $A_{1}$
,
 $B_{0}$
,
 $B_{1}$
,
 $B_{2}$
and
 $B_{3}$
are independent of
 $Re_{\unicode[STIX]{x1D6FF}}$
. The normalization constraint for the initial condition reads
 $$\begin{eqnarray}E_{w}(t_{0})+E_{\unicode[STIX]{x1D701}}(t_{0})=w_{m}^{2}A_{0}+Re_{\unicode[STIX]{x1D6FF}}^{2}\unicode[STIX]{x1D701}_{m}^{2}B_{0}=1,\end{eqnarray}$$
from which we find
 $$\begin{eqnarray}w_{m}^{2}=\frac{1}{A_{0}}(1-Re_{\unicode[STIX]{x1D6FF}}^{2}B_{0}\unicode[STIX]{x1D701}_{m}^{2}).\end{eqnarray}$$
As the right-hand side needs to be positive for all
 $Re_{\unicode[STIX]{x1D6FF}}$
, this motivates the following ansatz for
 $\unicode[STIX]{x1D701}_{m}$
in the limit of
 $Re_{\unicode[STIX]{x1D6FF}}\rightarrow \infty$
:
 $$\begin{eqnarray}\unicode[STIX]{x1D701}_{m}=\frac{d}{Re_{\unicode[STIX]{x1D6FF}}^{\unicode[STIX]{x1D703}}},\end{eqnarray}$$
where
 $\unicode[STIX]{x1D703}\geqslant 1$
and
 $d$
is some constant. For the energy at time
 $t$
, we can write
 $$\begin{eqnarray}\displaystyle E(t) & = & \displaystyle w_{m}^{2}A_{1}+Re_{\unicode[STIX]{x1D6FF}}^{2}(\unicode[STIX]{x1D701}_{m}^{2}B_{1}+2\unicode[STIX]{x1D701}_{m}w_{m}B_{2}+w_{m}^{2}B_{3})\nonumber\\ \displaystyle & = & \displaystyle \frac{1}{A_{0}}\left(2dRe_{\unicode[STIX]{x1D6FF}}^{-\unicode[STIX]{x1D703}+2}\sqrt{A_{0}}B_{2}\sqrt{(Re_{\unicode[STIX]{x1D6FF}}^{2\unicode[STIX]{x1D703}}-B_{0}Re_{\unicode[STIX]{x1D6FF}}^{2}d^{2})Re_{\unicode[STIX]{x1D6FF}}^{-2\unicode[STIX]{x1D703}}}\right.\nonumber\\ \displaystyle & & \displaystyle +\left.d^{2}(A_{0}B_{1}-A_{1}B_{0})Re_{\unicode[STIX]{x1D6FF}}^{2-2\unicode[STIX]{x1D703}}-Re_{\unicode[STIX]{x1D6FF}}^{-2\unicode[STIX]{x1D703}+4}B_{0}B_{3}d^{2}+B_{3}Re_{\unicode[STIX]{x1D6FF}}^{2}+A_{1}\right).\end{eqnarray}$$
As the energy is maximum for the optimal perturbation, we must have
 $$\begin{eqnarray}\frac{\unicode[STIX]{x2202}E}{\unicode[STIX]{x2202}\unicode[STIX]{x1D703}}=0.\end{eqnarray}$$
Solving this equation for
 $\unicode[STIX]{x1D703}$
gives us four solutions:
 $$\begin{eqnarray}\unicode[STIX]{x1D703}_{1,2,3,4}=\frac{1}{2}\frac{1}{\ln (Re_{\unicode[STIX]{x1D6FF}})}\left(-\text{ln}\,(2)+2\ln \left(\pm \frac{d}{B_{2}}\sqrt{\frac{F_{\pm }}{A_{0}}}\right)\right),\end{eqnarray}$$
where
 $$\begin{eqnarray}\displaystyle F_{\pm } & = & \displaystyle \pm \sqrt{D}+(B_{3}^{2}Re_{\unicode[STIX]{x1D6FF}}^{4}+2A_{1}B_{3}Re_{\unicode[STIX]{x1D6FF}}^{2}+A_{1}^{2})B_{0}^{2}\nonumber\\ \displaystyle & & \displaystyle +\,[(-2B_{1}B_{3}+4B_{2}^{2})Re_{\unicode[STIX]{x1D6FF}}^{2}-2A_{1}B_{1}]A_{0}B_{0}+A_{0}^{2}B_{1}^{2}\end{eqnarray}$$
and
 $$\begin{eqnarray}\displaystyle D & = & \displaystyle [(-B_{3}Re_{\unicode[STIX]{x1D6FF}}^{2}-A_{1})B_{0}+A_{0}B_{1}]^{2}\nonumber\\ \displaystyle & & \displaystyle \times \,\{(B_{3}Re_{\unicode[STIX]{x1D6FF}}^{2}+A_{1})^{2}B_{0}^{2}-2A_{0}[(B_{1}B_{3}-2B_{2}^{2})Re_{\unicode[STIX]{x1D6FF}}^{2}+A_{1}B_{1}]B_{0}+A_{0}^{2}B_{1}^{2}\}.\end{eqnarray}$$
Taking the limit
 $Re_{\unicode[STIX]{x1D6FF}}\rightarrow \infty$
, we obtain
 $$\begin{eqnarray}\lim _{Re_{\unicode[STIX]{x1D6FF}}\rightarrow \infty }\unicode[STIX]{x1D703}_{i}=2\quad \text{for }i=1,2,3,4.\end{eqnarray}$$
From this it follows that for
 $Re_{\unicode[STIX]{x1D6FF}}\gg 1$
we have approximately
 $$\begin{eqnarray}\tilde{\unicode[STIX]{x1D701}}(z,t_{0})\propto \frac{1}{Re_{\unicode[STIX]{x1D6FF}}^{2}},\end{eqnarray}$$
from which relation (3.21) can be obtained directly.