1. The toxic asset
Poterba (Reference Poterba2004) makes the compelling argument that the face value of 401(k)s, individual retirement account (IRAs), and other tax-deferred assets (or TDA) cannot be directly valued together with other components of household wealth such as houses, stocks, and bonds. The rationale is that TDA carry a substantial deferred tax liability on withdrawal. Thus, for example, an IRA valued at $1,000 can yield considerably less than a $1,000 when the asset is ‘cashed out’. Indeed, my accountant refers to these instruments as ‘toxic assets’ because their withdrawal value is typically much less than their face value. As Poterba notes, ‘…deferred taxes … can make a dollar held inside a retirement saving account worth less at retirement than a dollar held in a similar asset outside such an account…’ (p. 490). Poterba is mainly concerned with the issue of whether the (post-tax) rate of return is higher with a TDA or directly investing in stocks and bonds. Interestingly, he finds that the answer depends on factors such as the income level of the investor, the time horizon, and the tax treatment of interest and dividends.
The motivation here is quite different. It is to compare time trends in wealth levels and wealth inequality and by socio-economic characteristic with and without netting out this implicit tax liability. I also consider how netting out income taxes due on accrued capital gains impacts wealth trends. This will be conducted for both conventional net worth (NW) and augmented wealth (AW) – the sum of NW, defined benefit pension wealth (DBW), and Social Security wealth (SSW). The empirical analysis covers the period from 1983 to 2016 based on data from the Federal Reserve Board's Survey of Consumer Finances (SCF).
Four measures are used. (1) The first is the conventional definition of (pre-tax) household wealth, NW, in which TDA are valued at their face value. (2) The second is the post-tax value. To convert TDA to a post-tax value, it is necessary to subtract out the accumulated taxes due on these instruments. These withdrawals are taxed as ordinary income. In 2016, the top tax rate on ordinary income was 39.6%. Other assets such as stocks and bonds may have capital gains tax (CGTAX) due on liquidation, so they must be adjusted accordingly. Long-term capital gain is a tax-preference source of income. The CGTAX was subject to a maximum rate of 20% according to 2016 tax rules. (3) The third is the bequest value (BV). This is the value of an estate when it passes to its beneficiaries (the ‘estate value’) plus the value of death benefits. It is first of note that even when received in a will, TDA are still subject to income taxes at ordinary income rates on withdrawal, and required minimum distributions (RMDs) carry over.Footnote 1 There is no escaping the tax liability (that is another reason why my accountant calls them ‘toxic assets’). However, in contrast to post-tax NW, all other assets are valued on a ‘step-up in basis’, according to current and past-tax rules. This means that any accrued capital gains are ‘forgiven’ and not subject to income tax on withdrawal, so that the after-tax value of these assets is their current market value at the time the estate is probated. (4) The fourth is the net bequest value, which is the BV net of estimated estate taxes due on death.
Compared to earlier research on this subject, notably Looney and Moore (Reference Looney and Moore2016), this paper makes three important contributions. First, it includes an analysis of AW. Second, it introduces the concept of BV. Third, it provides a socio-demographic breakdown of the impact of taxes on NW.
The rest of the paper is organized as follows. Section 2 provides a review of pertinent literature. Section 3 offers details on data sources and methods. Section 4 provides results on basic wealth trends in standard NW. Section 5 shows similar time trends for AW. Section 6 compares levels and trends between pre-tax and post-tax wealth. Section 7 introduces the concept of BV and makes comparisons between BV (and net BV) and NW. Section 8 provides details by demographic characteristics and income and wealth class. Sensitivity analysis is conducted in Section 9. Concluding remarks are provided in Section 10.
2. Literature review
Several studies document a surge in wealth inequality from the 1980s through the 2010s. Pfeffer et al. (Reference Pfeffer, Danziger and Schoeni2013), making use of the Panel Study of Income Dynamics and SCF data, analyze trends in wealth over the Great Recession from 2007 to 2011. They find that in percentage terms the losses were greater for less advantaged groups as measured by minority status, education, and pre-recession income and wealth, leading to a substantial rise in wealth inequality in just a few years. Saez and Zucman (Reference Saez and Zucman2016) convert income flows to wealth stocks by taking the reciprocal of the rate of return and multiplying the flow by the reciprocal (the so-called ‘capitalization method’). With this method, they use federal income tax data to reconstruct the U.S. wealth distribution from 1913 to 2013. One of their most important findings is the sharp rise of the share of total household wealth owned by the top 0.1% from the beginning of the 1990s from about 10% to about 23% in 2013.
This finding appears to be sensitive to the method and data used. Smith et al. (Reference Smith, Zidar and Zwick2019), for example, use the capitalization method but account for heterogeneity of rates of return within asset classes. This leads to a much smaller wealth share of the top 0.1% in 2013 of about 15%. Bricker et al. (Reference Bricker, Henriques, Krimmel and Sabelhaus2015, Reference Bricker, Krimmel, Henriques and Sabelhaus2016) use the SCF augmented by the Forbes list of the 400 wealthiest Americans. They match some results of Saez and Zucman (Reference Saez and Zucman2016), but their estimated share of the top 0.1% for 2013 is about 6 percentage points lower and the trajectory of the top 0.1% wealth share more closely matches Smith et al. (Reference Smith, Zidar and Zwick2019) than Saez and Zucman.
Other methods and other inequality indices offer evidence in support of the rising trend in wealth inequality. Wolff (Reference Wolff2017) uses data from the SCF to show the evolution of the Gini index of NW over time and finds a marked increase in the Gini from 2007 to 2010. He also finds an upward trend of the top 1% wealth share from 2001 onward. Bricker et al. (Reference Bricker, Hansen and Volz2019) pursue imputation and augmentation techniques for the SCF, in particular a Pareto imputation of the top-tail and augmentation by the Forbes 400 list. Both techniques increase the top 1% wealth share by about 1.5 percentage points. They also find the same upward trend in the top 1% share found by Wolff (Reference Wolff2017). All these analyses are based on standard before-tax NW. Of particular interest here is whether the same time trends hold up for after-tax NW.
Besides Poterba (Reference Poterba2004), there are only two papers that I am aware of that have been written on the topic of estimating after-tax wealth. The first is Wolff (Reference Wolff2011) in which NW, defined pension, and SSW are valued net of federal income taxes due on withdrawal. The empirical analysis is conducted for years 1983–2007 using the SCF. Taxes on accrued capital gains and estate taxes are not included in the analysis. The results show that post-tax AW grew slower over the period compared to pre-tax AW but the difference is relatively small. Moreover, netting out implicit taxes on pension and SSW barely affected the measured inequality of AW or its trend over time.
Looney and Moore (Reference Looney and Moore2016) perform a similar analysis for 1989–2013 using the SCF. Their tax analysis is based on current household income. They also include taxes on accrued capital gains. They base their analysis only on household NW (not on AW). However, their results are quite similar. They find almost no difference in the growth rate of mean after-tax NW compared to mean before-tax NW. They also report little effect of moving from a pre-tax to a post-tax basis on measured NW inequality.
This paper adds to Looney and Moore in several ways. The three most important are, first, that it includes an analysis of AW. Second, it adds the concept of BV. Third, it provides a socio-demographic breakdown of the impact of taxes on NW. Other differences are, first, that the empirical analysis begins in 1983 instead of 1989. This is important because 1983 precedes the huge run-up in defined contribution pension accumulations. Moreover, federal tax rates were higher in 1983 than in 1989. Second, the concept of TDA is extended to include annuities and life insurance. Third, there is an important difference in basic methodology between this paper and Looney and Moore, as detailed in footnote 7. Fourth, I provide separate estimates for age groups 46 and under and 47 and over. This is important because results differ appreciably between these two groups.
My results show more pronounced differences between before- and after-tax wealth (even from 1989 onward) and particularly in growth rates over time compared to Looney and Moore. One implication is that conventional (pre-tax) figures have been overstating NW (and AW) growth. However, like them, I find little effect on inequality levels or trends.
3. Data sources and methods
The primary data sources used for this study are the 1983, 1989, 2001, 2007, 2010, and 2016 SCF conducted by the Federal Reserve Board. Each survey consists of a core representative sample combined with a high-income supplement. Starting in 1989, the high-income supplement is selected as a list sample derived from tax data by the Statistics of Income Division of the Internal Revenue Service (SOI). This second sample is designed to disproportionately select families that were likely to be relatively wealthy. Typically, about two-thirds of the cases come from the representative sample and one-third from the high-income supplement.
The basic wealth concept used here is standard (pre-tax) wealth (or net worth) NW, which is defined as the current value of all marketable or fungible assets less the current value of debts. Total assets are the sum of: (1) housing; (2) other real estate; (3) bank deposits, certificates of deposit, and money market accounts; (4) financial securities; (5) the cash surrender value of life insurance; (6) defined contribution pension plans, including IRAs and 401(k) plans; (7) corporate stock and mutual funds; (8) unincorporated businesses; and (9) trust funds. Total liabilities are the sum of: (1) mortgage debt, (2) consumer debt, and (3) other debt. These values are based on face value as is conventional in almost all analyses of household wealth.
This measure reflects wealth as a store of value and therefore a source of potential consumption. I believe that this is the concept that best reflects the level of well-being associated with a family's holdings. Thus, only assets that can be readily converted to cash (i.e., ‘fungible’ ones) are included. As a result, consumer durables such as automobiles are excluded here since these items are not easily marketed, with the possible exception of vehicles, or their resale value typically far understates the value of their consumption services to the household. Another justification for their exclusion is that this treatment is consistent with the national accounts, where purchase of vehicles is counted as expenditures, not savings. As a result, my estimates of household wealth will differ from those provided by the Federal Reserve Board, which includes the value of vehicles (see, e.g., Bricker et al., Reference Bricker, Henriques, Krimmel and Sabelhaus2015).
Also excluded in the concept of NW is the value of future Social Security benefits the family may receive upon retirement (‘Social Security wealth’), as well as the value of retirement benefits from private pension plans (‘pension wealth’). Even though these funds are a source of future income, they are not in their direct control and cannot be marketed. The value of these two components will be included in a measure of AW (see Section 4).
The empirical analysis focuses on years 1983, the first data point; 1989; and 2007, peak (or near-peak) years of the business cycle; and 2016, the last year of data. I provide results separately for age groups 46 and under and 47 and over. I use actual reported income in the survey year as the basis of the tax calculation. Following Poterba, this is an ex ante formulation. This is not really a problem for current retirees. However, for those currently working, it might be better to use income projections to retirement (or even to age 70.5 or 72 when the RMD becomes operative) in order to estimate the effective ex post marginal tax rate (MTR) for TDA and the CGTAX. I provide such income projections for year 2016 in Section 9. However, the base tax calculations are performed using the NBER TAXSIM modelFootnote 2 on the basis of current income and tax rules.
4. Basic wealth trends for standard net worth, 1983–2016
I begin with descriptive statistics. This will establish a baseline for the rest of the analysis. Median wealth in real terms increased at a little less than 1% per year from 1983 to 2001, and then much faster at 2.91% from 2001 to 2007 (see Table 1).Footnote 3 Then between 2007 and 2010, median wealth plunged by a staggering 43.9%. The primary reasons were the collapse in the housing market and the high leverage of middle-class families. Median wealth then rebounded by 17.6% from 2010 to 2016, although it was still 34.0% below its peak in 2007 (and even below its value in 1983).
Basic trends in NW, 1983–2016 (dollar figures are in thousands, 2016 dollars)

Results are based on pre-tax values.
Wealth figures are deflated using the consumer price index (CPI-U-RS).
a Percentage change for lines 1 and 2; actual change for line 3.
Source: Author's computations from the 1983, 1989, 2001, 2007, 2010, and 2016 SCF.
Mean NW grew faster, by 2.01% per year from 1983 to 1989, by 2.73% per year from 1989 to 2001, and by 3.11% per year from 2001 to 2007, due to the rapid increase in housing prices. The Great Recession saw an absolute decline in mean household wealth. However, although median wealth plunged by 43.9% between 2007 and 2010, mean wealth fell by (only) 16.0%. The main causes were falling housing and stock prices. Years 2010–16 did finally see a full recovery in mean wealth, rising by 28.4%, 7.8% above its previous 2007 peak.
The figures in row 3 show that wealth inequality increased from 1983 to 1989 (by 0.029 Gini points) and then remained virtually unchanged from 1989 to 2007, at least according to the Gini coefficient. Years 2007–10 saw a sharp elevation in wealth inequality, with the Gini coefficient rising by 0.032. From 2010 to 2016, there was a small rise in the Gini coefficient.
Panel A of Table 2 shows the portfolio composition of household wealth among all households. In 2016, owner-occupied housing accounted for 25.1% of total assets. Liquid assets made up 6.7% and pension accounts, notably, 15.6%. Corporate stock together with financial securities, mutual funds, and personal trusts amounted to 20.8%. Real estate other than homes plus business equity comprised another 30.5%. Perhaps, the most notable development over time from the standpoint of this paper is that pension accounts mushroomed from 1.5% in 1983 to 15.6% in 2016. This increase largely offset the decline in the share of liquid assets in total assets, from 17.4% to 6.7%.
Composition of household wealth (percent of gross assets)

Brackets for 2016 are:
Top 1%: NW of $10,257,000 or more.
Next 19%: NW between $471,600 and $10,257,000.
Quintiles 2 through 4: NW between $0 and $471,600.
a IRAs, Keogh plans, 401(k) plans, the accumulated value of defined contribution pension plans, and other retirement accounts.
b Gold and other precious metals, royalties, jewelry, antiques, furs, loans to friends and relatives, future contracts, and miscellaneous assets.
c Households are classified into wealth class according to their NW.
Source: Author's computations from the 1983, 1989, 2001, 2007, 2010, and 2016 SCF.
The tabulation in panel A provides a picture of the average holdings of all families in the economy, but there are marked differences by wealth class. As shown in panel B, the richest 1% of households invested 80.4% of their savings in investment real estate, businesses, corporate stock, and financial securities in 2016. Housing accounted for only 7.6% of their wealth, liquid assets for 4.6%, and pension accounts for another 6.0%. Among the next richest 19%, housing comprised of 25.6% of their total assets, liquid assets 7.7%, and pensions another 22.4%. Investment assets – real estate, business equity, stocks, and bonds – made up 43.1%. In contrast, over three-fifths of the assets of the middle three wealth quintiles of households were invested in their own home in 2016. Another quarter went into monetary savings of one form or another and pension accounts. Together housing, liquid assets, and pension assets accounted for 87.0% of their total assets.
5. Trends in augmented wealth, 1989–2016
I next add in DBW and SSW to the household portfolio. How does the inclusion of these two components affect wealth trends?
The SCF provides considerable details on both pension plans and Social Security contributions. The SCF also gives detailed information on expected pension and Social Security benefits for both husband and wife. The imputation of both DBW and SSW involves a large number of steps which are summarized in the appendix. I use here the standard gross measure, since it is the conventional formulation. It should also be noted that this definition of DBW and SSW is based on the conventional ‘on-going concern’ assumption where it is assumed that employees continue to work at their place of employment until their expected date of retirement.
I define ‘non-pension wealth’ NWX as marketable household wealth (NW) minus defined contribution wealth (DCW):

and pension wealth (PW) as:

Augmented household wealth, AW, is given by

I begin the empirical analysis by looking at PW for all households in Table 3. I show results for 1989, the first year with full data; 2016, the last year; and 2007 since it is a critical turning point.Footnote 4 One of the most dramatic changes in the retirement income system has been the replacement of many traditional DB plans with DC pensions. The picture that unfolds is a precipitous drop in DB coverage among all households more than compensated by a sizeable increase in DC coverage, at least until 2007. Moreover, although mean PW gained rapidly from 1989 to 2007, it grew more slowly from 2007 to 2016.
Retirement Wealth and AW, all households, 1989–2016 (in thousands, 2016 dollars)

Wealth figures are deflated using the consumer price index (CPI-U-RS). Key: Augmented Wealth (AW) = NWX + DCW + DBW + SSW.
a Actual change for Gini coefficients.
Source: Author's computations from the 1989, 2007, and 2016 SCF.
Among all households, mean DCW surged by a factor of 6.0 between 1989 and 2007, whereas mean DBW rose by only 4.6%. Overall average PW climbed by 98.7%. Mean DCW continued to expand over the Great Recession and by 2016 was 34.2% above its 2007 level, whereas mean DBW gained 17.0% over 2007. Overall, mean PW was up by 26.6% from 2007. Over the full 1989–2016 period, mean PW advanced 151.5%. This compares to an 80.2% gain in mean NW. The growth in PW was led by DCW, which climbed almost ten-fold, whereas DBW rose by 22.3%.
Mean SSW advanced by 66.5% from 1989 to 2016, less than half as fast as PW. Median SSW grew a bit slower. Mean AW rose 70.2%, slower than that of NW because of the relatively smaller gains in DBW. For all components of wealth (except for DBW), there were robust gains from 1989 to 2007, followed by much smaller gains over years 2007–16.
Median values of NW and AW display quite a different pattern. From 1989 to 2016, median NW showed an absolute loss of 13.9% whereas median AW showed a positive gain of 22.9%, considerably less than that of mean AW. The maximum value was reached in 2007 for both. This was followed by a drop-off from 2007 to 2016, although it was much less severe for median AW, −7.4%, than for median NW.
Panel C shows inequality trends. The Gini coefficient for PW remained steady over time and was almost exactly the same in 2016 as in 1989. The Gini coefficient for SSW was much lower than that for PW and actually dropped a bit over these years, whereas the Gini coefficient for NW rose by 0.049 over these years. The addition of DBW and SSW to NW to create AW lowers measured inequality since DBW and SSW tend to be concentrated among the middle class (see Table 8). In 2016, the Gini coefficient was reduced by 0.166 points from 0.877 to 0.711.
6. Trends in post-tax net worth
So far, a pre-tax valuation has been applied to wealth. However, contributions to DC plans are tax sheltered or tax deferred when they are made but subject to income tax on withdrawal.Footnote 5 As a result, their post-tax value is lower than the pre-tax market value. Similarly, DB pension benefits (and lump-sum distributions) are fully taxable on receipt and Social Security benefits are partially taxable, so that their post-tax value will be lower than their pre-tax value. Moreover, the sale of other assets may be subject to a CGTAX.
I use the household's current income to calculate marginal tax rates (MTRs). I first calculate tax rates for each individual SCF household based on their income, family structure, deductions, and other characteristics for the year prior to the survey year using NBER TAXSIM.Footnote 6 This program is based on the federal income tax code as of the year preceding the survey year and provides estimates of tax rates for each SCF household. The initial baseline estimate excludes any realizations of capital gains or withdrawals from retirement accounts beyond those reported in the SCF questions about prior year sources of income. This leads to an estimation of the MTR on all components of income except for Social Security income.Footnote 7 I also treat the taxation of social security benefits according to the tax code current at the time of the survey.Footnote 8 I can then compute the MTR on Social Security income, SSMTR.
DCW consists of all IRAs, Keogh accounts, 401(k), and other tax-deferred retirement accounts. Following Poterba (Reference Poterba2004), let us define TDA as total tax deferred assets. As noted above, Roth IRAs (‘ROTH’) are not subject to income taxes on withdrawal. Rather, the funds invested in these instruments are deposited on an after-tax basis.Footnote 9 As a result, Roth IRAs are excluded from TDA and are treated like non-DCW investments.
Annuities are not included in DCW. They are of two types. First, some annuities pay out a steady stream of income over the (remaining) life of the beneficiary but the value of the annuity goes to zero at the death of the beneficiary. I ignore this type of annuity in my calculation of TDA. Second, other annuities function like an investment account where the money that is put in accumulates over time. This money can be invested in stocks, bonds, and other assets. Typically, money invested in these accounts is in whole or in part tax deferred like an IRA. The SCF data do not indicate what portion of the second type of annuity is taxable on withdrawal. For simplicity, I assume that half the value of this type of annuity (‘ANNUITY’) is subject to taxes on withdrawal.
Life insurance is also of two types. The first is whole life insurance. This has both a savings component and a death benefit. The second is term life insurance which provides only a death benefit. Only the savings portion of whole life insurance is included as a part of NW. Similar to annuities, money invested in these accounts is in whole or in part tax deferred, with tax-free accumulations until withdrawal, which is treated as ordinary income for income tax purposes. Once again, it is not possible to determine what share of the accumulation is principal and what portion is taxable on withdrawal. For convenience, I again assume that half the value of this type of asset (‘CASHLI’) is subject to income taxes on withdrawal. Then:

and taxes due on withdrawals from TDA are given byFootnote 10:

We are now part way to computing post-tax NW. Most assets are subject to a capital gains tax on the sale of the asset, so that this tax liability should also be netted out from the value of an asset to obtain a post-tax value. The SCF does provide a calculation of the accrued capital gains on housing and other real estate, stocks, bonds, mutual funds, and businesses. Correspondingly, I can estimate the accrued capital gians tax on these assets, CGTAX, as follows: first, let non-home wealth, NHW = NW − HOME, where HOME is the value of the principal residence only. Let CGNHW be the accrued capital gains on the sale of NHW and CGHOME be the accrued capital gains on the sale of the principal residence. Then

where MaxRate is the maximum tax rate on capital gains set by law in a particular year.Footnote 11
Capital gains on the primary home are subject to special rules. In 2007 and 2016, the exclusion (EXCLUSION) on the capital gains from the sale of the principal residence was $250,000 for a single and $500,000 for a married couple. In 1983 and 1989, the exclusion equaled $125,000 if the age of the seller was over 55 and zero otherwise.Footnote 12 Then,

CGTAX2 could be negative if there is a loss on the sale (a ‘short sale’, e.g.). Then,

Neither DCW nor DBW are saleable so that a CGTAX would not apply to these assets.Footnote 13 Then, post-tax (p) NW is given by:

and post-tax AW by:

How much difference do these adjustments to the value of PW actually make? Projected future tax liability took a large chunk out of PW.Footnote 14 As shown in Table 4, in 2016, the percentage difference between mean pre-tax DCW and mean post-tax DCW was 23.8% among age group 47 and over. That is to say, DCW was devalued by almost a quarter when implicit taxes were deducted. DBW was reduced by 19.7% and overall PW by 22.1%. Median PW was devalued by a smaller amount – 12.6% among account holders only and 10.3% among all households in the age group – because the median household faces a lower marginal income tax rate than the overall average. Results are quite similar for age group 46 and under.
Before-tax and after-tax pension wealth and SSW, 1983–2016

Households are classified into age groups by the age of the head of household. Key: Pension Wealth (PW) = DBW + DCW.
Source: Author's computations from the 1983, 1989, 2007, and 2016 SCF.
Percentage differences between gross and net PW generally fell off over years 1983 and 2016. The reduction in DCW was particularly high in 1983 (37.1%) reflecting the high income tax rates of that year (the top marginal rate was 50%). After the passage of the Tax Reform Act of 1986 (TRA-86), income tax rates, particularly the top MTR, fell dramatically. As a result, mean net DCW and DBW grew faster from 1983 to 2016 than the corresponding gross values among both younger and older households. However, because of the shift-over from defined benefit to DCW, documented in Table 3, and the fact that DCW is more heavily concentrated among high wealth households and therefore subject to higher MTRs than DBW, after-tax PW grew at about the same rate as before-tax PW (see Figure 1).Footnote 15
Pre-tax and post-tax pension wealth and SSW, ages 47 and over, percentage change, 1983–2016. Source: Author's calculations from the SCF.

Future tax liabilities on withdrawals took a smaller bite out of SSW than PW. In 2016, the average net value of SSW for ages 47 and over was 86.6% of its gross average value, compared to 77.9% for PW. The differential between gross and net SSW expanded over time from 0.0% in 1983 (when there were no federal income taxes paid on Social Security income) to 13.4% in 2016. The same pattern holds for median SSW. As a consequence, net SSW grew slower than the corresponding gross value over years 1983 to 2016. The differentials were quite pronounced. Although mean before-tax SSW gained 58.2%, mean after-tax SSW advanced by only 37.0% (Figure 1). Results are similar for median values. Among younger households, the percentage gap in mean SSW rose from 8.4% in 1989 to 12.4% in 2016 and that in median SSW from 4.0% to 9.0%.
Netting out taxes reduces measured inequality in PW (see panel II). In 2016, the Gini coefficient of DCW among holders only in age group 47 and over was reduced by 0.024, that of DBW holders by 0.22, and that of PW holders by 0.027. The explanation is straightforward: richer households hold more PW in aggregate (see Table 8) and face higher MTRs. The equalizing effect on DCW was strongest in 1983, when income tax rates were highest, fell between 1983 and 1989 as TRA-86 kicked in, increased from 1989 to 2007 (the top MTR went up from 28.0% to 35.0%), and then remained steady from 2007 to 2016 (even though the top MTR increased to 39.6%). For DBW, the greatest differential between the pre-tax and post-tax Gini coefficients occurred in 1983 as well (when DBW constituted 97% of PW). Similar to DCW, there was a pronounced reduction in the spread in Gini coefficients between pre-tax and post-tax inequalities between 1983 and 1989 but little change after that, whereas for PW the Gini differential also fell substantially from 1983 to 1989 and then picked up between 1989 and 2007.
Among the younger age group, the differences in Gini coefficient were smaller than those among the older age group. However, time trends are similar. For DCW, the gap fell between 1983 and 1989 and then increased from 1989 and 2007; for DBW, it remained steady from 1989 to 2016; and for PW, it rose from 1989 to 2016.
How does the use of net (after-tax) values affect trends in SSW inequality? Results for SSW are similar to those for PW and for a similar reason – because higher income households hold more SSW and face a higher MTR than lower income ones. In 2016, the differential in the Gini coefficient between gross and net SSW was 0.020 among older households, somewhat less than that for PW, and also 0.020 among the younger households, greater than that for PW. Over time, the gap in SSW inequality increased sharply for the two age groups, from 0.0 in 1983 (when there were no income taxes on Social Security) to 0.020 in 2016 for the older group and from 0.008 in 1989 to 0.020 for the younger group.
In 2016, netting out implicit taxes on TDA withdrawals and accrued capital gains lowered mean NW by 9.3% among older households (see Table 5). The differential is much smaller than for PW, RW, and SSW. About half the differential is attributable to implicit taxes on TDA and the other half to those on accrued capital gains. The reason for the relatively small effect is that DCW made up only 15.6% of household gross assets in 2016 (see Table 2)Footnote 16 and the average tax rate on DCW was 23.6%. Over time, the differential between (gross) NW and net NW grew from 0.9% in 1983 to 9.3% in 2016, reflecting mainly the rising share of DCW in NW (from 1.5% to 15.6%). The gap between gross and net median NW also increased, from 0.3% to 4.4%. The differentials are generally much smaller than those for mean NW, reflecting the lower MTRs faced by middle wealth households than the rich. The share of the differential attributable to TDATAX was similarly higher for median NW than mean NW because non-home capital gains are heavily concentrated among rich households and total capital gains amount to a relatively small fraction of middle-class wealth. Results are quite similar for the younger age group, although in this case the percentage gap was 9.1% in mean NW and 7.5% in median NW in 2016. The cleavage between pre-tax and post-tax values similarly expanded over time from 1983 to 2016.Footnote 17
Before-tax and after-tax NW and AW: 1983–2016

Households are classified into age groups by the age of the head of household. Key: Augmented Wealth (AW) = NWX + DCW + DBW + SSW.
Source: Author's computations from the 1983, 1989, 2007, and 2016 SCF.
As a result, netting out implicit income taxes lowered the measured growth rate of NW (see Figure 2). Although mean NW among ages 47 and over gained 107.8% from 1983 to 2016, mean after-tax NW increased by 90.1%. The effect on median wealth was a bit smaller – 29.0% versus 23.6%. Results for the under age 47 group are similar, with pre-tax mean NW advancing by 32.6% and post-tax NW by 22.3%. However, in this case, median pre-tax NW declined by 68.7% and median post-tax NW by 70.9%.
Pre-tax and post-tax NW, ages 47 and over, percentage change, 1983–2016. Source: Author's calculations from the SCF.

Adding DBW and SSW to create AW further enlarges the gap between gross and net values, since, as indicated above, DB and SS benefits are also subject to income tax (at least after 1983 for the latter). In 2016, the percentage disparity between pre-tax and post-tax AW was 10.7% for mean values among the older age group and 7.4% for median values. Among the younger age group, the respective values were 10.7% and 7.6%. Once again, there was a growing wedge between AW and AWp, as there was between NW and NWp, for both mean and median values and for the two age groups (with 1989 a bit of an outlier). Consequently, post-tax AW grew slower than pre-tax AW. Although mean AW rose by 87.9% among older households from 1983 to 2016, AWp increased by only 73.4% (see Figure 3). The gap was again smaller for median values.
Pre-tax and post-tax AW, ages 47 and over, percentage change, 1983–2016. Source: Author's calculations from the SCF.

NW inequality is treated next (see panel II of Table 5). Let us first consider the consequences of netting out taxes paid on withdrawals from TDA only. There are three effects involved: (1) the tax effect, (2) the portfolio composition effect, and (3) the magnitude effect. The tax effect should lower measured inequality since richer households face higher MTRs and the percentage reduction in the value of TDA is greater than for poorer households. The portfolio effect should have the opposite impact since poorer households generally hold a higher percentage of their wealth in TDA than richer ones and the resultant percentage reduction in wealth should be greater for poorer households. The magnitude effect is the total value of TDA as a share of NW. If this is greater, then the percentage reduction in inequality should rise since gross DCW is more unequal than net DCW (DCW made up 94.3% of TDA in 2016). This factor is particularly relevant to time trends in the inequality gap.
The results indicate that there is only a trivial effect of netting out TDATAX on NW inequality. This is true for both age groups, with the single exception of the younger age group in 2016. In this case, netting out TDATAX actually increases the Gini coefficient by 0.013. The reason is that TDA was heavily concentrated among low and middle wealth households in this age group that year, so that netting out implicit taxes lowered the wealth at the bottom of the wealth distribution more than at the top.
A decomposition analysis reveals the relative magnitudes of the second two effects. To measure the second, the composition effect, I assume that the share of DC wealth in total assets is equal to the overall average, which was 15.6% in 2016, and that this share is the same for all wealth groups. I then distribute the other assets proportionately to their actual distribution in 2016 and assume that the price of these other assets remains unchanged. (I also assume that the debt–NW ratio is unchanged). I use the ratio of the 99th percentile to the mean wealth of quintiles 2–4 as the measure of inequality (P99/P2060). With this new assumption, the ratio falls from its actual ratio of 182.7 to 166.1 or by 9.1%. The explanation is that the share of DC wealth among the top 1% now rises steeply (from its actual level of 6.0% to 15.6%) whereas that among the middle three wealth quintiles falls slightly. The value of DC assets is lower than that of other assets such as stocks, so that raising the share of DC wealth and lowering he share of other assets lowers the relative NW of the top 1%. To measure the third effect, the magnitude effect, I repeat the same analysis except that I now use the share of DCW in total assets for 2007, which was 12.1%. In this case, the P99/P2060 ratio now declines from 182.7 to 171.3 or by 6.3%. The difference between these two simulations, 2.9 percentage points, is a measure of the quantity effect.
Does the picture change when imputed taxes on accrued capital gains are also netted out? We would expect that this will reduce measured inequality since accrued capital gains are concentrated among richer households. However, there is very little impact among the older age group. The difference in Gini coefficients between NW and NWp ranges from −0.007 in 1989 to 0.006 in 2007. Among the younger age group, the added impact of netting out implicit taxes on accrued capital gains was trivial in 1983 and 2007. In 2016, it raised the Gini coefficient by 0.014 for the reason stated above (almost fully due to subtracting TDA taxes). The effect was very large in 1989, with an increase of the Gini coefficient of 0.045. The rationale is the same as that which explains the large gap in median values between pre-tax and post-tax wealth, which is that middle wealth households in that age group recorded very substantial accrued capital gains that year. The large tax that they paid on the accrued capital gains had the effect of moving them downward in the post-tax wealth distribution, thereby creating many new low wealth households and thus raising the inequality of after-tax wealth (note that the effect from TDA taxes on inequality was very small).
With regard to the effect of taxes on AW inequality, there is only a small difference in Gini coefficients between gross AW and AW net of TDATAX. The added effect of netting out implicit taxes on accrued capital gains is also generally small. In 2016, the gap between AW and AWp in 2016 was 0.007 for the younger group and 0.009 for the older group, in comparison with almost no difference between Gini coefficients for AW and AW minus TDATAX. However, in this case, the differential in Gini values between AW and AWp rose slightly over time for the older group from virtually zero in 1983 (no estimate is available for the younger group for 1983). This is mainly due to the increasing ratio of total taxes due on accrued capital gains to NW from 0.1% in 1983 to 4.7% in 2016.
7. Bequest value or ‘you are worth more dead than alive’
The (gross) BV is the value of the estate when it passes to its beneficiaries. Why is this a useful concept? Many older Americans are as much interested in the value of the estate they will pass down to their heirs as in their current NW. Although NW is a useful gage of potential consumption, many rich older Americans may be more interested in how much wealth they will pass down to their children than in their own consumption possibilities. Indeed, an extensive estate planning industry has developed to focus on exactly this concern.
The most notable difference between BV and NW is that life insurance death benefits are included in the calculation of BV. These are distributed to the beneficiaries of the policy on the death of the individual. This component differs from accumulations included in whole life insurance which are considered part of the NW of the individual. The total death benefit of life insurance, TDB, is given by:

where TERMLI is the death benefit from term life insurance, FACECASHLI is the face value of whole life insurance, and CASHLI is the cash surrender value of whole life insurance. BV also differs from AW in another regard because Social Security benefits terminate when an individual dies, as do defined benefit pension benefits.Footnote 18 As a result, it is not meaningful to compare BV with AW.
One of the features of the tax code under past and existing tax law is that TDA in estates are still subject to income taxes at ordinary income rates on withdrawal, and RMDs carry over. In other words, for the computation of post-tax BV, DCW is still valued on a post-TDA tax basis. However, in contrast, all other assets are valued on a step-up in basis according to current tax rules. In other words, these assets are valued at current market value, without any subtraction of income taxes due on accrued capital gains.
Inheritances are also subject to an estate tax. To put BV on a comparable footing to NWp, it is necessary to net out expected future federal estate taxes. As with NW and NWp, I value the components of wealth as of the current survey year and use the estate tax law as of that year to determine what the current tax liability is.Footnote 19 Estate tax liability applies to almost all asset components of NW, including 401(k) plans and IRAs. The latter are valued at face value. On the contrary, life insurance death benefits are excluded from taxable assets unless the death benefit goes directly to the estate of the deceased. However, it is not possible to identify the beneficiary of the death benefit from the SCF data, so it is assumed that all death benefits are excluded from the taxable estate. Then, define post-tax (p) BV as:

where ET is the estimated estate tax due on death.
There is generally a marital deduction in the case of married couples, so that there is no estate tax due on the death of the first spouse as long as the estate is passed to the surviving spouse. Certain trusts are included and others excluded from taxable estate. In particular, revocable trusts funds are considered part of the assets of the individual or household and are generally included in the taxable estate. In contrast, assets in irrevocable trusts are not considered to be owned by the person or family and are not subject to estate taxes. This is not an issue because the SCF excludes irrevocable trusts from NW.
It is first of interest to analyze the effect of implicit taxes on the BV. Among the middle-aged group (ages 47–64), netting out TDATAX had a relatively small impact on mean BV, reducing it by 3.9% in 2016 (see Table 6).Footnote 20 The effect did rise over time, from a 1.0% cutback in 1983. Results are very similar for seniors (age group 65 and over) but smaller for young households (ages 46 and under). The reduction was even smaller for median values.
Comparison of BV with NW, 1983–2016

Households are classified into age groups by the age of the head of household.
Source: Author's computations from the 1983, 1989, 2007, and 2016 SCF.
In contrast, netting out estate taxes had a sizeable effect on the BV. In 2016 estimated estate taxes reduced mean BV by 8.2% for age group 47–64 (12.2% minus 3.9%) and by 9.4% for age group 65 and over. The effect was much more attenuated for young households (only 3.5%) because of their lower wealth holdings. Similarly, the effect on median BV was zero because middle wealth households are generally not subject to estate taxes. Differences in mean values were actually considerably greater in 1983, 1989, and 2007 (a range 4.1–9.5% for young households, 14.6–17.1% for the middle-aged group, and 17.3–19.1% for seniors) when the exemption was lower and the top MTR higher. As a result, BVp grew notably faster than BV.
It is next of interest to compare the BV with NW. In 2016, average BV was 21.4% higher than average NW among the middle-aged group (line 5). Indeed, the mean death benefit that year was $264,300 for this age group. The gap between median BV and median NW was even greater, at 67.4%. This reflects the fact that middle-class households hold life insurance policies with even greater death benefits relative to NW (see Table 8). In the same year, average BV was only 6.7% higher than average NW among the older group and median BV only 28.5% greater than median NW. Mean death benefits were much smaller among the elderly than the middle-aged – only $75,200. The rationale is that older people have fewer children living at home and thus less need to provide for surviving children than do younger adults. The former can also rely on guaranteed retirement benefits such as Social Security for the surviving spouse. The differential between BV and NW was even greater for the youngest age group – 53.2% for mean values and 86.2% for median values.Footnote 21
The gap between the BV and NW rose over time. This was true for all three age groups and for both mean and median values. The reason is that death benefits increased over time. Among age group 47–64, for example, mean TDB more than doubled in 2016 dollars from $98,500 in 1983 to $264,300 in 2016.
BVp is most comparable to NWp since both exclude all implicit taxes. Among middle-aged households in 2016, the percentage gap fell from 21.4% between mean NW and mean BV to 19.4% between mean BVp and mean NWp and among senior households it dropped from 6.7% to 1.6%, whereas among young households the percentage differential was about the same (also see Figure 4). There are offsetting effects which explain why the differential was smaller. Among middle-aged households, of the 19.4 percentage point differential between mean BVp and mean NWp, the lion's share, 125.5%, was accounted for by mean death benefits (which are included in BV). Mean CGTAX (which is excluded from NWp) accounted for another 22.8%, whereas mean estate taxes (which is excluded from BVp) offset this by 48.3%. Results are similar for the other two age groups. The gap between median BVp and NWp was once again greater than the mean differential.
Post-tax BVp and NWp, 1983–2016 (in 1,000s, $2,006). Source: Author's calculations from the SCF.

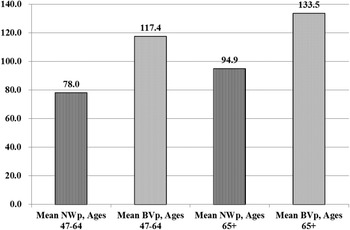
The gap between BVp and NWp was much smaller in earlier years and the cleavage between the two grew over time. The mean differential was only 2.1 percentage points in 1983 among middle-aged households, 0.1 percentage points in 1989, 12.3 percentage points in 2007, and 19.4 percentage points in 2016. As noted above, three factors played a role in the growing gap: (1) rising death benefits over time; (2) increasing capital gains taxation; and (3) falling estate tax rates. With regard to the last factor, the exemption was much smaller and the MTRs higher for the top wealth tiers in the 1980s through 2007 than in 2016. However, a simple decomposition indicates that 82.9% of the rising differential between BVp and NWp between 1983 and 2016 was due to rising death benefits and 23.8% due to growing CGTAX, with estate tax changes contributing −6.7%. Results are similar for the other two age groups as well as for median values.Footnote 22 As a result, although mean NWp gained 78.0% from 1983 to 2016 among middle-aged households, mean BVp was up by 117.4% (see Figure 5). Similarly, among households aged 65 and over, although mean NWp advanced by 94.9%, mean BVp increased by 133.5%. How does BVp stack up relative to NWp in terms of inequality? On the one hand, the subtraction of CGTAXs from NW to obtain NWp should lower measured inequality since the rich pay a higher share of their income and presumably wealth in CGTAXs. Since CGTAXs are excluded from BV, this should raise measured inequality in BV relative to NWp. On the other hand, death benefits are more concentrated among middle income and hence middle wealth families relative to the rich (see Table 8). Their inclusion in BV should thus lower measured inequality. Additionally, estate taxes are netted out of BV to obtain BVp. This effect should also lower bequest wealth inequality since estate taxes are disproportionately paid by the rich. TDA taxes in contrast are deducted from both NW and BV to obtain after-tax values, so that these two subtractions should basically neutralize each other.
Post-tax NWp and BVp, percentage change, 1983–2016. Source: Author's calculations from the SCF.

I approach this question in a number of steps. I consider BVp inequality first. The first step is to subtract TDATAX from BV. This has almost no effect on the Gini coefficient (see panel II of Table 6). The second step is to subtract estate taxes to obtain BVp. Here, the effect is fairly large. However, the estate tax effect on inequality, like that on the wealth level, attenuated over the years. Among middle-aged households in 2016, netting out estate taxes lowered the Gini coefficient for BV by 0.017. The effect was much stronger in earlier years, with decreases of 0.045 in 1983, 0.059 in 1989, and 0.042 in 2007. The explanation, as noted above, is that the exemption level was much lower in these years, and the top MTR was higher. Among the older group, the pattern is very similar, with declines in the Gini coefficient of 0.048 in 1983, 0.058 in 1989, and 0.052 in 2007 but only 0.024 in 2016. The reduction in the Gini coefficient is considerably smaller among the youngest age group because their wealth is lower and many fewer would be subject to an estate tax.
The third step is to compare the Gini coefficient of BV with that of NW. This comparison shows the effect of including death benefits in the former. This addition lowers wealth inequality. Among middle-aged households, the difference in Gini coefficients was 0.032 in 1983, 0.077 in 1989, 0.039 in 2007, and 0.042 in 2016. The gap was particularly high in 1989 due to life insurance policies with very high death benefits among middle-class families. The divergence was notably lower among seniors, a result of policies with much lower death benefits. Once again, 1989 is an outlier, with a difference of 0.074 among seniors, and once again due to policies providing very high death benefits. However, the disparity was considerably larger among young households, ranging from 0.096 to 0.144, because death benefits relative to NW were much greater.
The last step is to compare the inequality of BVp with that of NWp. This comparison shows the added effects of netting out estate taxes from the former and CGTAX from the latter. The divergence between the two now widens considerably in every case. For example, among middle-aged households, the Gini coefficient gap rises from 0.32 to 0.075 in 1983, from 0.077 to 0.145 in 1989, from 0.039 to 0.077 in 2007, and from 0.042 to 0.056 in 2016 (also see Figure 6). Results are similar for young households and seniors. These findings indicate that subtracting estate taxes from bequest wealth has a much stronger effect on relative inequality than deducting CGTAXs from NW.
Inequality in post-tax NWp and BVp, 1983–2016 (Gini coefficients). Source: Author's calculations from the SCF.

8. Demographic breakdown
I next provide a demographic breakdown of the impact of taxes on NW, AW, and BV by component. The key categories are (a) age class, (b) education, (c) race, and (d) family type. I also provide a disaggregation by (e) income class, (f) wealth class, and (g) homeowner status. Since the impact of excluding taxes on wealth is large for people who have high incomes and low for those with low income, I expect to see substantial variation in inequality effects. Key issues are as follows: first, does the exclusion of taxes lower or raise the racial wealth gap? Second, do younger or older households benefit more when taxes are netted out (I expect that younger households do better since income and hence tax rates are lower for them)? Third, do higher income and wealth households fare worse when comparing gross and net wealth? Here, the answer is likely to depend mainly on the portfolio mix of richer versus poorer households. Fourth, do renters do better than homeowners in these comparisons (I expect so since the former generally have lower income)?
As shown in Table 7, the percentage difference between net DCW and DCW rose monotonically with income class and with wealth class in 2016, except for the lowest wealth group. The effect of excluding income taxes on TDA was greater for white households than for African-American ones, thus slightly raising the racial ratio in DCW from 0.17 to 0.18. There was little variation by age class. The percentage difference between net DCW and DCW was greatest for college graduates and smallest for high school graduates, thus lowering the ratio of DCW between the two from 7.07 to 6.36. The effect was lower among single females compared to couples, so that the DCW ratio between the two fell from 5.06 to 4.80. As shown in Table 8, the distribution of DCW across income, wealth, and demographic groups in 2016 was very similar to those of NW with the exception that the top 1% in terms of both income and wealth held a much smaller share of DCW compared to NW.
Wealth by component, income and wealth class, and demographic characteristic, 2016 (percentage difference of mean values)

Augmented Wealth (AW) = NW + DBW + SSW.
a Mean NW is negative for the bottom 20%.
b Hispanics can be of any race.
c Households are classified according to the age and education of the head of household.
Source: Author's computations from the 2016 SCF for households aged 47 and over.
Distribution of wealth by component by income and wealth class and demographic characteristic, 2016 (percentage distribution)

Note: TDB is total death benefits.
Augmented Wealth (AW) = NW + DBW + SSW.
a Hispanics can be of any race.
b Households are classified according to the age and education of the head of household.
Source: Author's computations from the 2016 SCF for households aged 47 and over.
Results are quite similar for DBW as for DCW in terms of the percentage difference between net and gross values (Table 7). However, DBW was much more concentrated among middle income and wealth households, black families, high school graduates, and renters compared to either DCW or NW (Table 8). Although the top 10% of income recipients held 55.4% of DCW and 66.8% of NW, they accounted for only 27.7% of DBW. Similarly, the top 10% of wealth holders held 70.5% of DCW and 81.1% of NW but only 29.9% of DBW. The racial ratio in DBW was actually quite a bit higher than that of DCW – 0.58 compared to 0.17. Excluding imputed taxes raised the black–white ratio from 0.58 to 0.61. It also lowered the DBW ratio between college and high school graduates from 3.08 to 2.73.
Percentage differences between net SSW and SSW advanced almost monotonically with income and wealth class. Because it is highly correlated with income, it was also greater for whites and Asians than blacks and Hispanics, declined somewhat across age groups, was higher for college graduates than other educational groups, higher for couples than single females, and greater for homeowners than renters (Table 7). SSW, similar to DBW, was much more concentrated among middle and low income and wealth households than DCW or NW (see Table 8). A little over 10% of SSW was held by African-American households, compared to 2.4% of NW. The black–white ratio in mean SSW was 0.65, much higher than that of DCW or NW. Reducing SSW by future taxes on Social Security benefits raised the racial ratio in SSW from 0.65 to 0.69. SSW was also more heavily concentrated among the three lower educational groups compared to college graduates. Single females held 16.1% of SSW, compared to 9.1% of NW, whereas renters accounted for 16.8% of SSW, compared to 3.4% of NW. Netting out taxes on SSW reduced the SSW ratio between college and high school graduates from 1.71 to 1.50 and that between couples and single females from 2.42 to 2.26.
The effect of excluding taxes on NW depends on both the income level of the family (greater for higher income ones) and the share of its portfolio held in TDA (greater for a higher share held in TDA). The percentage difference rose with both income and wealth until about the 90th percentile and then declined. (This pattern also explains why the effect of netting out taxes has little effect on NW inequality.) The effect was a little greater for whites than for blacks or Hispanics. It showed little variation across age groups. The effect was largest for college graduates, larger for couples than for single females, and a little larger for renters than for homeowners (Table 7).
Results are somewhat similar with regard to the percentage difference between AWp and AW. The percentage difference rose with both income and wealth until about the 90th percentile and then fell off. The variation was quite small between blacks and whites (the effect is a little greater among whites) because the high concentration of DBW and SSW among blacks offset their lower incomes. However, the gap was lower for Hispanics due to their relatively low accumulations of DBW and SSW (see Table 8). Percentage differences were similar among the youngest three age classes but smaller for the oldest group – a reflection of differences in portfolio composition. The effect was greater for college than for high school graduates, for couples than for single females, and for homeowners than for renters.
The tax effect of reducing BV by expected TDA and estate taxes was, not surprisingly, heavily concentrated at the top of the income and wealth distribution. The impact was greater for whites than for the other racial groups, for college graduates than for those less educated, for couples and single males than for single females, and for homeowners than for renters. Subtracting out future estate taxes raised the black–white BV ratio from 0.17 to 0.18 and lowered the BV ratio from 6.20 to 5.80 between college and high school graduates, from 4.80 to 4.53 between couples and female householders, and from 7.36 to 6.91 between homeowners and renters.
A comparison of net BVp and NWp is instructive. The percentage difference rose with income level until P90–95 and then fell off sharply – indeed, negative for the top income class (NWp was greater than BVp). The gap declined sharply with wealth level and also turned negative for the top wealth class. It was lowest for whites compared to the other racial groups; highest for the youngest age group and then dropped sharply with age (the estates of older householders provided much lower death benefits than younger ones, as shown in Table 8); was lowest for college graduates; in this case, it was lowest for single males (they do not need to provide much in the way of death benefits since they are not married); and was three times as great for renters as homeowners. Indeed, as shown in Table 8, death benefits (TDB) were highly concentrated in the fourth quintile of both the income and wealth distributions and among age groups 47–54 and 55–64.
9. Sensitivity analysis
How robust are the findings reported above to alternative assumptions? In this regard, I provide four alternative scenarios for 2016. In some cases, I make some rather extreme assumptions in order to test the sensitivity of the results. In the first, all marginal income tax rates are increased by 1 percentage point, although the capital gains cap is maintained at 20% and estate tax rates are left unchanged. In the second, it is now assumed that 100% of annuities and whole life insurance are now taxable, in contrast to the base case assumption that only 50% is taxable. This new assumption is probably extreme. In the third, it is now assumed that 20% of death benefits goes directly to the estate, in contrast to the base case assumption that 0% goes to the estate. This has the effect of excluding 20% of the death benefit from the BV of the estate. One possible rationale for this new assumption is that the money is used as payment for funeral expenses and accountant and lawyer fees needed to probate the estate.Footnote 23 This new assumption is also likely to be on the high side. In the fourth, income is projected to age 65 (or year of expected retirement) for households under age 65. It is assumed that all labor earnings and business income go to zero. Expected Social Security and DB benefits are added to household income (see the appendix for details). The key difficulty is with regard to future capital income like dividends. For simplicity, it is assumed here that capital income (including accrued capital gains) grows at 3.0% per year in real terms from current age to retirement. This figure accords with the average real rate of return on the portfolio of American households from 1983 to 2016 (see Wolff, Reference Wolff2017, Table 11). For households aged 65 and over, I continue to use their current income for the tax calculation and assume that it remains constant over the remainder of their lifetime.
Results are shown in Table 9. In simulation 1, raising MTRs by 1 percentage point raises the gap between before-tax and after-tax pension and SSW by about 1 percentage point. This effect is fairly uniform for the two age groups. It has an even smaller effect on the disparity between pre-tax and post-tax NW and AW, widening the gap by between 0.0 and 0.4 percentage points. There is a very small widening of the gap (about 0.1–0.2 percentage points) between mean BV and after-tax BV. The effect is a little stronger for median values among the age group 47–64, increasing the differential by 0.4 percentage points. There is virtually no effect from raising MTRs by 1 percentage point on Gini coefficients. Similarly, there is no perceptible impact on intergroup differences in NWp such as the racial wealth gap.Footnote 24
Sensitivity analysis, 2016

Notes: Baseline: Original analysis.
Simulation 1. Add 1 percentage point to all MTRs.
Simulation 2. 100% of annuities and whole life insurance are now taxable.
Simulation 3. 20% of death benefits go directly to the estate.
Simulation 4. For households under age 65, income is projected to age 65 (or year of expected retirement).
In simulation 2, raising the taxable portion of annuities and life insurance from 50% to 100% also has virtually no effect on the disparities between pre-tax and post-tax values. The reason is that these two assets amount to only 0.9% of gross assets overall, so the effect is very small. However, there are a couple of exceptions. The differential between before- and after-tax values was 0.3 percentage points for the mean NW of the age group 47 and over and mean BV of ages 65 and over and 0.2 percentage points for median BV of the age group 47–64. The higher differences are due to the effect of TDA taxes, not CGTAXs. As in simulation 1, there is no noticeable effect on Gini coefficients or intergroup differences in NWp.
In simulation 3, TDBs are reduced by 20%. Even though this adjustment affects both the pre-tax and post-tax values of BV, the effects on the gap between pre- and post-tax values are now noticeably larger. The reason is that this change lessens the pre-tax value of the estate but TDA taxes and the estate tax are unaffected (in the case of the latter, death benefits are excluded when calculating the estate tax). Differences range from 0.0 to 0.7 percentage points. The effect is strongest among the youngest age group because they have the highest value of death benefits relative to NW. However, differences in the Gini coefficients between before- and after-tax values are not impacted as well.
In simulation 4, the income of households under age 65 is projected to retirement. Projected income averages about 15% less than actual income. As a result, tax rates are reduced relative to the baseline case (in contrast to simulation 1). As shown in Table 9, the gap between pre- and post-tax values is almost uniformly lower than the baseline case. Differences range as high as 2.6 percentage points (for median PW among age group 46 and under). However, by and large, Gini coefficients and intergroup differences are unaffected.
10. Conclusion
This paper uses the Federal Reserve Board's SCF for 1983, 1989, 2001, 2007, 2010, and 2016 to compare the time trends in household wealth with and without netting out implicit taxes and investigate their implications on wealth inequality. The wealth measures include household NW, DCW, DBW, PW, SSW, AW, and BV. Tax liabilities considered are implicit taxes on TDA on withdrawal, CGTAX on investment assets and home, and the estate tax. It is found that netting out implicit taxes substantially reduces the growth in NW and AW, but it has little impact on their inequality. It lowers PW, SSW, and BV inequality. The paper also analyzes the differences in tax impacts on demographic groups defined by age, education, race, family type, income, wealth, and homeownership. Netting out taxes is generally an equalizing factor with regard to intergroup differences in pension and SSW, although less so for NW or AW. Sensitivity analysis indicates that the main results remain robust with regard to alternative assumptions of key parameters such as adding 1 percentage point to MTRs, treating annuities and life insurance as fully taxable, assuming that 20% of death benefits go directly to the estate, and using projected income to retirement age instead of current income for the tax analysis. Moreover, the effects are barely detectable on demographic differences.
Revaluation of household wealth by considering the tax liability also has important policy implications. The face value of household wealth, without netting out the implicit taxes, is commonly used to measure wealth growth; the measure could be misleading as a substantial portion of household wealth is subject to taxes. Indeed, most researchers have been overstating both the level of wealth and of components of wealth and their rate of growth over time. In some cases, the biases are quite large – for example, an almost 18 percentage point difference in the growth of mean NW and a 15 percentage point differential in that of AW among age group 47 and over from 1983 to 2016.
The face value of household wealth is also commonly used to assess retirement readiness (see, e.g., Wolff, Reference Wolff and Papadimitriou2007; Weller, Reference Weller2010; Chen et al., Reference Chen, Munnell and Sanzenbacher2018; Beshears et al., Reference Beshears, Choi, Laibson and Ramnath2019). From a policy perspective, the results of this paper clearly indicate that these studies and many others have been substantially over estimating retirement adequacy. On average, retirement wealth is overstated by about 18% in 2016 on the basis of pre-tax values compared to post-tax values. For some groups, the overstatement is as high as 39%. The same criticism applies to retirement planning in general and even estate planning. Many individuals and even professional retirement planners base their analysis on the face value of TDA, which will clearly overstate the level of resources available at retirement. Similarly, estate planners will often use the face value of TDA to design bequest strategies, not aware that the tax liability of TDA remains even after a person is deceased. On a related matter, the federal (and state) estate tax calculation is also based on the face value of TDA. This is also a mistake since it leads to an overstatement of the actual value of an estate. The IRS should be instructed to apply the after-tax value of TDA when valuing an estate for estate tax purposes (this may require new legislation).
An overstatement of household wealth from using the face value of assets will also directly impact a policy maker's assessment of both the level of well-being and its growth over time since wealth is a key component in measuring well-being. It may also affect the measurement of both the level and trajectory of inequality, as well as the extent of the racial and ethnic wealth gap, which have become key policy concerns. The mismeasurement effects on NW and AW were still relatively modest as of 2016. However, the bias in estimating both the level and growth rate of NW and AW will likely get more serious over time if the share of DCW in household wealth continues to rise, as it has already from 1.5% in 1983 to 15.6% in 2016. To date, adjusting for implicit taxes on TDA has not had much effect on measuring the upward trajectory of wealth inequality. However, that might change in the future if DCW continues to grow in relative terms and particularly if its distribution shifts toward higher wealth households.
What about the tax advantages of investing in DTA versus directly in stocks? Poterba (Reference Poterba2004) shows that the answer as to which is better cannot be determined a priori. It depends on the time horizon, the rate of return, and the MTR faced by the person. For younger workers, TDA are preferable because there are more years of tax-free income growth but for older workers stocks are preferable because withdrawals are subject to a tax-preference CGTAX whereas TDA withdrawals are subject to ordinary tax rates. However, Poterba compared returns on a dollar invested in each account and did not consider the fact that the initial investment in TDA is in pre-tax dollars whereas that in stock is post-tax. Moreover, he did not consider Roth accounts. What if we now consider these possibilities in the calculation?
It can be shown that there is no general answer as to which investment is better. It once again depends on the time horizon, the rate of return and the MTR. However, my calculations using 2020 tax rates, a 10-year time horizon for the three investments and reasonable assumptions – a 4% rate of return plus a 1% dividend pay-out are illustrative. Suppose, the MTR is 35% (the second highest rate) and the maximum tax rate on capital gains and dividends is 20%. Also suppose individuals invest 100 dollars at the start and then withdraw 10% of their accumulations after 10 years for a period of 10 years. Further assume that capital gains and dividends are accumulated in the account until withdrawal but dividends are subject to an annual tax. Then, total withdrawals from the TDA would amount to $87.33, those from the stock account would be $84.21, a 3.57% difference, and those from a Roth account would be $87.33, the same as a (regular) TDA. The stock account total is close to the TDA total because capital gains are essentially accumulated tax-free (i.e., subject to the CGTAX only when realized on withdrawal). Indeed, most of the difference is due to dividend ‘leakage’ – that is, the fact that dividends are subject to an annual tax. If it is instead assumed that the stock account has a 5% rate of return and no dividend payout, then withdrawals from the stock fund would amount to $86.50, only 0.95% lower than the TDA.
Let us return to the first scenario of a 4% rate of return plus a 1% dividend pay-out and now assume that TDA withdrawals occur at a lower MTR, 24% (i.e., the fourth lowest tax bracket). Total withdrawal from the TDA account is now $102.11, which is 21.2% greater than that from the stock account. It is also of note that this is also 16.9% greater than the total for a Roth account. The reason is that the money going into a Roth account is subject to a higher tax rate than the money coming out of TDA. However, a Roth account has greater flexibility in terms of the timing of withdrawals.
Appendix: Estimation of retirement wealth
This appendix provides methodological details on the construction of estimates for both Social Security wealth (SSW) and defined benefit pension wealth (DBW). The imputation of both DBW and SSW involves a large number of steps, which is summarized below. It should be noted that the standard definition of DBW and SSW is based on the conventional ‘on-going concern’ treatment. It is assumed for this that employees continue to work at their place of employment until their expected date of retirement.
A.1 DB pension wealth
For retirees (r) the procedure is straightforward. Let PB be the pension benefit currently being received by the retiree. The SCF questionnaire indicates how many pension plans each spouse is involved in and what the expected (or current) pension benefit is. The SCF questionnaire also indicates whether the pension benefits remain fixed in nominal terms over time for a particular beneficiary or is indexed for inflation. In the case of the former, DB PW is given by:

and in the latter case,

where A is the current age of the retiree; mt is the mortality rate at time t conditional on age, gender, and race; δ* is the real annual discount rate, set to 2%; γ is the inflation rate assumed to be 3% per year; δ = δ* + γ is the nominal annual discount rate, equal to 5%; and the integration runs from zero to the number of years when the retiree reaches an arbitrary age limit of 109.
Estimates of DBW (as well as SSW) are quite sensitive to the choice of inflation rate and discount rate. I choose a 3% inflation rate since it is very close to the actual average annual change of the CPI-U-RS index from 1983 to 2016. Moreover, I choose a 5% nominal discount rate because it similarly is close to the actual average annual rate of return on liquid assets over the same period. These two choices lead to a 2% real discount rate (the difference between the two rates). A higher real discount rate will lead to lower estimates of DBW (and similarly SSW), and, conversely.
Among current workers (w), the procedure is more complex. The SCF provides detailed information on pension coverage among current workers, including the type of plan, the expected benefit at retirement or the formula used to determine the benefit amount (e.g., a fixed percentage of the average of the last 5 year's earnings), the expected retirement age when the benefits are effective, the likely retirement age of the worker, and vesting requirements. Information is provided not only for the current job (or jobs) of each spouse but for up to five past jobs as well. On the basis of the information provided in the SCF and on projected future earnings, future expected pension benefits (EPBw) are then projected to the year of retirement or the first year of pension eligibility. Then the present value of PW for current workers (w) is given by:

where RA is the expected age of retirement and LR = A − RA is the number of years to retirement.Footnote 25
A.2 Social Security wealth
For current Social Security beneficiaries (r), the procedure is again straightforward. Let SSB be the Social Security benefit currently being received by the retiree. Again, the SCF provides information for both husband and wife. Since Social Security benefits are indexed for inflation, SSW is given by

where it is assumed that the current Social Security rules remain in effect indefinitely.Footnote 26
The imputation of SSW among current workers is based on the worker's actual and projected earnings history estimated by a standard human capital regression equation. The steps are briefly as follows: first, coverage is assigned based on whether the individual expects to receive Social Security benefits and on whether the individual was salaried or self-employed. Second, on the basis of the person's earnings history, the person's Average Indexed Monthly Earnings (AIME) is computed. Third, on the basis of the rules current at the time of the survey year, the Primary Insurance Amount (PIA) is derived from AIME. Then,

As with PW, the integration runs from the number of years to retirement, LR, to the number of years when the retiree reaches age 109.Footnote 27