



1. Introduction
Energy transfer in rotating fluids has received significant attention due to its relevance to geo- and astrophysical fluid dynamics and due to the rich complexity of the nonlinear multi-scale interplay between coherent vortical structures, inertial waves and background small-scale nearly isotropic turbulence (Greenspan Reference Greenspan1968; Hopfinger & van Heijst Reference Hopfinger and van Heijst1993; Davidson Reference Davidson2013; Godeferd & Moisy Reference Godeferd and Moisy2015). Inertial waves supported by rotating fluids, with the Coriolis force acting as restoring force, represent an essential ingredient of the transfer. The crucial role of inertial waves is assured by (i) the specific form of the dispersion relation, which contains no length scale, and (ii) the possibility of a cascade of wave–wave interactions due to nonlinear terms in the Navier–Stokes equations governing the dynamics of rotating fluids.
The dispersion relation of inertial waves obtained by seeking plane-wave solutions of the linearised inviscid Navier–Stokes equations reads  $\omega =f k_{z}/k=f \cos \alpha$, where
 $\omega$ is the wave frequency,
 $f=2\varOmega$ is the Coriolis parameter with
 $\varOmega$ the rate of the background rigid-body rotation of the fluid and
 $k_{z}$ (respectively
 $k$) is the vertical component (respectively magnitude) of the wave vector
 $\boldsymbol {k}$ inclined at angle
 $\alpha$ to the vertical
 $z$-axis, which is taken as the axis of rotation. A similar type of dispersion relation
 $\omega =N k_h/k=N \sin \alpha$ holds for internal waves in a stratified fluid, with the buoyancy frequency
 $N$ replacing
 $f$, and
 $k_{h}$ the horizontal wavenumber. The absence of any length scale in the dispersion relation for inertial and internal waves implies that the global large-scale wave pattern depends on the geometry of wave generators and on the geometry that delimits the fluid volume – in particular, for the ocean, its bathymetry. Therefore, a rich variety of wave motions is encountered in rotating and stratified fluids as identified in early pioneering studies, and explored in detail in the subsequent literature: normal modes in bounded domains of simple geometry (sphere, axial cylinder, rectangular box) (Aldridge & Toomre Reference Aldridge and Toomre1969; McEwan Reference McEwan1970, Reference McEwan1971; Maas Reference Maas2003; Bewley et al. Reference Bewley, Lathrop, Maas and Sreenivasan2007; Lamriben et al. Reference Lamriben, Cortet, Moisy and Maas2011; Boisson et al. Reference Boisson, Lamriben, Maas, Cortet and Moisy2012), wave beams emanating from isolated oscillatory sources (Görtler Reference Görtler1943; Mowbray & Rarity Reference Mowbray and Rarity1967; Hendershott Reference Hendershott1969; Thomas & Stevenson Reference Thomas and Stevenson1972) and webs of wave beams (wave attractors) in bounded domains with sloping walls (Stern Reference Stern1963; Bretherton Reference Bretherton1964; Stewartson Reference Stewartson1971, Reference Stewartson1972; Maas & Lam Reference Maas and Lam1995; Maas et al. Reference Maas, Benielli, Sommeria and Lam1997; Manders & Maas Reference Manders and Maas2003; Klein et al. Reference Klein, Seelig, Kurgansky, Ghasemi V., Dan Borcia, Will, Schaller, Egbers and Harlander2014; Wu, Welfert & Lopez Reference Wu, Welfert and Lopez2020b). Of particular interest is the latter configuration in the context of the present paper.
Due to the form of the internal and inertial wave dispersion relations, wave reflection on a solid boundary follows a very specific law and is, in general, non-specular (Phillips Reference Phillips1963; Eriksen Reference Eriksen1982; Manders & Maas Reference Manders and Maas2004; Maas Reference Maas2005). To be more specific, in two-dimensional domains, this law leads to a focusing or a defocusing effect of wave beams upon reflection at sloping walls (Dauxois & Young Reference Dauxois and Young1999). In bounded or quasi-bounded two-dimensional domains, focusing prevails: the iterative process of subsequent wave reflections leads to the formation of a limit cycle, called a wave attractor, where the wave energy is concentrated (Maas & Lam Reference Maas and Lam1995; Maas et al. Reference Maas, Benielli, Sommeria and Lam1997; Sibgatullin & Ermanyuk Reference Sibgatullin and Ermanyuk2019). Relevant to the topic of the present study is the first experimental observation of an inertial wave attractor in an elongated trapezoidal tank that showed the generation of a persistent mean flow, right above the location where the attractor was being focused over the sloping bottom. This mean flow was speculated to be the result of the breaking of focused inertial waves, leading to the mixing of the background radial stratification in angular momentum with which the solidly rotating, homogeneous-density fluid is endowed (Maas Reference Maas2001). In a three-dimensional setting, the variety of possible configurations is significantly enriched, involving the possibility of wave-energy trapping on a limit cycle located at certain preferential planes of motion, provided that there is a billiard pathway connecting this plane and the initial direction of the wave-energy propagation (Hazewinkel, Maas & Dalziel Reference Hazewinkel, Maas and Dalziel2011; Pillet et al. Reference Pillet, Ermanyuk, Maas, Sibgatullin and Dauxois2018). The inertial-wave-ray billiard corresponding to the geophysically important case of a rotating spherical shell favours the formation of an attractor in the meridional plane (Bretherton Reference Bretherton1964; Stewartson Reference Stewartson1972; Friedlander & Siegmann Reference Friedlander and Siegmann1982; Maas & Harlander Reference Maas and Harlander2007; Rabitti & Maas Reference Rabitti and Maas2013). Accordingly, the rich literature on the linear dynamics of inertial wave attractors in rotating spherical layers considers the motions in ring-shaped meridional slices (Friedlander & Siegmann Reference Friedlander and Siegmann1982; Dintrans, Rieutord & Valdettaro Reference Dintrans, Rieutord and Valdettaro1999; Rieutord, Georgeot & Valdettaro Reference Rieutord, Georgeot and Valdettaro2000, Reference Rieutord, Georgeot and Valdettaro2001; Rieutord & Valdettaro Reference Rieutord and Valdettaro2010) and disregards the azimuthal coordinate.
It is noteworthy that the purely geometrical mechanism of iterative focusing, which is linear, is at the origin of a spectacular forward energy cascade in wave attractors: the energy injected into the system at global scale (i.e. at the scale of the system itself) is transferred to the scale corresponding to the width of the attractor branches, which, even in laboratory experiments, can be an order of magnitude smaller than the global scale (Brouzet et al. Reference Brouzet, Sibgatullin, Ermanyuk, Joubaud and Dauxois2017b). This small scale, or width of the inertial and internal wave beams in the linear regime, is set by the balance between geometric focusing and viscous dissipation and can be theoretically predicted with good agreement to experimental observations (Rieutord et al. Reference Rieutord, Georgeot and Valdettaro2000; Grisouard, Staquet & Pairaud Reference Grisouard, Staquet and Pairaud2008; Hazewinkel et al. Reference Hazewinkel, van Breevoort, Dalziel and Maas2008). Other wave-damping mechanisms such as interaction of waves with convective motions, ohmic damping in the presence of a magnetic field in conducting fluids and nonlinear parametric decay into secondary waves of shorter wavelength have also been proposed by Ogilvie (Reference Ogilvie2005), where a generic case with a weak inviscid ‘frictional’ damping force has been considered. Further, it has been shown experimentally that, at sufficiently high level of injected energy, internal wave attractors are prone to triadic resonance instability (TRI) (Scolan, Ermanyuk & Dauxois Reference Scolan, Ermanyuk and Dauxois2013). The replacement of purely viscous damping by the flux of energy carried by small-scale secondary waves (generated via TRI) away from the primary waves (i.e. from the beams of attractor) introduces a new nonlinear scaling for the beam width (Brouzet et al. Reference Brouzet, Sibgatullin, Ermanyuk, Joubaud and Dauxois2017b). Similar effects in inertial waves have been observed in numerical simulations (Jouve & Ogilvie Reference Jouve and Ogilvie2014). Let us note in passing that Jouve & Ogilvie (Reference Jouve and Ogilvie2014) considered a two-dimensional setting, physically corresponding to a torus of infinite radius having a tilted-square ‘meridional’ cross-section, so that any three-dimensional effects occurring in ‘equatorial’ planes were completely excluded. The development of the energy cascade in wave attractors with the increase of injected energy leads to wave turbulence, with a significant occurrence of overturning events generating irreversible mixing (Brouzet et al. Reference Brouzet, Ermanyuk, Joubaud, Sibgatullin and Dauxois2016a, Reference Brouzet, Ermanyuk, Joubaud, Pillet and Dauxois2017a; Davis et al. Reference Davis, Jamin, Deleuze, Joubaud and Dauxois2020), and such a cascade reaches a statistically steady state when a balance is established between the injected and dissipated energy (Jouve & Ogilvie Reference Jouve and Ogilvie2014; Davis et al. Reference Davis, Dauxois, Jamin and Joubaud2019). This is to be put in context with some recent development on the understanding of inertial wave turbulence in rotating flows (see, for example, the recent works of Le Reun, Favier & Le Bars (Reference Le Reun, Favier and Le Bars2019) and Brunet, Gallet & Cortet (Reference Brunet, Gallet and Cortet2020) on the competition between the saturation of rotating turbulence in three-dimensional (3-D) wave turbulence and in  $2$-D geostrophic turbulence).
It should be stressed that the overturning events and subsequent mixing are important constituents of the full energy cascade in internal wave attractors, and that they clearly fall apart from the wave turbulence formalism. Similarly, inertial wave turbulence plays an important but not exclusive role in the nonlinear dynamics of inertial wave attractors described in the present paper. The full scope of dynamic events constituting the energy transfer in inertial wave attractors extends well beyond the wave turbulence framework and should be discussed in the rich context of the literature on turbulence in rotating fluids. The wealth of this literature is such that, in this paper, we restrict ourselves to a cursory discussion of effects directly relevant to the present study. The reader interested in the current state of the art is referred to Davidson (Reference Davidson2013) and Godeferd & Moisy (Reference Godeferd and Moisy2015).
The focus of the interest in rotating wave turbulence (Galtier Reference Galtier2003; Bellet et al. Reference Bellet, Godeferd, Scott and Cambon2006; Davidson Reference Davidson2013; Godeferd & Moisy Reference Godeferd and Moisy2015) lies in the anisotropy of scales along the directions parallel and perpendicular to the axis of rotation, the presence of direct and inverse cascades of the key dynamically important quantities (energy, enstrophy, etc.), nonlinear wave–wave interactions among inertial waves and the development of coherent vortex structures aligned with the axis of rotation. The importance of these issues has been identified in early experimental studies with grid-generated turbulence in rotating tanks and their numerical counterparts (see for e.g. Hopfinger, Browand & Gagne Reference Hopfinger, Browand and Gagne1982; Godeferd & Lollini Reference Godeferd and Lollini1999).
In order to study in isolation the effect of rotation on (initially isotropic) turbulence, considerable attention has been focused on theoretical investigations in domains of infinite extent and numerical simulations in triply periodic boxes (e.g. Waleffe Reference Waleffe1993; Cambon, Mansour & Godeferd Reference Cambon, Mansour and Godeferd1997). It has been shown that the anisotropy develops due to nonlinear wave–wave interactions modified by rotation and concentrates energy in the plane normal to the rotation axis at a slow 2-D manifold (Cambon et al. Reference Cambon, Mansour and Godeferd1997). The relevance of the wave turbulence formalism and results of numerical simulations in triply periodic boxes to the experimental reality involving secondary currents, wall-induced vorticity and the formation of Ekman and Stewartson boundary layers remains an open issue. Indeed, various saturated turbulent regimes ranging between quasi-2-D and wave turbulence can be obtained in numerical simulations in triply periodic domains depending on the damping mechanism imposed on the geostrophic component to mimic the interaction with rigid boundaries (see, e.g. Le Reun et al. Reference Le Reun, Favier, Barker and Le Bars2017). Therefore, the experimental and numerical investigation of saturated turbulence regimes in a confined volume of a rotating fluid attracts significant interest. For such studies, the choice of the range of parameters and of the geometric set-up remains a non-trivial issue (see e.g. Godeferd & Moisy Reference Godeferd and Moisy2015). Typically, to ensure the development of a fully nonlinear energy cascade one needs to ensure a low value of the Ekman number  $E=\nu /(2\varOmega L^2)$, where
 $\nu$ is kinematic viscosity and
 $L$ is the global length scale, which for the bounded fluid has the meaning of the container size. Further, the effect of rotation must be sufficiently strong and therefore the global Rossby number
 $Ro^{L}=U/(2\varOmega L)$ (here
 $U$ is a velocity scale) must be sufficiently low. However,
 $Ro^{L}$ cannot be vanishingly small since it is responsible for triggering nonlinear effects. The micro-dynamics of the emerging vortex structures can be conveniently quantified by the micro-Rossby number
 $Ro^{\xi _z}=\xi _{z}/(2\varOmega )$, where
 $\xi _{z}$ is the perturbative vertical vorticity measured in the rotating frame. The skewness of the probability density functions (PDFs) of micro-Rossby numbers is known to reflect the symmetry breaking of cyclonic/anticyclonic motions, which is a well-known property of rotating systems (Bradshaw Reference Bradshaw1969; Pedley Reference Pedley1969; Hopfinger & van Heijst Reference Hopfinger and van Heijst1993).
The goal of our joint experimental and numerical investigation is to study the nonlinear fate of an inertial wave attractor in an axisymmetric setting under experimental conditions which are compatible with the formation of a slow 2-D manifold coupled to the genuinely 3-D inertial wave field. This is achieved by designing a set-up in the form of a rotating annulus having a trapezoidal (vertical) cross-section, thereby admitting a wave attractor structure in meridional planes and coherent vortex structures in the equatorial plane. Note that this geometry is similar to the one considered in Klein et al. (Reference Klein, Seelig, Kurgansky, Ghasemi V., Dan Borcia, Will, Schaller, Egbers and Harlander2014), which describes in great detail the formation of wave attractors and the role of the Stokes and Ekman boundary layers in an annular rotating domain with a central frustum under forcing due to libration. In the present paper we chose a configuration with a sloping (conical) bottom since, potentially, it may give rise to a topographic  $\beta$-effect, consisting of the support of topographic Rossby waves (Rossby Reference Rossby1939).
This work has been preceded by a preliminary numerical simulation of Sibgatullin et al. (Reference Sibgatullin, Ermanyuk, Maas, Xu and Dauxois2017) performed with the help of the spectral element method. The preliminary simulation has been run at a relatively weak forcing and qualitatively demonstrated the loss of axial symmetry and gradual build-up of inertial wave turbulence, but the saturated state, corresponding to the formation of a slow 2-D manifold, has not been reached. In the present paper, we address precisely this intriguing and previously overlooked issue. This manuscript is organised as follows. The experimental apparatus is described in § 2. In § 3 we describe the reference experiment demonstrating the emergence of a slow manifold in the form of a polygonal pattern of cyclonic vortices in the equatorial plane, which co-exists with a wave attractor (superimposed with wave turbulence) in the meridional plane. In § 4 we describe the results of direct numerical simulations performed with the help of the spectral element method for a set of forcing amplitudes. By using post-processing diagnostic tools we identify the key dynamic regimes, ranging from linear behaviour to TRI, and the generation of a slow manifold in the form of a polygonal vortex cluster (PVC). The latter regime reproduces the essential features of the reference experiment described in § 3. In § 5 we summarise the key findings of the paper.
2. Experimental apparatus
Figure 1 presents a schematic of the experimental apparatus in the vertical and horizontal cross-sections. The region of interest is bounded by two vertical acrylic cylinders, by the wave generator at the top and by an acrylic conical surface at the bottom. The outer and inner radii of the domain are  $R_1=20.2\ \mathrm {cm}$ and
 $R_0= 5.0\ \mathrm {cm}$, respectively. The generatrix of the conical bottom surface has an inclination of
 $45^\circ$, and the apex of the cone points upwards. Note that this cone can also be reversed if needed: the choice taken in the present study is explained in § 3.
Schematic of the experimental apparatus in (a) a vertical cross-section and (b) a horizontal cross-section. The hashed area is out of the experimental domain. The trapezoidal region of interest in the vertical plane is located between the inner and the outer cylinders, of radii  $R_0=5\ \mathrm {cm}$ and
 $R_1=20.2\ \mathrm {cm}$, respectively.

In a vertical (meridional) cross-section of the set-up, two trapezoidal domains are facing each other as shown in figure 1: note that the amplitude of the wave generator is greatly exaggerated and the upper bound of the fluid domain is actually nearly flat. The depth of fluid measured along the generatrix of the outer cylinder is  $H=40\ \mathrm {cm}$. In a horizontal (equatorial) cross-section, the experimental domain is a ring of width
 $L=R_1-R_0$. The whole set-up is inserted into a square acrylic tank of
 $100\ \mathrm {cm} \times 100\ \mathrm {cm}$ horizontal section and
 $65\ \mathrm {cm}$ height, as used in Boury, Peacock & Odier (Reference Boury, Peacock and Odier2019). Each part of the facility is rigidly fixed to prevent any parasitic vibration when the whole set-up, mounted on the rotating table, is brought to rotation at angular velocity
 $\varOmega =2{\rm \pi} /T$ where
 $T$ is the rotation period. The axis of rotation of the table coincides with the symmetry axis of the set-up.
The axisymmetric wave generator (Maurer et al. Reference Maurer, Ghaemsaidi, Joubaud, Peacock and Odier2017), adapted from a previous planar version (Gostiaux et al. Reference Gostiaux, Didelle, Mercier and Dauxois2006), is used to produce inertial waves via a prescribed motion of ring-shaped elements discretising the annular upper bound of the fluid domain. This device has been slightly modified to fit our needs, by lowering the cylinders with  $20\ \mathrm {cm}$ long aluminium rods. In the configuration presented in figure 2, the five inner cylinders have been removed. The motion amplitudes of the remaining eleven outer cylinders (grey boxes in the cross-section in figure 1a) have been adjusted to preserve the volume of fluid displaced during its motion, such that the profile
 $z(r)$ of the generator satisfies
 \begin{equation} \int_{R_0}^{R_1} z(r) r \,\text{d} r = 0. \end{equation}
In order to preserve the boundary condition of non-pumping fluid at the cylinder edges, the radial velocity  $v_r$ has to be zero at
 $R_0$ and
 $R_1$. This condition writes, in terms of the profile
 $z(r)$, as
 \begin{equation} \dfrac{\text{d} z}{\text{d} r} (r = R_0) = \dfrac{\text{d} z}{\text{d} r} (r = R_1) = 0. \end{equation}
As shown in Boury et al. (Reference Boury, Peacock and Odier2019), this facility is efficient in producing modes  $1$ to
 $3$ Bessel-shaped profiles, although the discretisation of the wave generator leads to lower resolved modes at high order. We therefore looked for the closest approximation of a radial mode
 $1$ profile in such a confined geometry. The selected profile is a cubic-shaped profile, as shown by the dashed line in figure 2, that sets the cam motion amplitudes. The highest amplitude for a cam is
 $a=2.5\ \mathrm {mm}$ next to the inner cylinder, low enough to ensure a gradual growth of nonlinear effects.
Configuration of the generator. The amplitude  $a$ of cam number
 $6$ is set to
 $2.5\ \mathrm {mm}$. Out of the experimental domain, the first five cams have their amplitude set to zero. The two dash-dotted vertical lines indicate the locations of the inner and outer cylinders.

The commonly used particle image velocimetry (PIV) technique was implemented to visualise the velocity fields. Horizontal and vertical laser planes were created using a  $2\ \mathrm {W}$ Ti:sapphire laser (wavelength
 $532\ \mathrm {nm}$) and a cylindrical lens. While filling the tank, hollow glass spheres and/or silver coated spheres of
 $10\ \mathrm {\mu } \mathrm {m}$ diameter were added for the purpose of visualisation. Particle displacements were recorded at
 $40\ \mathrm {Hz}$ using a camera located either on the side of the tank (vertical-plane visualisation) or down below facing a
 $45^\circ$ mirror placed under the tank (horizontal-plane visualisation). The CIVx algorithm was subsequently used to process the PIV raw images and extract the velocity fields (Fincham & Delerce Reference Fincham and Delerce2000). An additional filtering of the wave fields is often performed, in order to isolate the component at a given discrete frequency peak
 $\omega =\omega _{i}$, e.g. at the forcing frequency
 $\omega =\omega _0$. This post-processing is performed as follows: first, we compute the Fourier transform of the temporal signal associated with the wave field in each space point; the requested frequency is then isolated using a narrow Hamming window; finally, we compute the inverse Fourier transform, giving us the filtered wave field around the frequency of interest. The slow motions are isolated using a low-pass filter, with a cutoff frequency
 $\omega _c$ defining the width of the filter. It is important to note that the parameters of the frequency filters applied to the experimental and numerical data are identical. Below, we explicitly discuss the role of the width of the filters when appropriate. This issue is particularly relevant to the analysis of the numerical data.
3. Experimental results
Before getting to the description of the experimental results, let us make a few notes on the geometry of the set-up and the choice of the parameter range. As discussed in the introduction, the set-up is designed to allow for the nonlinear coupling between (i) inertial wave attractors in vertical (meridional) cross-sections and (ii) a slow 2-D manifold in the horizontal (equatorial) cross-section. We chose the geometric configuration of the conical bottom with the apex pointing upwards because, in such a geometry, the inertial waves undergo an additional focusing due to geometrical convergence of waves propagating from larger to smaller radial coordinates besides a primary focusing due to the reflection on the cone. This additional focusing favours the onset of instability close to the inner cylinder, as can be seen in the preliminary numerical study of Sibgatullin et al. (Reference Sibgatullin, Ermanyuk, Maas, Xu and Dauxois2017). Furthermore, in the saturated regime we expect to localise the slow 2-D manifold in the vicinity of the inner cylinder, thereby facilitating the observation of a ‘vortex condensate’ on top of an inertial wave background.
To reduce the effect of viscosity on the nonlinear energy transfer we chose a rather high rotation rate of the set-up,  $\varOmega =2.093 \ \mathrm {rad}\ \textrm {s}^{-1}$, so that the relevant value of the Ekman number
 $E=\nu /(2\varOmega L^2)$ in the present experiments is reasonably low – considering
 $\nu =10^{-6}\ \mathrm {m}^2\ \textrm {s}^{-1}$,
 $\varOmega =2.1\ \mathrm {rad} \ \mathrm {s}^{-1}$,
 $L=(R_0-R_1)=0.15\ \mathrm {m}$ or
 $0.4\ \mathrm {m}$ (max depth
 $H$), leads to
 $E=1.1 \times 10^{-5}$ or
 $E=1.5 \times 10^{-6}$. The Ekman dynamics typically relates to axial vertical processes, yielding a preference for the latter value. The global a priori Rossby number based on the horizontal scale of the fluid domain,
 $Ro^{L}=U/(2\varOmega L)$, can be defined using the maximum vertical speed of the generator rings as the velocity scale so that
 $U=a \omega _0$, where
 $\omega _0$ is the forcing frequency. For our experimental conditions, the amplitude
 $a=2.5\ \mathrm {mm}$ and frequency
 $\omega _0=1.7\ \mathrm {rad}\ \mathrm {s}^{-1}$ yield
 $Ro^{L}= 7 \times 10^{-3}$ so that the system is expected to be strongly affected by the Coriolis force. This low value of the global Rossby number, however, corresponds to a developed nonlinear energy transfer so that the observed saturated regime is more appropriately characterised by a relevant micro-Rossby number based on vertical component of vorticity, as discussed below.
Moreover, in this experimental section, we discuss only a single experiment that has been run at these parameters ( $a=2.5\ \mathrm {mm}$ and
 $\omega _0=1.7\ \mathrm {rad}\ \mathrm {s}^{-1}$). The reasons for this are multiple. First, the range of accessible parameters is very narrow given our experimental apparatus: a ray tracing theory indicates that the forcing frequency should be between
 $1.47$ and
 $2.14\ \mathrm {rad}\ {\mathrm {s}}^{-1}$ in order to observe a wave attractor, and the amplitude set for the generator profile is the optimum we can do. Indeed, on the one hand, since the cam amplitudes are set with a given error, the exact volume-conserving form of the forcing becomes difficult to prescribe as the amplitude decreases: the local amplitudes of several cams may fall within the error margin. On the other hand, at high forcing amplitudes the nonlinearity sets in too fast to allow the observation of the transient behaviour. At the instrumental level, additional limitations are imposed, especially in the horizontal plane, due to deposition of visualisation particles at the bottom of the test tank which decreases the imaging quality for visualisations in the horizontal plane. We therefore describe in detail only the experiment for which we have a complete data set. Nonetheless, we checked that the phenomenon is reproducible by performing experiments at different frequencies (
 $\omega _0=1.81\ \mathrm {rad}\ \mathrm {s}^{-1}$ and
 $\omega _0=1.92\ \mathrm {rad}\ \mathrm {s}^{-1}$), at a higher rotation rate (
 $\varOmega =2.723\ \mathrm {rad}\ \mathrm {s}^{-1}$ with
 $\omega _0=2.21\ \mathrm {rad}\ \mathrm {s}^{-1}$, to keep the same ratio
 $\omega _0/f$), in addition to many experiments at the same frequency and rotation rate as the one discussed and analysed below. In all these experiments, the same behaviour is qualitatively observed. To propose a more detailed study of the phenomenon, we then proceed with direct numerical simulations (DNS), as presented in § 4, notably by investigating lower forcing amplitudes.
3.1. Linear regime
In the linear regime we recover the classical dynamics: at the time scale of order  $10T_0$ after the start of the forcing, where
 $T_0=2{\rm \pi} /\omega _0$ is the forcing period, iterative focusing downscales the wave motion from the global scale
 $L$ to the scale associated with the width of the wave beams (Rieutord et al. Reference Rieutord, Georgeot and Valdettaro2000; Grisouard et al. Reference Grisouard, Staquet and Pairaud2008; Hazewinkel et al. Reference Hazewinkel, van Breevoort, Dalziel and Maas2008). Typical wave patterns observed in the quasi-linear regime at
 $t=17 T_0$ in horizontal and vertical planes are presented in the upper rows of figures 3 and 4 in terms of the quantities filtered at
 $\omega =\omega _0$ and
 $\omega =0$, respectively.
Fields of radial  $v_r$ and azimuthal
 $v_{\theta }$ velocity and vertical vorticity
 $\xi _{z}$ in the horizontal plane (at
 ${\simeq }20\ \mathrm {cm}$ depth) and of vertical velocity
 $v_z$ in the vertical plane. The presented quantities are filtered around
 $\omega =\omega _0$. Positive vorticity corresponds to cyclonic motion. The parallelogram with arrows in the vertical plane shows the theoretical attractor in which the energy propagates clockwise.

Fields of radial  $v_r$ and azimuthal
 $v_{\theta }$ velocity and vertical vorticity
 $\xi _{z}$ in the horizontal plane (at
 ${\simeq }20\ \mathrm {cm}$ depth) and of vertical velocity
 $v_z$ in the vertical plane. The presented quantities are filtered around
 $\omega =0$ with the low-pass filter having the upper cutoff frequency
 $\omega _c=\omega _0/3$. Positive vorticity corresponds to cyclonic motion.

Note that the width of the low-pass filter is set by the upper cutoff frequency, i.e.  $\omega _c=\omega _0/3$. As discussed later, the essential low-frequency content of the experimental signal (see figure 8) lies well below the chosen cutoff frequency. The choice of the width of the low-pass filter is important for a unified description of numerical and experimental results (see §§ 4.4 and 4.5 for details). For the experimental results as such the choice of the cutoff frequency is less important (i.e. a lower value of
 $\omega _c$ could be prescribed). For the sake of brevity, the result of the low-pass filtering is below referred to as the ‘signal filtered at
 $\omega =0$’.
For clarity, we visualise the fields of radial  $v_{r}$ and azimuthal
 $v_{\theta }$ velocity, vertical vorticity
 $\xi _{z}$ in the horizontal (equatorial) plane and the corresponding field of vertical velocity in the vertical (meridional) plane. It can be seen that the wave pattern observed at the forcing frequency (figure 3) in the horizontal plane is to a good approximation axisymmetric, while in the vertical trapezoidal cross-section we recover a classic pattern of the
 $(1,1)$ wave attractor (Maas et al. Reference Maas, Benielli, Sommeria and Lam1997; Maas Reference Maas2001) in agreement with the ray tracing, whose branch width is due to an equilibrium between wave focusing and viscous dissipation (Rieutord et al. Reference Rieutord, Georgeot and Valdettaro2000; Grisouard et al. Reference Grisouard, Staquet and Pairaud2008; Hazewinkel et al. Reference Hazewinkel, van Breevoort, Dalziel and Maas2008). The experimental signal filtered around
 $\omega =0$ remains weak at
 $t=17T_0$ (see figure 4).
3.2. Nonlinear regime
The development of the fully saturated nonlinear regime is illustrated in figures 3 and 4 by snapshots corresponding to  $t=50T_0$ and
 $t=150T_0$. The full vortex pattern representing the slow 2-D manifold is formed at the time scale of
 $100T_0$. It can be clearly seen that the initial axisymmetry observed at
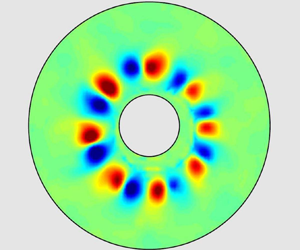
 $t=17T_0$ is lost while the slow manifold is gradually formed. The latter is represented by a regular polygonal system of eight cyclonic vortices. The vortices are nearly invariant in the vertical direction as attested by the right column of images in figure 4, representing the vertical velocity component. These vortex structures are reminiscent of the Taylor columns usually found in rotating systems but there is, however, a crucially important distinction: while the Taylor columns are normally formed as a consequence of a slow motion of a perturbation imposed on the rotating fluid, the coherent structures seen in figure 4 arise due to a nonlinear process which drains energy from the wave field toward the slow 2-D manifold. We note that the vertical velocity in the cyclonic vortices is directed downwards, corresponding to Ekman pumping, in agreement with existing experimental and numerical data (e.g. Hopfinger et al. Reference Hopfinger, Browand and Gagne1982; Godeferd & Lollini Reference Godeferd and Lollini1999). Interestingly, Lopez et al. (Reference Lopez, Hart, Marques, Kittelman and Shen2002) observed a similar breaking of a flow, axisymmetrically forced by a counter-rotating surface lid introducing azimuthal shear, into a discrete pattern of vortices distributed with an azimuthal periodicity. In their experiment, they relate the formation of such a manifold to the linear instability of the shear layer producing an azimuthal wave-like structure and, although much of the dynamics following the development of this instability is similar to the one we describe – e.g. the formation of a polygonal pattern of cyclonic vortices, intensified due to vortex stretching – the mechanism is different. In our set-up, the forcing introduces vertical motion in the fluid, and very little azimuthal motion is present at the beginning. As we will show in the numerical section, the instability observed in the nonlinear regime (figures 3 and 4) is then likely due to a triggered TRI that grows and becomes itself unstable. An internal boundary layer is formed around the attractor, which is prime candidate for the mixing of angular momentum, resulting in a sheared mean flow. It is worth mentioning that even in the fully saturated regime one can still identify the branches of the inertial wave attractor in the signal filtered around the forcing frequency
 $\omega =\omega _0$ (see figure 3). The relevance of such experimental regime (where a wave attractor in the meridional plane co-exists with a polygonal vortex system in the equatorial plane) to geo- and astrophysical systems admitting the existence of inertial wave attractors (Dintrans et al. Reference Dintrans, Rieutord and Valdettaro1999; Rieutord et al. Reference Rieutord, Georgeot and Valdettaro2001; Rieutord & Valdettaro Reference Rieutord and Valdettaro2010) represents an interesting direction for future research.
The visual evidence of the vortices is seen in figure 5 which presents the temporal evolution of the radial structure measured by sampling the azimuthal distribution of radial velocity at the radius  $r= 8\ \mathrm {cm}$ corresponding to the position of centres of vortices seen in figure 4. Figure 5 shows that coherent structures start to appear after approximately
 $25T_0$, and that, further, the vortex pattern self-organises so that new structures gradually appear and join the ensemble. After approximately
 $100T_0$ all structures move at the same rate in cyclonic direction. This rate corresponds to half a turn of the vortex cluster around the inner cylinder which lasts approximately
 $(88 \pm 2) T_0$.
Temporal evolution of the radial velocity as a function of azimuth,  $\theta$, obtained by taking profiles of radial velocity at radius
 $r= 8\ \mathrm {cm}$ in the horizontal plane at
 ${\simeq }20\ \mathrm {cm}$ depth. To guide the eye, we added a solid line showing that the cluster rotates half a turn (
 ${\rm \pi} \ \mathrm {rad}$) in
 $(88 \pm 2) T_0$.

The vertical vorticity field in the horizontal plane can be characterised statistically, by measuring the PDF of the micro-Rossby number  $Ro^{\xi _{z}}=\xi _{z}/(2\varOmega )$. The typical PDFs of
 $Ro^{\xi _{z}}$ corresponding to different stages of development of the coherent vortex structures are shown in figure 6. We calculate the PDFs for the raw signal and for the signal filtered around the forcing
 $\omega =\omega _0$ and
 $\omega =0$ frequencies. The PDFs are calculated over the surface of the ring-shaped zone between the inner and outer cylinders, and over the time span of
 $\pm 2T_0$ around the time instances indicated in figure 6. It can be seen that at the beginning of the process, when the motion is represented essentially by the axisymmetric waves, the PDFs of
 $Ro^{\xi _z}$ have a sharp symmetrical form. As the nonlinear energy transfer towards coherent vortex structures develops, there is a progressive evolution of the vorticity PDFs toward the shape characterised by asymmetric ‘shoulders’, which indicates a well-pronounced cyclonic/anticyclonic asymmetry. This asymmetry is clearly seen in the PDFs calculated over the raw signal and the signal filtered around zero frequency
 $\omega =0$ (figure 6a,c), suggesting that a few strong cyclonic vortices seen in figure 4 are responsible for the asymmetry of the PDFs. The PDFs calculated for the signal filtered at the forcing frequency (figure 6b) remain approximately symmetrical at any time. A slight asymmetry visible in the curve corresponding to time around
 $t=30T_0$ and
 $40T_0$ can be tentatively attributed to the process of genesis of the regular polygonal vortex pattern: new cyclonic vortices are emerging in the plane of visualisation and are joining the ensemble. Nonetheless, since the asymmetry is weak one cannot exclude also a minor contribution from experimental noise.
The PDFs of the vertical vorticity component at different times in the experiment. The curves (a–c) correspond to processing of the raw signal, and the signal filtered around  $\omega =\omega _0$ and
 $\omega =0$.

4. Numerical results
4.1. Numerical procedure
The experimental section of this paper provides an important reference result: we explicitly show that, under sufficiently strong forcing, the motion in the system represents a nonlinear combination of a complex inertial wave field, with an identifiable wave attractor at the forcing frequency, and a slow quasi-2-D manifold represented by a PVC. In the numerical simulations described below, we faithfully reproduce the geometry of the set-up shown in figure 1, and we use the experimental value of the rate of background rotation  $\varOmega =2.093\ \mathrm {rad}\ \mathrm {s}^{-1}$ and the forcing frequency
 $\omega _0=1.70\ \mathrm {rad}\ \mathrm {s}^{-1}$. We explore the effect of the forcing amplitude
 $a$ on the long-term nonlinear evolution of the inertial wave field in the set-up. Our purpose is to identify a sequence of observed regimes, ranging from the linear to the nonlinear regimes with a PVC described in the previous section.
The mathematical formulation of the problem consists in the Navier–Stokes equations and the continuity equation
 \begin{gather} \frac{\partial \boldsymbol{v}}{\partial t} + \left(\boldsymbol{v} \boldsymbol{\cdot} \boldsymbol{\nabla}\right) \boldsymbol{v} ={-}\boldsymbol{\nabla} {\tilde{p}} + \nu \Delta \boldsymbol{v} + 2{\boldsymbol{\varOmega}}\times \boldsymbol{v}, \end{gather}
 \begin{gather}\tilde{p} = \frac{p}{\rho} - \frac{1}{2}\left|{\boldsymbol{\varOmega}} \times \boldsymbol{r}\right|^2, \end{gather}
 \begin{gather}\boldsymbol{\nabla}\boldsymbol{\cdot} \boldsymbol{v} = 0, \end{gather}
with  $\boldsymbol{v}$ the velocity field and
 $\tilde{p}$ the pressure field. The governing equations are written in the Cartesian system
 $(x,y,z)$, co-rotating with the set-up, where the
 $z$-axis points upwards and coincides with the axis of rotation. The origin of the coordinate system is taken at the centre of the upper lid. Note that the fixed lid has no inherent rotation in the rotating system
 $(x,y,z)$. In the fixed inertial non-rotating reference frame we define the anti-clockwise background rotation
 $\varOmega$ as positive. In the rotating reference frame the cyclonic vorticity is positive, and the sense of the prograde motion is positive – cyclonic is by definition in the direction of rotation; here we take a right-handed Cartesian coordinate system such that in cylindrical coordinates,
 $(r,\theta , z)$, the azimuthal coordinate
 $\theta$ increases in cyclonic direction. With this convention the cyclonic vortices appear in red colour both in numerical and experimental vertical vorticity patterns. If the motion in a vertical radial plane is considered (e.g. plane
 $y=0$) we use the notations
 $(r,z)$. Throughout the paper we visualise the fluid motion in the horizontal plane located at mid-depth of the fluid volume.
To complete the mathematical statement of the problem we prescribe the boundary conditions as follows: the no-slip condition is imposed at all rigid boundaries except at the fixed flat horizontal upper lid where a specific harmonic forcing is applied to simulate the experimental one. We thus require that both horizontal components of the fluid velocity vector at the upper lid are equal to zero as in standard no-slip condition, while the vertical component is prescribed as explained below. Figure 2 shows the discrete experimental profile of the amplitude of motion of the rings in the generator. This discrete stepwise form approximates the smooth profile  $z(r)$ shown in figure 2 by the dashed blue line. The forcing imposed in the numerical experiments at the upper lid is axisymmetric, with the vertical component of the fluid velocity given by
 $v_{z}(r,t)=a\tilde {z}(r)\omega _0\exp (\omega _0 t)$ where
 $a$ is the forcing amplitude and
 $\tilde {z}(r)$ is a non-dimensional profile (of unit amplitude at
 $r=R_0$) such that
 $z(r) = a \tilde {z}(r)$ corresponds to the dashed blue curve of figure 2. Since we consider a small-amplitude input perturbation (more precisely,
 $a/(R_1-R_0) \leqslant 0.0167$), such an approach seems to be justified. In the case of internal wave attractors with similar implementation of the input forcing, we observed a good qualitative agreement between numerical and experimental results (Brouzet et al. Reference Brouzet, Sibgatullin, Scolan, Ermanyuk and Dauxois2016b). However, an extension to rotating fluids stratified in angular momentum, and not in density, and driven by Coriolis force (which does no work), and not by gravity (which does), is not fully evident. Both this issue and the difficulty of precise evaluation of the efficiency of the experimental wave generator leaves a considerable margin of uncertainty regarding the possible correspondence between the experimental amplitude and its numerical counterpart.
The numerical simulations have been performed for the following set of  $7$ forcing amplitudes:
 $a=0.2$,
 $0.5$,
 $1.0$,
 $1.8$,
 $2.0$,
 $2.4$,
 $2.5$ mm, the latter value corresponding to the experimental case. This corresponds to Rossby numbers
 $Ro^L$ ranging from
 $5 \times 10^{-4}$ to
 $7 \times 10^{-3}$. Below, we use a reduced representative set of amplitudes to describe the key regimes observed. The typical duration of the numerical experiments was approximately
 $200 T_{0}$, and in some cases up to
 $350 T_{0}$ (e.g. at
 $a=2.4$ mm).
As evident from the experimental part of the paper, we need to model a strongly nonlinear dynamical problem, where both viscosity and nonlinearity play a role. The numerical simulation of transient and turbulent regimes is a challenge as we have to follow the development of small-scale structures during long time intervals. In this context, spectral or Galerkin decomposition is known to be a robust approach to tackle the nonlinear effects without parasitic effects due to numerical viscosity. Classically, such a decomposition is possible only for simple geometry and boundary conditions. In the present work the direct numerical simulations are performed with the help of the spectral element method, using the open source code Nek5000 (see Fischer & Ronquist Reference Fischer and Ronquist1994; Fischer Reference Fischer1997; Deville, Fischer & Mund Reference Deville, Fischer and Mund2002). This method combines the advantages of high-order decomposition with geometric flexibility, and permits to run long-term simulations of strongly nonlinear dynamics. In the present study, we have used meshes with up to  $100$ thousand elements, with eighth-order polynomial decomposition within each element (up to
 $50$ millions degrees of freedom).
4.2. Energy spectra: a preliminary classification of the observed regimes
The snapshots of the simulated inertial wave fields in horizontal and vertical planes are shown in figure 7 for a set of forcing amplitudes  $a=0.2$,
 $1.0$,
 $2.0$, and
 $2.4$ mm at
 $t=100T_0$ (all images correspond to the same phase of the forcing). As the amplitude increases, one observes the increasing complexity of the inertial wave fields, in broad agreement with the known literature on the onset of TRI (Bordes et al. Reference Bordes, Moisy, Dauxois and Cortet2012; Bourget et al. Reference Bourget, Dauxois, Joubaud and Odier2013) and wave turbulence in internal and inertial wave attractors (Brouzet et al. Reference Brouzet, Ermanyuk, Joubaud, Sibgatullin and Dauxois2016a,Reference Brouzet, Sibgatullin, Scolan, Ermanyuk and Dauxoisb). In particular, one can see (i) visible broadening of the attractor branches at higher forcing (Brouzet et al. Reference Brouzet, Sibgatullin, Ermanyuk, Joubaud and Dauxois2017b), (ii) the signature of discrete azimuthal symmetry in the vertical vorticity pattern in horizontal plane at
 $a=1.0$ mm in agreement with preliminary simulations described in Sibgatullin et al. (Reference Sibgatullin, Ermanyuk, Maas, Xu and Dauxois2017) and (iii) the emerging signature of discrete patches of vertical vorticity in the horizontal plane at
 $a=2.4$ mm which are reminiscent of the experimental observations described in § 3. Below, we apply a set of post-processing tools to analyse the numerical data in some detail.
Snapshots of the vertical vorticity field, obtained by numerical simulations, in horizontal plane at mid-depth  $z=-20$ cm (a–d) and corresponding vertical velocity fields in vertical plane
 $y=0$ (e–h) taken at
 $t=100T_0$ at different values of the forcing amplitude
 $a$. Note that both in experiments and in numerical computations we denote cyclonic vorticity and prograde azimuthal velocity as positive. Thus the experimental and numerical patterns have the same colour coding and can be directly compared regardless of the direction of the background rotation.

The nonlinear regimes observed in the numerical simulations of an axisymmetrically forced inertial wave attractor can be roughly classified by considering the development of the signal spectra with time for a set of forcing amplitudes. The typical time–frequency diagrams obtained at different values of  $a$ are shown in figure 8. These diagrams are calculated similarly to Bourget et al. (Reference Bourget, Dauxois, Joubaud and Odier2013), as follows
 \begin{equation} S_r(\omega,t)=\left\langle \left| \int_{-\infty}^{+\infty} v_r(r,\theta,\tau)\textrm{e}^{\textrm{i}\omega \tau}h(t-\tau)\, \mbox{d}\tau \right|^2\right\rangle_{r\theta}, \end{equation}
where  $h$ is a Hamming window and
 $v_r$ is the radial component of the velocity field, and subscript
 $r\theta$ denotes a ring-shaped domain around the inner cylinder (
 $\theta \in [0, 2{\rm \pi} ]$,
 $r \in [5, 10]$ cm). The calculations are performed with the Matlab toolbox described in Flandrin (Reference Flandrin1999). The time–frequency diagrams were also calculated for other variables (e.g. azimuthal velocity, vertical vorticity), demonstrating similar qualitative behaviour.
Time–frequency diagram of the logarithm (colour) of the normalised spectrum of the radial velocity,  $S_r(\omega ,t) / \langle S_0 \rangle$, where
 $\langle S_0 \rangle$ is the time averaged spectrum at
 $\omega /\omega _0=1$, calculated with the help of (4.1) for a ring-shaped region around the inner cylinder (
 $r \in [5, 10]$ cm). The last image in the lower row corresponds to the time–frequency diagram calculated for the experimental data obtained at
 $a=2.5$ mm. The white dashed line indicates the cutoff frequency
 $f$.

The signatures of inertial wave turbulence can be detected by analysing the energy spectra (Yarom & Sharon Reference Yarom and Sharon2014). Note that the original approach implying 4-F Fourier analysis (three dimensions for space and one for time) has been proposed by Yarom & Sharon (Reference Yarom and Sharon2014) for a rotating system where the energy is injected via decorrelated random forcing thereby creating well-developed fully 3-D wave turbulence possessing no information on initial orientation of the input wave vector. In the present paper the energy is injected via axisymmetric deterministic forcing (with prescribed amplitude, length and frequency) producing a variety of dynamic regimes ranging from regular to turbulent (see figure 7). In order to adapt the method of post-processing to the observed wave patterns, we perform the analysis described in Yarom & Sharon (Reference Yarom and Sharon2014) in a vertical radial plane similar to Brouzet et al. (Reference Brouzet, Ermanyuk, Joubaud, Sibgatullin and Dauxois2016a), and, in addition, calculate the spatial energy spectrum in a horizontal plane. The latter is done to clarify the role of the integer-number azimuthal modes at different values of the forcing amplitude. Note that owing to different design of the experimental set-up such modes were not present in the case studied by Yarom & Sharon (Reference Yarom and Sharon2014). Before computing the energy spectra, the numerical results are re-sampled to yield the spatial resolution of  $0.2\ \textrm {cm} \times 0.2\ \textrm {cm}$ and the temporal resolution of
 $0.2$ s. This is done to reduce the amount of data and to match the typical experimental resolution. The wave-energy spectra in the vertical radial plane are computed using the 3-D Fourier transforms of the horizontal and vertical velocity fields,
 $\hat {v}_{r}(k_r,k_z,\omega )$ and
 $\hat {v}_{z}(k_r,k_z,\omega )$. The corresponding energy spectrum is defined as
 \begin{equation} E_\parallel(k_r,k_z,\omega)=\frac{|\hat{v}_{r}(k_r,k_z,\omega)|^2+|\hat{v}_{z}(k_r,k_z,\omega)|^2}{2A_\parallel T}, \end{equation}
where  $A_\parallel =40\times 15\ \textrm {cm}^2$ is the area considered in the vertical plane and
 $T=50T_0$ is the duration of the time-history sample. The calculations for all the cases shown below in figure 9 are performed for the numerical data obtained for
 $t \in [100T_0, 150T_0]$. The spatial resolution of re-sampled data and the size of the fluid domain provide respectively the upper and lower bounds in wavenumbers, of order
 $k_{max}=8\ \mathrm {rad}\ \mathrm {cm}^{-1}$ and
 $k_{min}=0.2 \ \mathrm {rad}\ \mathrm {cm}^{-1}$. Interpolation is performed to express the energy spectrum
 $E_\parallel (k_r,k_z,\omega )$ as a function of
 $E_\parallel (k,\alpha ,\omega )$, with
 $k$, the norm of the wave vector. Then, we perform integration over the entire range of resolved wave vectors
 $[k_{min}, k_{max}]$ as follows:
 \begin{equation} E_\parallel(\alpha,\omega)=\int_{k_{min}}^{k_{max}}E_\parallel(k,\alpha,\omega)k \,{\mathrm{d}}k. \end{equation}
The calculated energy density  $E_\parallel (\alpha ,\omega )$ is normalised by the frequency energy density
 $E_\parallel (\omega )$, obtained by integrating
 $E_\parallel (\alpha ,\omega )$ over all directions. It should be stressed that it is only for a purely axisymmetric wave perturbation that
 $E_\parallel (\alpha ,\omega )$, defined by (4.6), is a function of the true angle
 $\alpha$ between the vector of the phase speed and the horizontal plane. In the axisymmetric case, the vector
 $(k_{r},k_{z},k_{\theta })$ has
 $k_{\theta }=0$, where the direction of the component
 $k_{\theta }$ is defined by a vector orthonormal to the
 $(r,z)$ plane. In the general case, the vector
 $(k_{r},k_{z},k_{\theta })$ is inclined at an angle
 $\alpha =\arctan [k_{z}/(k_{r}^2+k_{\theta }^2)^{1/2}]$ to the vertical axis. A projection of this vector onto the vertical
 $(r,z)$ plane is seen at the apparent angle
 $\alpha _{*}=\arctan [k_{z}/k_{r}]$. Restricting, for brevity, our attention to small values of
 $\alpha$ and
 $\alpha _{*}$, the difference between the two angles can be quantitatively characterised as
 $[1+(k_{\theta }^2/k_{r}^2)]^{1/2} - 1$. For example, the relative difference
 $|(\alpha _{*}-\alpha )/\alpha |<0.1$ translates to
 $|k_{\theta }/k_{r}|<0.46$, thereby admitting the vectors whose azimuthal direction differs from the
 $(r,z)$ plane by less than
 ${\pm }25^{\circ }$.
The upper four images present the normalised energy spectra  $(E_\parallel (\alpha ,\omega )/E_\parallel (\omega ))$ at different values of the forcing amplitude. Colours indicate the levels of normalised energy spectra. The white dashed lines correspond to the dispersion relation
 $\pm \cos \alpha =\omega /f$. Note that the energy peaks are not always localised at the dispersion curve, owing partially to the departure of the wave vectors from
 $(r,z)$ plane and to the contribution of slaved (evanescent) waves (see discussion in the text). The lower four images show the energy spectra in the horizontal plane
 $E_\perp (k_{r},n_{\theta })$ on a logarithmic scale at different values of the forcing amplitude. By combining information from the spectra calculated in the vertical and horizontal planes one can see the evolution of wave regimes from nearly linear at
 $a=0.2$ mm to wave turbulence evolving from a ‘discrete’ form at
 $a=1.0$ to a more ‘continuous’ form at
 $2.0$ and
 $a=2.4$ mm. The latter is particularly well seen in terms of
 $E_\perp (k_{r},n_{\theta })$. In all cases the axisymmetric component of the wave field (corresponding to
 $n_{\theta }=0$) is most significant.

An additional analysis is performed in the horizontal plane located at the mid-depth of the set-up. The wave-energy spectrum in the horizontal plane is computed using the 3-D Fourier transform of the horizontal components of the velocity field,  $\hat {v}_{r}(k_r,n_{\theta },\omega )$ and
 $\hat {v}_{\theta }(k_r,n_{\theta },\omega )$. Here,
 $n_{\theta }=2{\rm \pi} /\Delta \theta$ is the non-dimensional azimuthal wavenumber, where
 $\Delta \theta$ is the azimuthal wavelength (in radians). Note that using
 $n_{\theta }$ is more convenient than using
 $k_{\theta }$ (measured in
 $\mathrm {rad}\ \mathrm {m}^{-1}$) in view of the discrete azimuthal symmetry of the wave patterns in the horizontal plane clearly seen in figure 7 at
 $a=1.0$ mm. The corresponding energy spectrum is defined as
 \begin{equation} E_\perp(k_r,n_{\theta},\omega)=\frac{|\hat{v}_{r}(k_r,n_{\theta},\omega)|^2+|\hat{v}_{\theta}(k_r,n_{\theta},\omega)|^2}{2A_{r,\theta}T}, \end{equation}
where  $A_{r,\theta }$ is the area considered (
 $r \in [R_0,R_1]$,
 $\theta \in [0,2{\rm \pi} ]$) and
 $T=50T_0$ is the duration of the time-history sample. The spectrum is integrated over the frequency range
 $\omega \in [-f,f]$ in which inertial waves can propagate, as follows:
 \begin{equation} E_\perp(k_r,n_{\theta})=\int_{{-}f}^{f}E_\perp(k_r,n_{\theta},\omega)\,{\mathrm{d}}\omega. \end{equation}
Using (4.4), (4.6) and (4.8), we obtain figures 8 and 9, which show the time–frequency diagram of the logarithm of the normalised spectrum of the radial velocity, and the energy spectra  $E_\parallel$ and
 $E_\perp$ at different forcing amplitudes, respectively. From these figures we can infer information on the qualitative evolution of the wave regime with amplitude. It can be seen in figure 8 that for the lowest amplitude considered (
 $a=0.2$ mm), the frequency spectrum is monochromatic, with a weak but detectable component at twice the forcing frequency. This is confirmed by the energy spectrum for this amplitude represented in figure 9: the energy is localised on the linear dispersion relation at discrete ‘spots’ corresponding to
 $\omega _0/f=0.39$ and
 $2\omega _0/f=0.78$. The perturbation is nearly axisymmetric, a weak contribution of low azimuthal modes can be detected in terms of
 $E_\perp (k_{r},n_{\theta })$.
At higher forcing amplitude ( $a=1.0$ mm), one can observe (see figure 8) a classic signature of TRI. One can see signal components at the frequencies of two most energetic secondary waves which satisfy the condition
 $\omega _0=\omega _1+\omega _2$, with
 $\omega _1/\omega _0=0.32$ and
 $\omega _2/\omega _0=0.68$ (here, the subscripts
 $0$,
 $1$ and
 $2$ denote the parameters of the primary wave, and two secondary waves). Also there is a significant energy content at frequencies
 $\omega _1+\omega _0$,
 $\omega _2+\omega _0$, and the multiples of the forcing frequency
 $2\omega _0$ and
 $3\omega _0$. Thus, both TRI and the two-wave interactions (Beckebanze et al. Reference Beckebanze, Grayson, Maas and Dalziel2021; Boury, Peacock & Odier Reference Boury, Peacock and Odier2021) are present in the system and play a role. The corresponding energy spectrum shown in figure 9 demonstrates that the linear dispersion relation attracts the energy maxima. However, some energy content falls apart from the dispersion relation, producing a pattern of weak horizontal stripes as consequence of the difference between angles
 $\alpha$ and
 $\alpha _{*}$ arising from quasi-2-D analysis (4.6). In terms of
 $E_{\perp }(k_{r},n_{\theta })$ we observe a contribution of low azimuthal modes, where significant peaks can be distinguished at
 $n_{\theta }=\pm 12$. As it will be discussed in § 4.3, this is related with spiral waves propagating in retrograde and prograde sense which are likely a consequence of triadic resonance. The data analysis presented in figures 8 and 9 for
 $a=1$ mm supports the idea that this regime corresponds to the onset of weak (discrete) inertial wave turbulence.
As the forcing amplitude increases further ( $a=2.0$,
 $2.4$, and
 $2.5$ mm), one can observe a significant increase of the energy content in the continuous part of the frequency spectrum, accompanied by an enrichment of the discrete part (figure 8). The peaks corresponding to TRI-generated secondary waves
 $\omega _1$ and
 $\omega _2$ (detected at
 $a=1.0$ mm) remain persistent at higher forcing amplitudes. In general, the overall trends seen in figure 8 at higher forcing amplitudes correspond well to the effects described in the literature on internal wave attractors in stratified fluids in the nonlinear regime (Brouzet et al. Reference Brouzet, Ermanyuk, Joubaud, Sibgatullin and Dauxois2016a, Reference Brouzet, Ermanyuk, Joubaud, Pillet and Dauxois2017a). There is, however, an important distinction: in the case of rotating fluid we observe a highly complicated frequency content of the signal at the low-frequency end of the spectrum which does not have a straightforward interpretation in terms of TRI. In the context of this paper this issue is of central interest (see § 4.5 for discussion). Note that some discrete frequency components seen in the numerical calculations performed at
 $a=2.4$ and 2.5 mm appear also in the experimental spectrum. In the numerical simulations, the transients seem to have a significantly longer duration as compared with the experiment. This issue is discussed in § 4.5.
The energy spectra for higher forcing amplitudes shown in figure 9 seem to be consistent with the concept of inertial wave turbulence. As  $a$ increases, the character of wave turbulence gradually evolves from a ‘discrete’ form at
 $a=1.0$ to a more ‘continuous’ form at
 $a=2.0$ and
 $2.4$ mm. The latter is particularly well seen in terms of
 $E_{\perp }(k_{r},n_{\theta })$. The presence of a significant continuous component in
 $E_{\perp }(k_{r},n_{\theta })$ is a direct consequence of the loss of the discrete azimuthal symmetry observed in figure 7 at
 $a=2.0$ and
 $2.4$ mm.
As the energy spectra  $E_\parallel (\alpha ,\omega )$ are calculated in the vertical plane we can see that the structure of the low-frequency zones (where the dispersion relation crosses the line
 ${\omega /f=0}$) evolves considerably as
 $a$ increases. In the quasi-linear case (
 $a=0.2$ mm) there is no detectable energy component at
 $\omega /f\simeq 0$. As
 $a$ increases, a complex discrete structure emerges in the vicinity of
 $\omega /f\simeq 0$. At higher
 $a$ this structure evolves toward a smoothed energy distribution, which can be interpreted as a trend toward merging of energy peaks corresponding to discrete frequencies.
It has been already noted that some energy content falls apart from the dispersion relation due to the difference between  $\alpha$ and
 $\alpha _{*}$ as a consequence of the 2-D analysis in (4.6). Let us note that there is an additional mechanism for the concentration of such peaks, namely along the vertical lines at fixed
 $\alpha$ corresponding to the forcing frequency
 $\omega _0$. This means that forced higher harmonics are generated which propagate at an angle belonging to that of the fundamental frequency, as opposed to free higher harmonics that follow the dispersion curves. These ‘slaved’ higher harmonics have been encountered in internal wave attractors before (Lam & Maas Reference Lam and Maas2008). An interested reader is relegated to Davis (Reference Davis2019), in which a similar phenomenon is observed and discussed in more detail.
4.3. Triadic resonant instability in a rotating annulus
Relevant to our study, let us consider in more detail the TRI in the rotating annulus. TRI has been observed in various configurations of rotating flows involving precession, and often led to symmetry breaking and to the formation of vortical structures distributed periodically (Albrecht et al. Reference Albrecht, Blackburn, Lopez, Manasseh and Meunier2015; Marques & Lopez Reference Marques and Lopez2015; Albrecht et al. Reference Albrecht, Blackburn, Lopez, Manasseh and Meunier2018; Lopez & Marques Reference Lopez and Marques2018; Wu, Welfert & Lopez Reference Wu, Welfert and Lopez2020a). For example, in the case of a rotating cylinder (e.g. Marques & Lopez Reference Marques and Lopez2015), this instability gives rise to structures aligned with the rotation axis and distributed along  $\theta$.
The data presented in figure 8 for  $a=1.0$ mm show well-localised discrete frequency components. Using the technique of Hilbert transform filtering introduced in Mercier, Garnier & Dauxois (Reference Mercier, Garnier and Dauxois2008), one can separate the key components of the wave patterns observed in vertical and horizontal planes as shown in figures 10 and 11. The filtered wave field components seen in the vertical plane remind of the patterns already described in literature for internal wave attractors (see e.g. Scolan et al. Reference Scolan, Ermanyuk and Dauxois2013; Brouzet et al. Reference Brouzet, Ermanyuk, Joubaud, Pillet and Dauxois2017a). The length of the wave vector components can be evaluated with reasonable accuracy as location of the maximum of corresponding PDFs calculated over the domain of interest. The corresponding vector triad in vertical plane is shown in figure 12(a) together with the curves defining the admissible wave triads. It can be seen that the observed triad is consistent with the theoretical curve, with reasonable experimental accuracy.
The components of the inertial wave field (displayed in terms of the vertical velocity component) filtered at frequencies  $\omega _0$,
 $\omega _1$ and
 $\omega _2$ (a–c), with the corresponding phase patterns (d–f). Only one branch of the wave attractor is shown. The corresponding vector triad is shown in figure 12(a).

The components of the vertical vorticity field  $\xi _z$ filtered at frequencies
 $\omega _0$,
 $\omega _1$ and
 $\omega _2$ (a–c), with corresponding filtered wave fields as function of radial coordinate
 $r$ and azimuthal coordinate
 $\theta$, with amplitude shown in (d–f) and phase shown in (g–i). Note that the primary wave is axisymmetric and propagates radially, while the secondary waves corresponding to frequencies
 $\omega _1$ and
 $\omega _2$ propagate azimuthally in the prograde (cyclonic) and retrograde (anti-cyclonic) directions, respectively, and the azimuthal components of the wave vectors have the same length. The corresponding vector triad is shown in figure 12(b).

Verification of the triadic resonance: (a) curve of admissible wave vector triads in the vertical plane  $(k_r, k_z)$ with superimposed measured wave vectors; (b) wave vector triad in the horizontal plane
 $(k_r, n_\theta )$. The wave vector triads shown in the left and right panels represent their projections on the vertical and horizontal planes respectively, and correspond to the patterns depicted in figures 10 and 11. The solid, dashed, and dash-dotted lines in panel (a) represent the locus of the tips of the resonant wave vectors according to the dispersion relation.

The pattern of triadic resonance in a ring-shaped domain seen in the horizontal plane possesses a discrete symmetry as shown in figure 11. This is in agreement with earlier observations described in Sibgatullin et al. (Reference Sibgatullin, Ermanyuk, Maas, Xu and Dauxois2017), and with raw snapshots shown in figure 7 for  $a=1.0$ mm in the present paper. Thus, the azimuthal pattern in the horizontal plane is reminiscent of ‘modal’ triadic resonance in a rectangular box described in McEwan (Reference McEwan1971). However, the modal pattern of internal waves in the vertical plane (McEwan Reference McEwan1971) is clearly compatible with the dispersion relation, while we are not aware of any theoretical work predicting the number of the expected azimuthal mode of the secondary waves in a ring-shaped domain. Note, however, that Lin, Noir & Jackson (Reference Lin, Noir and Jackson2014) and Lagrange, Meunier & Eloy (Reference Lagrange, Meunier and Eloy2016) have looked at this in slightly different geometries (such as a different orientation of the cylinder axis). Assuming the triadic resonance as the underlying key mechanism and a discrete symmetry of the azimuthal wave pattern, we can expect that the purely axisymmetric wave (i.e. zero azimuthal mode) at the forcing frequency
 $\omega _0$ should give rise to two secondary waves propagating in the opposite azimuthal directions (cyclonic and anti-cyclonic) and corresponding to the same azimuthal mode. This is confirmed by the data presented in figure 11 and by the construction of the projection of the wave vector triad on the horizontal plane shown in figure 12(b). Both secondary waves seen in the horizontal plane correspond to 12-th azimuthal mode. The secondary waves corresponding to
 $\omega _1$ and
 $\omega _2$ propagate in cyclonic and anti-cyclonic directions, respectively.
Summing up, we can characterise each wave component by three numbers  $(k_{r},k_{z},n_{\theta })$, where
 $k_{r}, k_{z}$ are conventional wave vector components measured in
 $r,z$-plane (in
 $\mathrm {rad}\ \textrm {cm}^{-1}$), while
 $n_{\theta }=2{\rm \pi} /\Delta \theta$ is non-dimensional integer azimuthal mode number, where
 $\Delta \theta$ is the azimuthal wave length (in radians). For the vector triads depicted in figure 12, we have
 $(1.38,0.94,0)$,
 $(-1.88,-0.43,-12)$ and
 $(3.02,1.26,12)$ for the primary and two secondary waves, respectively. With reasonable accuracy we have
 $k_{r}^0 \approx k_{r}^1+k_{r}^2$,
 $k_{z}^0 \approx k_{z}^1+k_{z}^2$ and
 $n_{\theta }^0=0=n_{\theta }^1+n_{\theta }^2$. It should be stressed that the wave vector components can be strictly defined only for spatially monochromatic fields (or approximately monochromatic as in Bourget et al. Reference Bourget, Dauxois, Joubaud and Odier2013) while for narrow wave beams the objective measurement of wave vector components raises some problems as discussed in Fan & Akylas (Reference Fan and Akylas2020). However, experimentally it is often possible to construct the PDFs for the wave vector components measured in a zone of interest and estimate the length of the wave vectors from the positions of PDF's maxima. This approach is taken in the present paper. In light of the results presented in figure 12, we note that the resonance conditions for TRI are satisfied here. Moreover, it is interesting to point out that the primary wave is three-dimensional but axisymmetric, and therefore mostly lives in a vertical plane, contrary to the two secondary waves, which are non-axisymmetric and fully three-dimensional. At this stage, however, the discussion of this
 $3$-D TRI is purely exploratory. The reader interested in a more thorough development is referred to Boury (Reference Boury2020) (§ 7.5.2).
4.4. Transition to a PVC
Let us now consider how the regime in which a PVC emerges in the numerical simulations when we systematically increase the forcing amplitude. By considering the results obtained at  $a=1.0$ mm we have already made an important observation that the low-frequency behaviour of the system is represented by cyclonic propagation of a secondary wave generated by triadic resonance. In other words, we can say that, after the onset of TRI, this low-frequency component of the wave field represents a ‘germ’ of the slow manifold. Therefore, to compare the flow patterns representing the slow manifold in the horizontal plane it is reasonable to use the low-pass filtering with the cutoff frequency set around
 $\omega _c=\omega _0/3$. The width of this filter corresponds to the width of the filter used in the experimental part of the paper to separate the low-frequency signal. Moreover, the time–frequency diagrams shown in figure 8 allow us to conclude that this width of the low-pass filter captures the essential features of the low-frequency behaviour of the system. By applying this filter we can identify the variation of the structure of the vertical vorticity field at different forcing amplitudes, as shown in figure 13. The snapshot of the pattern is complemented by a video in supplementary material available at https://doi.org/10.1017/jfm.2021.703. The snapshots and the video are taken in vicinity of the time instant
 $t=100T_0$. It can be clearly seen that the cyclonic wave motion at
 $a=1.0$ mm is replaced by a highly complicated pattern which exhibits cyclonic/anti-cyclonic rotation close to the inner/outer cylinder, respectively. We illustrate such a regime by the data obtained at
 $a=2.0$ mm. This regime is observed in a certain range of the forcing amplitudes (around
 $a\in [1.8\ \mathrm {mm};2.0\ \mathrm {mm}]$). Thus, the transition from the regime with wave field possessing discrete azimuthal symmetry (
 $a=1.0$ mm) to the regime with PVC (
 $a=2.4$ mm) is highly non-trivial. The intermediate regime observed at
 $a=2.0$ mm deserves a special study which falls outside of the scope of the present paper.
The low-frequency pattern of the vertical vorticity field filtered by low-pass filter with the cutoff frequency  $\omega _c=\omega _0/3$ at different values of the forcing amplitude in the DNS and for the experimental case. The images correspond to the time
 $t=100 T_0$. In the supplementary material we provide a short video of this pattern demonstrating prograde motion of the wave pattern at
 $a=1.0$ mm, prograde/retrograde motion close to inner/outer cylinder respectively at
 $a=2.0$ mm and prograde motion of the vortex cluster at
 $a=2.4$ mm (in numerical simulations) and at
 $a=2.5$ mm (in experiments). Note that for experimental data we take a mirror image, so that the background rotation and prograde motion are anti-clockwise. The numerically calculated wave/vortex patterns are rotating around the central cylinder while interacting with the mean azimuthal currents shown in the right panel of figure 17.

As the forcing amplitude increases further, one can clearly identify the patches of cyclonic vorticity arranged in polygonal fashion, with a slow drift of the vortex cluster in prograde direction. This regime is shown in figure 13 for  $a=2.4$ mm. A very similar regime is observed at
 $a=2.5$ mm, which suggests that the regime is sufficiently robust and can be reproduced in a certain range of the forcing amplitudes. The numerically obtained vortex pattern with
 $7$ vortices arranged at the vertices of a regular polygon can be compared with the experimental vortex pattern with
 $8$ vortices. We see that qualitatively the patterns are similar, and, since the colour scale for both patterns is the same, at quantitative level there is a reasonable agreement between the magnitudes of the vertical vorticity. However, the mechanism of the formation of the vortex patches and the long-term evolution of the pattern in the numerical calculations remain to be identified. To do this we performed a long series of calculations specifically for this regime at
 $a=2.4$ mm. The results of these simulations are described below.
Our results point towards the existence of a transition between two different regimes, one dominated by weakly nonlinear effects and the onset of TRI at low forcing amplitude, and another one characterised by the existence of a PVC at higher forcing amplitudes. As suggested by the numerical data presented in figures 8, 9 and 13, this transition is likely to occur between  $a=1.0$ and
 $a=2.0\ \mathrm {mm}$. The experimental results fall into the second case with the fully developed PVC manifold. This transition is also evidenced by the change in characteristic Reynolds number, computed at the wave scale, as shown in table 1, since its order of magnitude changes from
 $10$ to
 $100$ between these two regimes, thus indicating stronger and more efficient energetic transfers between scales. However, no obvious scaling of
 $Re$ with
 $a$ could be found, and a detailed study of this transition falls beyond the scope of this study.
Estimation of the Reynolds number  $Re$, computed at the wave scale, at
 $t=200T_0$ in the numerics and in the experiment.

4.5. Long-term fate of the PVC in numerical simulations
As previously mentioned, at relatively high forcing amplitudes the system evolves in a state where the formation of vertical vortices organised periodically around the inner cylinder becomes the characteristic feature. We present in figure 14 a 3-D numerical visualisation of this transition in the case of the forcing amplitude  $a=2.4\ \mathrm {mm}$, using
 $\lambda _2$ isosurfaces computed based on the method proposed by Jeong & Hussain (Reference Jeong and Hussain1995). The snapshots are taken at three different times and show the laminar regime (panel (a), at
 $t=13.5 T_0$), the transitional small-scale turbulent state (panel (b), at
 $t= 27.1 T_0$) and the developed regime (panel (c), at
 $t= 389.6 T_0$). Shortly after the beginning of the simulation, the flow becomes weakly turbulent and small-scale features can be detected close to the inner cylinder, before being reorganised into the well-defined vertical vortices consistently observed both in the DNS and in the experiments.
Visualisation of the vorticity in the numerical simulation at forcing amplitude  $a=2.4\ \mathrm {mm}$ using
 $\lambda _2$ isosurfaces, following the method detailed in Jeong & Hussain (Reference Jeong and Hussain1995). Snapshots are taken, from left to right, at
 $t=13.5 T_0$,
 $t= 27.1 T_0$ and
 $t= 389.6 T_0$.

The long-term time–frequency diagram corresponding to this forcing amplitude ( $a=2.4$ mm) is presented in figure 15. The diagram is calculated over
 $350$ forcing periods. Window 6 shows schematically the domain where the low-pass filter with the cutoff frequency
 $\omega _c=\omega _0/3$ has been applied to obtain the vortex pattern depicted in figure 13 for
 $a=2.4$ mm. This pattern remains virtually the same over a long time span. In particular, the
 $7$-vortex cluster can be observed when window 6 is shifted in time to cover the narrow peaks 3 and 4. These peaks 3 and 4 are well localised, making possible a narrow-band filtering of the corresponding wave components of the vertical vorticity field. The result of such filtering is represented in figure 15 by the patterns corresponding to
 $\omega _3=0.36\ \mathrm {rad}\ \mathrm {s}^{-1}$ (
 $\omega _{3}/\omega _0=0.21$) and
 $\omega _4=0.16\ \mathrm {rad}\ \mathrm {s}^{-1}$ (
 $\omega _{4}/\omega _0=0.09$). The former represents a wave of seventh azimuthal mode propagating in the cyclonic (prograde) direction in the close vicinity of the inner cylinder, the positive and negative patches of vorticity in this wave have the same magnitude. The latter represents a wave of the fifth azimuthal mode propagating in the anti-cyclonic (retrograde) direction. Note that the wave corresponding to
 $\omega _{4}/\omega _0=0.09$ is significantly weaker in magnitude than the wave corresponding to
 $\omega _{3}/\omega _0=0.21$. Apart from this well-defined discrete components there is also a contribution from the continuous part of the spectrum. Thus, the
 $7$-vortex pattern seen in figure 13 can be interpreted as azimuthal wave of seventh mode propagating in prograde sense over weak background vorticity pattern. In this background pattern we can identify fifth azimuthal retrograde wave mode while other discrete wave contributions are difficult to identify. The observable result of such superposition is the polygonal
 $7$-vortex pattern.
The time–frequency diagram corresponding to the case  $a=2.4$ mm (a). (b–d) Show the snapshots of the vertical vorticity fields filtered in narrow frequency windows
 $3$ and
 $4$ around
 $t=170T_0$, and via low-pass filter schematically shown as
 $5$ around
 $t=310T_0$. Patterns
 $3$ and
 $4$ propagate in prograde and retrograde directions, respectively. Note that the discrete low-frequency components seen in the time–frequency diagram exhibit a trend toward merging at
 $t>225T_0$, and filter
 $5$ is applied to the result of the merging process. The result of filtering with
 $6$ (low pass-filter, earlier times) is shown in figure 13(c).

It should be noted that at long time scale the observable vortex pattern evolves. It can be seen in figure 15 that after approximately  $225T_0$ the discrete frequency components at the low-frequency end of the spectrum exhibit a strong trend towards merging. Towards the time around
 $275T_0$ it becomes difficult to distinguish individual low-frequency wave components. The low-pass filtering applied to the domain schematically shown by rectangle 5 returns the vorticity pattern which develops as result of merging of the low-frequency discrete wave components. The resulting slow manifold is represented by a PVC with
 $8$ cyclonic vortices drifting in cyclonic direction. This pattern is very similar, in terms of strength and spatial arrangement of vortices, to the experimental pattern shown in figure 13. The evolution of the azimuthal drift of the vortex cluster with time is illustrated in figure 16 representing the numerical counterpart of figure 5. It can be seen that numerical simulations yield
 $6$ to
 $3$ times faster drift than the experimentally measured one. Note that the time–frequency diagram itself shows some discrepancies between the experimental and the numerical data, possibly due to dissipative effects, but overall the correspondence gets better towards the end of the data sets and, asymptotically, the same peaks are observed.
Same as experimental figure 5 but computed from the numerical data. It can be seen that in the numerical simulations the prograde motion of the vortex cluster is significantly faster than in the experiment case. The three lines indicate, from left to right, an azimuthal drift of the vortex cluster at the rate of half a turn in  $(15\pm 2) T_0$,
 $(22\pm 2) T_0$ and
 $(28 \pm 2)T_0$. The rate of the azimuthal drift thus decreases with time.

An important remark should be made regarding the slow background azimuthal current observed in the horizontal plane at mid-depth of the set-up. The evolution of this current is shown in figure 17 which represents the time history of the radial distribution of the mean azimuthal velocity component  $\langle {V}_{\theta }\rangle _{\theta ,t}$ (measured in
 $\textrm {cm}\ \textrm {s}^{-1}$). Here,
 $\langle \cdot \rangle _{\theta ,t}$ denotes the azimuthal averaging performed over
 $\theta \in [0,2{\rm \pi} ]$ and the temporal averaging performed in a moving window of width
 $20T_0$. The corresponding non-dimensional quantity is introduced as
 $\overline {{V}_\theta }=\langle {V}_{\theta }\rangle _{\theta ,t} \cdot T_0/(2{\rm \pi} r)$, which physically corresponds to the portion of the full circle passed by the mean azimuthal current during one forcing period. The time history covers the same span of time as figures 15 and 16. Figure 17(b) shows the radial distribution of mean non-dimensional azimuthal velocity corresponding to
 $t=100 T_0$ in the numerical simulations performed at different values of the forcing amplitude
 $a=0.2;1.0;2.0;2.4$ mm. This time
 $t=100 T_0$ corresponds to the patterns shown in figure 13. The profiles displayed in figure 17(b) show that the mean azimuthal ‘wind’ in the system considerably increases with the forcing amplitude. This effect is quantitatively investigated in figure 17(c), showing that the maximum of
 $|\overline {{V}_\theta }|$ increases proportionally to the square of the forcing amplitude
 $a$, a result consistent with other studies (see, e.g. the recent work of Cebron et al. Reference Cebron, Vidal, Schaeffer, Borderies and Sauret2021). No relevant scaling could be found, however, for the radial location of these maxima. There exists a significant literature on the effect of the mean current on TRI in 2-D problems, where the wave vectors and the mean velocity vector belong to the same vertical plane (see e.g. Richet, Muller & Chomaz Reference Richet, Muller and Chomaz2017; Fan & Akylas Reference Fan and Akylas2019). In our case the mean azimuthal flow is perpendicular to the primary wave motion which occurs in a vertical (meridional) plane. We conjecture that a sufficiently strong mean azimuthal flow has an important effect on the radial extent of the observed azimuthal wave modes depending on the prograde/retrograde sense of motion of the flow and the waves.
(a) Spatio-temporal diagram representing the numerically computed time history of the radial distribution of mean non-dimensional azimuthal velocity component  $\overline {{V}_\theta }=\langle \text {V}_{\theta }\rangle _{\theta ,t} \cdot T_0/(2{\rm \pi} r)$. Positive/negative values correspond to prograde/retrograde current. Black dots show the mean radial position of the centres of vortices in the vortex cluster. (b) Radial distribution of mean azimuthal velocity corresponding to fixed moment of time
 $t=100 T_0$ in numerical simulations performed at different values of the forcing amplitude
 $a$. The ‘slow manifold’ patterns shown in figure 13 and in supplementary material correspond to
 $t=100 T_0$. These patterns are slowly rotating while interacting with the mean azimuthal current. In (b), for
 $a=2.4$ mm we present also the radial profile of the azimuthal current taken at
 $t=310T_0$ (purple dashed line): note the presence of the prograde current corresponding to the yellow ‘tongue’ in the left panel (a). The measurement times
 $t=100 T_0$ and
 $t=310 T_0$ are indicated by white dashed lines in the left panel. In both panels, a grey rectangle is added to represent the fluid domain at rest contained in the inner cylinder. (c) Scaling of the maximum of
 $|\overline {{V}_\theta }|$ with the square of the forcing amplitude,
 $a^2$.

In figure 17(a), we superimpose the evolution of the mean position of the vortex centres (marked by black dots) on the spatio-temporal diagram of the mean azimuthal flow. It can be seen that vortices are initially close to the surface of the inner cylinder as shown in figure 13 for the case  $a=2.4$ mm. At
 $t$ around
 $150T_0$ a narrow zone of prograde current starts to develop near the inner cylinder (visually it corresponds to the yellow ‘tongue’ seen in figure 17(a), see also the dashed profile in (b,c)). Owing to interactions with this current, the vortex centres gradually move away from the inner cylinder while sitting at the radial coordinate roughly corresponding to the border between the prograde and retrograde currents. When the mean radial position of the vortex centres increases, the
 $7$-vortex cluster evolves toward the
 $8$-vortex configuration.
Let us note that the data presented in figures 16 and 17 permit us to quantify that the prograde propagation speed of the vortex cluster, varying from 1/30 to 1/56 cycle per period  $T_0$, is approximately equal to or smaller than the prograde average flow speed observed in the narrow yellow ‘tongue’ (see figure 17a) toward the end of the simulation. This observation carries the suggestion that the components of the vortex cluster can be identified as topographic Rossby waves propagating in the retrograde direction with respect to the current (while in prograde direction with respect to the rigid boundaries of the rotating set-up).
In the experimental part of the paper (§ 3) we have demonstrated that the cyclonic/anti-cyclonic asymmetry can be conveniently illustrated by the PDFs of the vertical vorticity components. Indeed, the vertical vorticity PDF provides a diagnostic from which the importance of redistributing processes can be obtained; its width (variance) tells how much vorticity is present in vortices and in inertial and topographic Rossby waves relative to the background (‘planetary’) vorticity, its skewness testifies about the dominance of concentrated strong cyclonic vorticity (in cyclones) relative to a more widespread background of weak anticyclonic vorticity. As seen in figure 6, in the experiment, the key contribution to the asymmetry is due to the low-frequency component of the vorticity field filtered with the help of the low-pass filter. In figure 18 we show the PDFs calculated for the numerically simulated vertical vorticity field. Note that the PDFs of the experimentally measured vertical vorticity component at  $a=2.5$ mm (black line) are fully consistent with the PDFs obtained for the numerically simulated vertical vorticity component obtained for
 $a=2.5$ mm (green line) and
 $a=2.4$ mm (purple line). Interestingly, the widest PDFs are obtained in numerical simulations performed at
 $a=2.0$ mm, which is consistent with the snapshots shown in figures 7 and 13 (note that a larger range of the colour bar is used in these figures precisely for this amplitude).
The PDFs of the vertical vorticity components calculated for the time instant of approximately  $t=100T_0$ at different values of the oscillation amplitude: (a) corresponds to the raw signal, and (b) corresponds to the signal filtered via the low-pass filter. The PDF for the experimental data obtained at
 $a=2.5$ mm is shown in light blue. The PDFs for the numerical data obtained at
 $a=2.5$ mm (green) and
 $a=2.4$ mm (purple) are fully consistent with the experimental result (drawn in black).

The result of the DNS is satisfying in the sense that the experimental pattern is successfully reproduced. It means that formation of a PVC in the geometric set-up under consideration is a robust phenomenon. Moreover, the numerically observed merging of low-frequency wave components into a regular pattern of cyclonic vortices seems to be a plausible physical scenario for the formation of a slow manifold.
Many important issues remain unclear. In particular, it is not clear why the time scale of transient evolution of the flow toward a regular vortex cluster in the numerical simulations appears to be significantly longer than in the experiments. This is evident from the comparison of figure 16, where we show the temporal evolution of the instantaneous radial velocity as function of the azimuthal angle, with its experimental counterpart, figure 5. The formation of the  $7$-vortex cluster in numerical calculations takes approximately
 $100 T_0$, approximately twice the time needed for formation of the experimental 8-vortex cluster. The
 $8$-vortex cluster in simulations appears after approximately
 $300 T_0$. This also raises a question: do we observe a fully saturated regime in the physical experiment and in the numerical simulations? Also note that the rate of slow cyclonic drift of the vortex cluster around the inner cylinder in numerical calculations is approximately
 $6$ to
 $3$ times higher than in experiment. Considering numerical calculations, we also notice that the rate of cyclonic drift systematically decreases with time, and the precession rate of the
 $8$-vortex cluster is significantly lower (by approximately 20 %) as compared with that of the
 $7$-vortex cluster. This decrease may be attributed to slow evolution of the mean radial position of vortices sitting at the border between the prograde and retrograde currents as illustrated in figure 17.
In the description of the numerical set-up (see § 4.1) we have mentioned that the boundary condition (imposing a prescribed vertical velocity component at the fixed horizontal upper lid of the fluid domain) is not fully identical to the experimental situation with the deformable upper lid. This issue requires further investigation.
5. Conclusions
The investigation of inertial wave attractors in rotating fluids offers a number of possibilities concerning the geometric set-up of the problem. A number of experimental studies (Maas Reference Maas2001; Manders & Maas Reference Manders and Maas2003, Reference Manders and Maas2004; Brunet, Dauxois & Cortet Reference Brunet, Dauxois and Cortet2019) consider a rectangular box with one sloping wall placed at a rotating table which is similar to the geometry used to reveal the linear (Maas et al. Reference Maas, Benielli, Sommeria and Lam1997) and nonlinear (Scolan et al. Reference Scolan, Ermanyuk and Dauxois2013; Brouzet et al. Reference Brouzet, Ermanyuk, Joubaud, Sibgatullin and Dauxois2016a, Reference Brouzet, Ermanyuk, Joubaud, Pillet and Dauxois2017a; Davis et al. Reference Davis, Jamin, Deleuze, Joubaud and Dauxois2020) dynamics of internal wave attractors in stratified fluids. It has been realised that the inherent three-dimensionality of inertial waves is responsible for considerable secondary currents (Maas Reference Maas2001; Manders & Maas Reference Manders and Maas2004) and for a number of notable changes in the scenario of TRI (Maurer, Joubaud & Odier Reference Maurer, Joubaud and Odier2016; Brunet et al. Reference Brunet, Dauxois and Cortet2019). In contrast, there is a rich theoretical literature which considers linear viscous regimes of inertial wave attractors in spherical liquid shells, where the flow is studied in the meridional cross-section only while the structure of the flow in the equatorial cross-section is supposed to be trivial (Rieutord & Valdettaro Reference Rieutord and Valdettaro1997; Rieutord et al. Reference Rieutord, Georgeot and Valdettaro2001; Rieutord & Valdettaro Reference Rieutord and Valdettaro2010).
In the present paper, we consider numerically and experimentally the geometric set-up which builds a bridge between the two above statements: the experiments are carried out in a (horizontal) annular and (vertical) trapezoidal domain which admits the existence of inertial wave attractor structures in meridional planes while leaving the freedom for the formation of a slow 2-D manifold which drains energy from the genuinely 3-D inertial wave field as result of an energy transfer. The experimental system is subject to axisymmetric forcing, and experiments are performed at low values of the global Rossby ( $Ro$ is of order
 $10^{-3}$) and Ekman numbers (
 $E$ is of order
 $10^{-5}$). The main finding of the experimental part of the present study is the formation of a slow 2-D manifold in the saturated regime in the equatorial plane, which co-exists with an inertial wave attractor in the meridional plane. The 2-D manifold is represented by an ensemble of eight cyclonic vortices in a regular polygonal arrangement. The vortex cluster undergoes a slow cyclonic motion around the axis of rotation of the experimental system.
In the numerical part of the paper we reproduce the experimental set-up and perform a series of simulations for a set of forcing amplitudes in order to obtain the experimental reference result. We observe a sequence of regimes: (i) linear regime with axisymmetric inertial wave attractor, (ii) onset of TRI, (iii) wave turbulence, (iv) formation of the slow manifold in the form of a regular polygonal vortex cluster and (v) the slow cyclonic drift of the cluster. The triadic resonance instability is observed both in the vertical plane (where it appears to be compatible with the existing knowledge) and in the horizontal plane where the secondary waves form the patterns possessing discrete azimuthal symmetry, with the secondary waves propagating cyclonically/anti-cyclonically. The concept of wave turbulence appears to provide a useful general framework for interpretation of the observed phenomena. However, there is an interesting specific feature: the motion observed in the meridional vertical planes seems to correspond to classic wave turbulence, evolving from ‘discrete’ to ‘continuous’ form, while the motion seen in the horizontal (equatorial) planes shows a strong trend toward development of discrete clearly defined azimuthal modes. An important issue for further investigation is the possible cross-interaction between prograde/retrograde azimuthal modes and prograde/retrograde mean azimuthal currents in the case of strong forcing when the currents are appreciable. It is noteworthy that the probability density functions of vertical vorticity calculated for experimental and numerical data are fully consistent, showing significant cyclonic/anti-cyclonic asymmetry.
Special attention has been paid to the development and long-term behaviour of the vortex cluster, which was analysed with the help of low-pass and, where appropriate, narrow-band filters. The results of the analysis support the idea that the vortex cluster emerges as the result of summation and/or merging of wave-like vorticity components in the presence of a mean current. We can speculate that the observed phenomena may be related to topographic Rossby waves. Indeed, the presence of propagating vortices in a typical topographic  $\beta$ set-up warrants a discussion in terms of topographic Rossby waves. The issue is a bit delicate for two reasons. On the one hand, for the conical shape of the bottom that we used (decreasing in depth inwards), the topographic Rossby waves are expected to propagate in retrograde direction (against the rotation sense of the tank), counter to what was actually observed in the laboratory experiment as well as in matching numerical experiments. As in the classical case studied originally by Rossby in the Earth's atmosphere, these waves may still propagate in prograde direction when advected by a strong background flow (Rossby Reference Rossby1939). The numerical computations that support the laboratory experiments indeed show that at the radius where the vortices sit, a strong prograde mean flow has formed. On the other hand, the mean flow is not necessarily formed by the mixing of angular momentum due to breaking of focused and amplified inertial waves, but could also be generated by nonlinear interactions of periodic flows within a viscous boundary layer (see, e.g. the works of Busse Reference Busse2010; Sauret et al. Reference Sauret, Cébron, Le Bars and Le Dizès2012). In our study, it is important to highlight that this mean flow itself has a complex radial structure that contains strong retrograde as well as eventually strong prograde parts. We believe this aspect, the precise generation and evolution of the radial mean flow structure by focused inertial waves, to be sufficiently complex to require further investigation. In numerical simulations (not reported in this paper) we have also made a limited preliminary study on robustness of the observed effects by considering a conical bottom with a smaller slope (
 $30^{\circ }$ instead of
 $45^{\circ }$). The calculations have demonstrated that a PVC also arises at comparable input forcing. Additionally, the form of forcing has been changed from the cubic profile shown in figure 2 to a linear profile (under the condition that the forcing should be volume conserving). Again, the computations have demonstrated the emergence of a vortex cluster, and we can therefore conclude that the observed phenomenon is indeed robust.
Although the experimental reference regime is numerically reproduced, and the role of the forcing amplitude is clarified, the present study raises a number of interesting general issues, in particular, (i) how the vortex cluster regime evolves when the key parameters of the problem (Rossby and Ekman numbers, geometric aspect ratio and the particular type of forcing) are varied in a broad range, and (ii) whether or not the observed regime might be relevant to realistic geo- and astrophysical systems.
Cyclonic clusters arranged in the form of regular polygons have been reported for the polar regions of large planets, e.g. Jupiter (Adriani et al. Reference Adriani2018), demonstrating remarkably persistent long-term behaviour (Adriani et al. Reference Adriani2020). This phenomenon has a different physical origin as compared with our experiments. It has been argued that the pattern is captured by shallow-water models, e.g. Cho & Polvani (Reference Cho and Polvani1996), Scott & Polvani (Reference Scott and Polvani2007). However, the key puzzle of vortex clusters remains (Adriani et al. Reference Adriani2018): ‘The manner in which the cyclones persist without merging and the process by which they evolve to their current configuration are unknown’. Recently, Reinaud (Reference Reinaud2019) has shown numerically that a system of  $m$ quasi-geostrophic vortices equally distributed over a ring whose centre is already occupied by a vortex can be stable under certain conditions. In our experiment, the inner cylinder may play a similar role to this central vortex. Hence, the ‘toy system’ proposed here may help to shed light on the stability of PVCs and their possible existence not only in a shallow ‘atmosphere’, but also in liquid interiors of rotating natural systems geometrically compatible with the existence of inertial wave attractors.
Supplementary movie
Supplementary movie is available at https://doi.org/10.1017/jfm.2021.703.
Acknowledgements
The DNS were performed at the Lomonosov Supercomputer Center. The authors deeply thank the anonymous reviewers whose constructive comments greatly helped to improve the overall quality of this manuscript and the scope of our study.
Funding
This work was supported by the grant ANR-17-CE30-0003 (DisET) and by the LABEX iMUST (ANR-10-LABX-0064) of Université de Lyon, within the program ‘Investissements d'Avenir’ (ANR-11-IDEX-0007), operated by the French National Research Agency (ANR). This work was also supported by a grant from the Simons Foundation (651475, TD). It has been achieved thanks to the resources of PSMN from ENS de Lyon. E.E. gratefully acknowledges his appointment as a visiting scientist at ENS de Lyon during the experimental campaign. E.E. and N.S. acknowledge support from the Russian Science Foundation (Project 20-11-20189) during work on the manuscript and complementary data processing.
Declaration of interests
The authors report no conflict of interest.



