1. Introduction
The use of estar with adjectives to highlight specific contextual meanings has emerged as a challenge to the study of the SLA of Spanish copula choice (Geeslin Reference Geeslin2005; Woolsey Reference Woolsey, Klee and Face2006a, Reference Woolseyb). This challenge is due in part to the recognition that the majority of adjectives may be used appropriately with both ser and estar (Vañó-Cerdá, Reference Vañó-Cerdá1982; Fernández Leborans, Reference Hanssen1999), and in part to the centrality of speaker intent in Spanish copula choice (Falk, Reference Falk1979a; Clements, Reference Clements1988). More precisely, when studying L2 learners of Spanish, it is difficult to ascertain with confidence that the contextual meaning highlighted by the copula corresponds with the meaning intended by the learner. For example, el chico es alto and el chico está alto “the boy is tall” are both appropriate uses of ser and estar, and they encode different meanings; these meanings, however, may or may not be intended by the learner.
The current study addresses the challenge of investigating the SLA of estar with adjectives when highlighting two specific contextual meanings: comparisons within an individual frame of reference (Falk, Reference Falk1979a, Reference Falkb; Silva-Corvalán, Reference Silva-Corvalán1986, Reference Silva-Corvalán1994; Clements, Reference Clements1988) and speaker reactions as a result of immediate experience with the referent (Andrade, Reference Andrade1919; Parker, Reference Parker1927; Aid, Reference Aid and Rameh1976; Guitart, Reference Guitart2002). Estar is examined within these contexts using a picture-description task and a contextualized preference task specifically designed to create clear and unambiguous contexts of comparison and reaction. One hundred and eleven English-speaking Spanish students at four different levels of proficiency participated in the research. Findings from the study are examined in relation to recent predictive models (Geeslin, Reference Geeslin, Leow and Sanz2000, Reference Geeslin2003, Reference Geeslin2005) as well as future directions for the study of the SLA of Spanish copula choice.
2. Background
2.1 Theoretical conceptualizations of the Spanish copula
The Spanish copula has been examined from many different theoretical perspectives. Early Spanish grammars establish traditional dichotomies that attempt to explain the difference between ser and estar in terms of two binary and opposing variables (see, for example, Hanssen, Reference Hanssen1913; Morley, Reference Morley1925; Ramsey and Spaulding, Reference Ramsey and Spaulding1956; Gili y Gaya, Reference Gili y Gaya1961; Stockwell, Bowen and Martin, Reference Stockwell, Bowen and Martin1965; Solé and Solé, Reference Solé and Solé1977). Others have sought an explanation through extensive categorization of adjectives that accept ser, estar or both (see Navas Ruiz, Reference Navas Ruiz1963; Vañó-Cerdá, Reference Vañó-Cerdá1982). Syntactic explanations include notions of perfectivity (Luján, Reference Luján1980, Reference Luján1981), resultant states (Cirot, Reference Cirot1931; Bosque, Reference Bosque and Bosque1990; Schmitt, Reference Schmitt1992) and predicate type (Leonetti, Reference Leonetti1994; Fernández Leborans, Reference Fernández Leborans1995). Semantic/pragmatic theories have been proposed to account for contextual factors, such as speaker intent and the referent–attribute relationship (Bull, Reference Bull1942, Reference Bull1965; De Mello, Reference De Mello1979; Falk Reference Falk1979a, Reference Falkb; Franco and Steinmetz, Reference Franco and Steinmetz1983, Reference Franco and Steinmetz1986; Clements, Reference Clements1988). Still others associate estar with reactions resulting from direct and immediate experience with the referent (Andrade, Reference Andrade1919; Parker, Reference Parker1927; Aid Reference Aid1973, Reference Aid and Rameh1976; Guitart, Reference Guitart2002).
All of these theoretical approaches offer effective ways to examine the difference between ser and estar, yet none of them can account for every use of the Spanish copula (Geeslin, Reference Geeslin, Leow and Sanz2000, Reference Geeslin2005; Woolsey, Reference Woolsey2006b). As a result, SLA studies have begun to include aspects from a variety of theoretical frameworks to examine the SLA of Spanish copula choice through a multi-variable analysis of use (Geeslin, Reference Geeslin, Leow and Sanz2000, Reference Geeslin2005). This methodology will be discussed in the review of SLA studies below (see section 2.2). First, however, two specific aspects of semantic/pragmatic conceptualizations which are particularly relevant to the current study will be explained: comparisons within an individual frame of reference, and reactions as a result of immediate experience with the referent.
Comparisons within an individual frame of reference
Within semantic/pragmatic conceptualizations of the Spanish copula, the notions of change, norms and comparisons emerge and evolve as the main semantic interpretations of estar. Bull's (Reference Bull1942) “principle of change” contrasts norm with change-from-norm, arguing that estar is used to express a change in attribute from what is normal for the referent. Bolinger (Reference Bolinger1947) suggests that a more precise interpretation would be norm versus non-norm. Falk's (Reference Falk1979a) “norm theory” refines Bull's principle to include norms for both ser and estar. Falk proposes that estar is used when the referent is compared to an individual norm, i.e. to itself, while ser is used to compare the referent with a general norm, to the “average” norm for the attribute. Franco and Steinmetz (Reference Franco and Steinmetz1983, Reference Franco and Steinmetz1986) rephrase Falk's theory in terms of X/X and X/Y comparisons, and defend the use of estar in first encounters with a referent, arguing that comparisons of X/X type are possible in terms of anticipated/expected versus real/encountered.
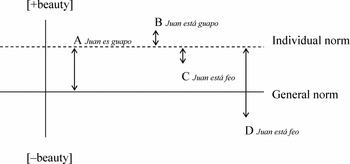
Falk (Reference Falk1979b) exemplifies his “norm theory” by discussing beauty adjectives such as guapo “handsome” and feo “ugly”. To say that Juan es guapo is to differentiate Juan from other men, effectively comparing Juan to a general norm of “handsomeness” for men and classifying him as “handsome”, above the general norm. To say that Juan está guapo is to compare Juan with his own individual norm of “handsomeness” and classify him as being above that norm. A visual representation of these statements can be seen in the Figure 1 (adapted from Falk (Reference Falk1979b, p. 283)): Juan es guapo would be represented by A, and Juan está guapo by B. The statement Juan está feo could be represented by either C or D, noting Juan's “ugliness” in relation to his individual norm of “handsomeness”. The observation that this statement can represent “ugliness” either above or below the group norm of “handsomeness” reflects Falk's belief that ser and estar represent two separate semantic domains. By stating B, C, or D, the speaker makes no reference to where Juan falls in relation to the group norm, but simply places the attribute in relation to Juan's individual norm (Falk Reference Falk1979a, p. 95). Additionally, the statement Juan es feo is never appropriate, given the location of Juan's individual norm of “handsomeness” in relation to the general norm.
General-norm-reference versus individual-norm-reference.

Reactions resulting from immediate experience with the referent
Throughout theoretical descriptions of the Spanish copula, the stylistic use of estar emerges as problematic for most conceptualizations, be they based on traditional dichotomies, adjective type, syntax or semantics/pragmatics. Among Morley's (Reference Morley1925) dichotomies, for instance, sensory perception versus mental concept becomes a “possible” fourth distinction between ser and estar. Additionally, Morley recognizes the use of estar to express irony with predicate nouns (p. 455). Gili y Gaya's (Reference Gili y Gaya1961) grammar links estar to a direct/sensorial experience with the referent. Navas Ruiz's (Reference Navas Ruiz1963) adjective categorization praises Parker's (Reference Parker1927) recognition of the stylistic potential for estar (see below). Leonetti (Reference Leonetti1994) admits that an utterance such as las naranjas están buenas “the oranges are good” poses a challenge to an explanation based on predicate type alone (p. 204). And most semantic/pragmatic studies acknowledge either an affective or stylistic use of estar. For example, Falk (Reference Falk1979b, p. 288) recognizes an affective function that falls outside of norm theory. Clements (Reference Clements1988, p. 806) admits that the speaker can override the restrictions set forth in his predictive model for stylistic reasons. Moellering (Reference Moellering1944, p. 603) relates estar to “a judgment in response to an experienced event” and Crespo (Reference Crespo1946, Reference Crespo1949) recognizes the use of estar to express novelty, unusualness or unexpectedness of the attribute in relation to the referent. In general, these stylistic uses of estar cannot be accounted for in the proposed theoretical models because they depend exclusively on the speaker's intention to impose estar in an unexpected way in order to highlight a particular meaning within the context. Thus, estar can be used to express irony, feelings, sensory perceptions, reactions, emphasis, and more – functions that are not easily explained through descriptive approaches, adjective types, syntax, or semantics/pragmatics.
A few studies specifically highlight the use of estar with immediate experiences with the referent. Andrade (Reference Andrade1919) explicitly links estar to immediate perceptions of the referent. Parker (Reference Parker1927) describes estar as “ser plus”, full of stylistic potential and able to communicate subjective feelings, reactions, impressions, comparisons, and more. Guitart (Reference Guitart2002) associates estar with unusualness, capturing a snapshot of the referent at a particular time and place. Both Aid (Reference Aid1973, Reference Aid and Rameh1976) and Tobón de Castro (Reference Tobón de Castro1979) explain estar in terms of semantics, but highlight a “comment transformation” that uses estar to express surprise or displeasure resulting from a direct encounter with the referent.
As will be seen in the section below, both comparisons within an individual frame of reference and reactions resulting from immediate experience with the referent become challenges to the study of the SLA of Spanish copula choice. These specific contextual variables, and their effect on learner use of estar, are the principle focus of the current study.
2.2 Studies in the SLA of Spanish copula choice
Early studies in SLA and stages of acquisition
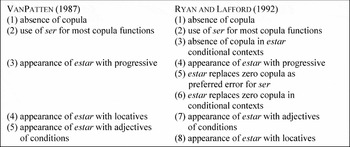
VanPatten (Reference VanPatten1985, Reference VanPatten, VanPatten, Dvorak and Lee1987) is usually cited as the first to formulate stages of acquisition for ser and estar in classroom settings. Ryan and Lafford (Reference Ryan and Lafford1992) generally confirm these stages, though they expand the sequence and challenge the order of acquiring “estar + locatives” and “estar + adjectives of condition” (see Figure 2). Studies subsequent to VanPatten's also confirm his stages of acquisition, among a variety of types of learners – study-abroad students (DeKeyser, Reference DeKeyser1990; Ryan and Lafford, Reference Ryan and Lafford1992), Peace Corps volunteers (Guntermann, Reference Guntermann1992), adult classroom learners (DeKeyser, Reference DeKeyser1990; Finneman, Reference Finneman1990; Briscoe, Reference Briscoe1995) – and using a variety of types of tasks – oral interview (DeKeyser, Reference DeKeyser1990; Finneman, Reference Finneman1990; Ryan and Lafford, Reference Ryan and Lafford1992; Briscoe, Reference Briscoe1995), picture-description (DeKeyser Reference DeKeyser1990; Finneman, Reference Finneman1990; Briscoe Reference Briscoe1995), grammar test (DeKeyser, Reference DeKeyser1990), grammaticality judgment task (Betts, Reference Betts1984) and compositions (Ramírez-Gelpi, Reference Ramírez-Gelpí1995).
Stages of acquisition of ser and estar.

The principle limitation in early studies on the acquisition of the Spanish copula is the binary categorization used to assess “copula + adjective” contexts according to the traditional dichotomy characteristic/condition. The general assumption is that ser is required with characteristics and estar is required with conditions. However, a binary categorization of adjectives into ser-required and estar-required adjective types is limiting due to the general recognition that most adjectives can be used appropriately with both ser and estar. Vañó-Cerdá (Reference Vañó-Cerdá1982, p. 17) suggests that approximately 80% of all adjectives can be used with both ser and estar. Fernández Leborans (Reference Fernández Leborans, Bosque and Demonte1999, p. 2429) writes “la mayor parte de los adjetivos pueden aparecer en construcción con los dos verbos” [the majority of adjectives can appear in constructions with both verbs]. Likewise, Porroche Ballesteros (Reference Porroche Ballesteros1988, p. 40) comments: “la mayor parte de los adjetivos pueden combinarse con los dos verbos” [the majority of adjectives may be combined with both verbs]. Other studies have also stated explicitly that most adjectives can be used with either copula, including Bull (Reference Bull1942), Solé and Solé (Reference Solé and Solé1977), Ruggeri Marchetti (Reference Ruggeri Marchetti1977) and Falk (Reference Falk1979a).
Move away from accuracy to describe “bundle of features”
As a result of the recognition that most adjectives may be used appropriately with both ser and estar, more recent studies in the SLA of copula choice have moved away from assessing accuracy to describing the “bundle of features” (Clements, Reference Clements1988) that describes copula choice. Drawing on work in theoretical linguistics (Falk, Reference Falk1979a, Reference Falkb; Luján, Reference Luján1981; Clements, Reference Clements1988) and sociolinguistics (Silva-Corvalán, Reference Silva-Corvalán1986, Reference Silva-Corvalán1994; Thompson, Reference Thompson1991; Gutiérrez, Reference Gutiérrez1992, Reference Gutiérrez1994; De Jonge, Reference De Jonge, Drijkoningen and Hengeveld1993; Sanz and González, Reference Sanz and González1995), Geeslin (Reference Geeslin, Leow and Sanz2000, Reference Geeslin2005) applies a multi-variable analysis of use to the SLA of copula choice. Geeslin (Reference Geeslin1999, Reference Geeslin, Leow and Sanz2000) uses oral interviews, picture-description and a contextualized preference task to elicit 4301 tokens of “copula + adjective” from 77 learners at four levels of instruction. Each instance of ser and estar is coded for a number of different variables, including features of the referent (animacy), features of the adjective (adjective type, directionality, dynamicity, telicity) and features of the context (frame of reference, dependence on experience and susceptibility to change). Findings reveal that all variables are significant predictors at least at one level of instruction, confirming the importance of a multi-variable approach. Subsequent studies demonstrate the variability of ser and estar with adjectives among native speakers (Geeslin, Reference Geeslin2001) and the utility of the multi-variable analysis of use to explore the difference in copula choice even between native speakers and advanced non-native speakers (Geeslin, Reference Geeslin2003).
Ongoing challenge: Determining speaker intent within pragmatic contexts
Despite the success of the multi-variable analysis of use in examining the SLA of Spanish copula choice, one ongoing challenge to the study of learner use of ser and estar with adjectives is how to determine speaker intent in pragmatic contexts. Most theoretical descriptions of the Spanish copula recognize the importance of speaker intent in copula choice, regardless of specific theoretical framework. Speaker intent is alluded to in descriptive grammars (Morley, Reference Morley1925; Gili y Gaya, Reference Gili y Gaya1961; Solé and Solé, Reference Solé and Solé1977) and recognized in adjective type analyses (Navas Ruiz, Reference Navas Ruiz1963; Vañó-Cerdá, Reference Vañó-Cerdá1982). Predicate type explanations of the Spanish copula empower the speaker with the ability to reinterpret predicate type (Leonetti, Reference Leonetti1994) or impose a reached state according to a subjective conceptualization (Fernández Leborans, Reference Fernández Leborans1995). Semantic/pragmatic approaches explicitly incorporate speaker intent into copula theory (Bull, Reference Bull1942; Bolinger, Reference Bolinger1944; Falk, Reference Falk1979a; Franco and Steinmetz, Reference Franco and Steinmetz1983; Clements, Reference Clements1988). Even instructional approaches include speaker intent in pedagogical considerations (Spurr, Reference Spurr1945; Ruggeri Marchetti, Reference Ruggeri Marchetti1977; Porroche Ballesteros, Reference Porroche Ballesteros1988). Interestingly, speaker intent has often been interpreted according to native speaker intuitions (Crespo, Reference Crespo1946; Roldán, Reference Roldán1974a, Reference Roldánb; Franco and Steinmetz, Reference Franco and Steinmetz1983, Reference Franco and Steinmetz1986), even though it is recognized that interpreting native speaker intent in the use of ser and estar is not always easy (Moellering, Reference Moellering1943; Bolinger, Reference Bolinger1947). However, determining speaker intent in contexts of second language acquisition is even more problematic given that what is encoded in copula choice may not accurately reflect the speaker's intended meaning in a given context. Thus, when a learner utters el chico está gordo “the boy is fat”, it is difficult to ascertain whether the use of estar and the contextual meaning it highlights corresponds with the meaning intended by the learner. Therefore, contemporary research in the SLA of ser and estar must take into account both the presence of speaker intent as a determining factor in copula choice and the problem of interpreting speaker intent during the acquisition process.
The challenge of determining speaker intent relates specifically to the interpretation of copula choice within pragmatic contexts, such as contexts of comparisons within an individual frame of reference and contexts of reaction to an immediate experience with the referent. What has been limiting in previous research is that instrument design has neither specifically targeted pragmatic contexts nor accounted for speaker intent (see Woolsey, Reference Woolsey, Klee and Face2006a). Thus, Geeslin (Reference Geeslin1999, Reference Geeslin, Leow and Sanz2000) codes for the possible presence of pragmatic variables such as frame of reference and immediate experience, but does not intentionally create these pragmatic contexts in the research design. Similar challenges are present in sociolinguistic research by Silva-Corvalán (Reference Silva-Corvalán1986, Reference Silva-Corvalán1994), in that pragmatic uses of the copula are interpreted more narrowly than what the theory would allow.Footnote 1 Contemporary studies in the SLA of copula choice need to find ways to control for contextual variables and account for speaker intent in order to more confidently interpret pragmatic uses of estar when they occur in second language learner data.
2.3 Current study: Research questions
The current study examines the development of “estar + adjective” in two specific pragmatic contexts: comparisons within an individual frame of reference and reactions resulting from immediate experience with the referent. Additionally, the instrumentation designed for the current study addresses the challenge of determining speaker intent by creating clear pragmatic contexts and finding ways to confirm speaker intent. The following research questions guide the present investigation.
1. Does “individual frame of reference” predict the use of estar with adjectives? Specifically, do comparisons within an individual frame of reference, that is of the referent with itself, elicit the use of estar with adjectives more frequently than contexts lacking these types of comparisons?
2. Does “immediate experience” predict the use of estar with adjectives? Specifically, do visual and immediate experiences with the referent elicit the use of estar with adjectives more frequently than contexts where no immediate experience is present?
3. Methodology
3.1 Research design
As discussed above, previous studies examining the SLA of Spanish copula choice do not specifically target pragmatic contexts through research design. As a result, speaker intent cannot be confidently determined, making it difficult to interpret copula choice among second language learners. Even an analysis of the broader discourse leaves the majority of tokens unanalyzed due to limited discourse among learners and the fact that most adjectives may be used appropriately with both ser and estar (see Geeslin and Woolsey, Reference Geeslin and Woolsey2004).
At the same time, however, earlier studies make use of research instruments which prove successful in eliciting a variety of adjectives and which hold potential for controlling pragmatic contexts in production data. For instance, a picture description task is especially effective in eliciting specific types of adjectives with ser and estar, enabling research to focus on particular adjective types (Briscoe, Reference Briscoe1995; Cheng, Reference Cheng2002). Thompson's (Reference Thompson1991) contextualized grammaticality judgment task proves an effective methodology to control for contextual variables and limit preferences to specific choices. Geeslin (Reference Geeslin, Leow and Sanz2000) bases her own research instruments on those of Briscoe (Reference Briscoe1995) and Thompson (Reference Thompson1991). The current study makes use of a contextualized preference task adapted from Geeslin (Reference Geeslin1999, Reference Geeslin, Leow and Sanz2000), and a picture description task designed to capitalize on the potential this type of instrument holds for eliciting specific adjectives and creating clear pragmatic contexts.
Picture description task: Clear contexts of comparison and immediate experience
The picture description task used in the present study differs from earlier studies in two ways: (i) by the selection of referents, and (ii) by the slide design. The four referents chosen for the task were well-known celebrities Harrison Ford, Britney Spears, Michael Jackson and Madonna. These referents were selected to ensure that both the speaker and the researcher were familiar with the referent, thus controlling for a factor that was not controlled in previous studies. Additionally, familiarity with these celebrities facilitated the creation of pragmatic contexts of “individual frame of reference” and “immediate experience”, in that participants had prior ideas and expectations about the celebrities. Thus, participants would have sufficient knowledge of the referent to establish a comparison within an individual frame of reference. Similarly, preconceived ideas regarding the celebrity would serve as a basis for their reaction to unusual photographs.
The slide design also helped to create clear pragmatic contexts. For instance, comparisons within an individual frame of reference were created through the use of slides explicitly prompting the learner to compare past/present frames of the celebrity (some with photos, some without). Additionally, past/present frames highlighted contrasts in particular characteristics in the referent, such as age, weight or emotion. Similarly, contexts of immediate experience were highlighted by choosing atypical pictures of the referents. Photos such as Harrison Ford in a Speedo bathing suit, for example, are especially successful in eliciting reactions of shock or humor because they present the referent in an unusual or unexpected way. The choice of referents and the slide design, therefore, help create contexts in which specific pragmatic variables are present, namely contexts of “individual frame of reference” and “immediate experience”.
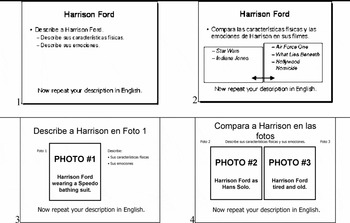
Figure 3 shows the slide sequence for Harrison Ford, which is representative of the sequence for each of the four celebrities. Each slide is coded for the two independent variables “individual frame of reference” and “immediate experience”, creating four different possibilities. The first slide elicits descriptions devoid of comparison and immediate experience ([–comparison][–immediate]); the second, prompts comparison but not immediate experience ([+comparison][–immediate]); the third slide creates a context of immediate experience but not of comparison ([–comparison] [+immediate]); and the final one incorporates both ([+comparison][+immediate]). Thus, the instrument creates an equal and balanced number of contexts of “individual frame of reference” and “immediate experience”.
Harrison Ford sequence in picture description task.

Contextualized preference task: Controlling contexts, limiting options
The contextualized preference task used for the present investigation is modeled after Geeslin (Reference Geeslin1999, Reference Geeslin, Leow and Sanz2000).Footnote 2 Similar to Geeslin's task, the current instrument creates a brief story about two people, Pablo and Luisa. The story retells the events of a date they go on one evening. After every few lines, participants are presented with two sentences to continue the story that are identical except for their use of ser or estar. Participants are asked if they prefer the option with ser, with estar, or both. The context is presented in English, but the sentence immediately preceding the options as well as the options themselves are written in Spanish.
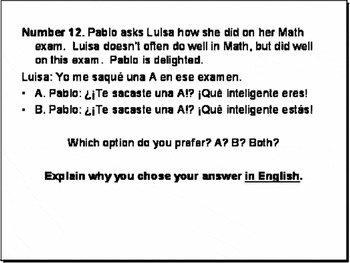
Given the current study's focus on the pragmatic variables “individual frame of reference” and “immediate experience”, the story in the preference task was written to create these contexts. Similar to the picture description task, contexts were created that presented all four combinations of the two pragmatic variables: [–comparison] [–immediate], [–comparison][+immediate], [+comparison] [–immediate], and [+comparison][+immediate]. These combinations were evenly distributed among the 16 items on the preference task. “Individual frame of reference” items were coded as [+comparison] and contained a comparison of the referent with itself at a previous point in time. “Immediate experience” items were coded [+immediate] and included not only a visual and immediate encounter with the referent, but also a speaker reaction that was communicated through both content and the use of exclamation or question marks. Figure 4 provides an example of one item on the contextualized preference task that was coded [+comparison][+immediate].
Item 12 on the contextualized preference task.

3.2 Participants
Participants for the current study were recruited from five Spanish courses at four different levels of instruction at a large Midwestern university: second-semester Spanish, fourth-semester Spanish, third-year Spanish grammar, fourth-year Spanish linguistics, and fourth-year Spanish literature. A total of 111 students participated in the study: 22, 29, 33 and 27 from levels 1 through 4.
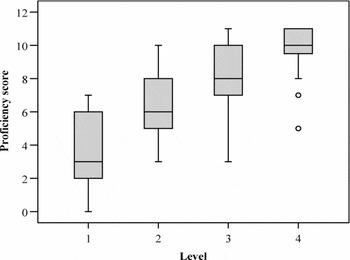
In addition to completing the picture description and contextualized preference tasks, participants took an 11-item multiple choice proficiency test. A one-way ANOVA and post-hoc analyses showed statistically significant differences (at p < .05) between all mean proficiency scores (3.82, 6.41, 8.09 and 9.96 for levels 1 through 4). Thus, the four instructional levels represented by the participants in the current study were found to be at four different levels of Spanish proficiency. As a result, in the present study, the term “level” may refer to both proficiency and instructional levels simultaneously. Figure 5 presents the means and variance for each group.
Proficiency test scores by level.

It should also be noted here that the type and intensity of instruction on ser and estar varied across levels of instruction, though no level received instruction on “copula + adjective” for a period of two weeks prior to the study. Level 1 was exposed to several explicit sidebar notes on estar with adjectives, but these were never the principal focus of a lesson. Level 3 began the semester with a unit on all of the uses of ser and estar (level 3 participated in the study during week eight, seven weeks after instruction). Levels 2 and 4 did not receive explicit instruction in the use of estar with adjectives.
3.3 Coding scheme and statistical analyses
From the data collected, all “copula + adjective” tokens were identified and coded according to dependent and independent variables, which differed slightly between the two research tasks. The dependent variable for the picture description task was response given, including ser, estar, parecer “seem”, mirar “look”, and other. Independent variables included both instrument-controlled factors, such as “individual frame of reference” and “immediate experience”, and speaker-controlled factors such as referent animacy, adjective type and resultant state. The dependent variable for the contextualized preference task was response given, which was limited to ser, estar or both, according to the options made available to the participants. The independent variables were all instrument-controlled, and included “individual frame of reference” and “immediate experience”.
As described earlier, each slide in the picture description task and each item in the preference task were coded for “individual frame of reference” and for “immediate experience”. Every slide and every item were coded [+/–comparison] and [+/–immediate] according to the presence or absence of these two variables (see section 3.1).
Referent animacy refers to whether the referent is a living person or animal, versus an inanimate object. Any reference to the celebrity was coded as [+animate] while descriptions of clothes, hair style, skin color or even facial expressions and emotions were coded [–animate].
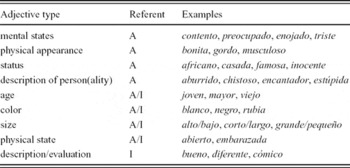
Adjective type was coded according to categories used in Geeslin (Reference Geeslin1999, Reference Geeslin, Leow and Sanz2000). Some categories referred exclusively to animate referents, some to inanimate referents, and some to both. Mental states, physical appearance, status, and description of a person(ality) were used for animate referents, the last category being used as a last resort. Age, color, size, and physical state were used with both animate and inanimate referents, while description/evaluation was used as a catch-all category for inanimate referents only. Table 1 provides examples of adjectives according to their categorization.
Examples of adjective categorization.

A = used with animate referents; I = used with inanimate referents
Finally, resultant state was assigned to those adjectives that derived from accomplishment verbs. Examples of [+resultant] coding include abierto “open”, cansado “tired” and confundido “confused” among others.
The statistical analysis of the data collected in the present investigation follows Geeslin's (Reference Geeslin1999, Reference Geeslin, Leow and Sanz2000, Reference Geeslin2005) multi-variable model of analysis, one that makes use of chi-square (χ2) tests and forward stepwise multiple regression analyses to evaluate the impact of the variables at each level of instruction. The chi-square test reveals the significance of each individual variable in copula choice, while the stepwise multiple regression creates a predictive model that takes into consideration all variables at each level. Following Geeslin's methodology, the dependent variable response given will be collapsed into estar and non-estar, providing a clearer analysis of the acquisitional path of estar. The χ2 tests will be run for “individual frame of reference” and “immediate experience” at every level of instruction, while the regression analyses will incorporate these and other variables, such as adjective type, referent animacy and resultant state, into a predictive model for estar for each level of instruction.
Table 2 provides a summary of the variables and the coding scheme used in the present investigation.
Summary of coding scheme.

4. Results
4.1 Descriptive data
“Copula + adjective” contexts
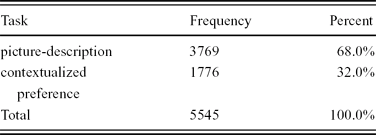
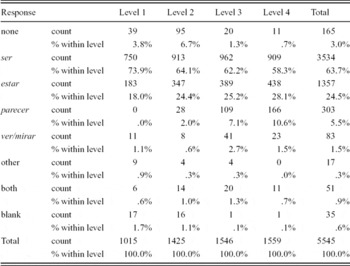
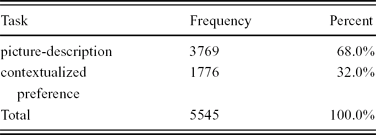
A total of 5545 tokens of “copula + adjective” contexts were collected from all four levels using both the picture-description and contextualized preference tasks. Table 3 summarizes the overall distribution of tokens by task, while Table 4 shows the distribution of response given by level.
Number of “copula + adjective” tokens by task.
Distribution of response given by level.

Table 4 shows that there is a steady decline of the frequency of ser across levels of proficiency, from 73.9% at level 1 to 58.3% at level 4. The inverse is true of both estar and parecer: estar increases from 18% at level 1 to 28.1% at level 4, while parecer increases from no uses at the first level to 10.6% at the fourth level.
Additional variables
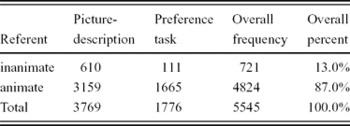
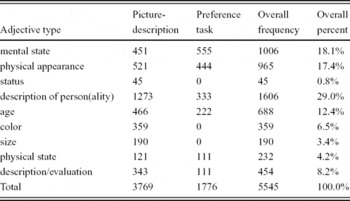
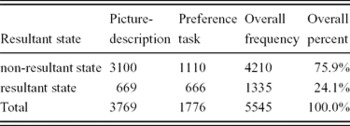
Descriptive statistics of the additional variables that will be included in the regression analyses are presented below. This is done, in part, to make possible observations regarding the kind of data collected, in part to link the current investigation to preceding research, and in part to facilitate discussion of the needs for future studies. Tables 5, 6 and 7 summarize the overall frequencies of referent animacy, adjective type and resultant state, respectively.
Referent animacy frequency.

Adjective type frequency.

Resultant state frequency.

4.2 Individual variable analyses
The following two sections analyze the use of estar according to the two specific pragmatic contexts under investigation: comparisons within an individual frame of reference and immediate experience with the referent. The research questions guiding the current study examine whether estar will appear more frequently in these two contexts.
Estar by comparison within an individual frame of reference
It will be recalled that both instruments were designed to create equal numbers of comparison and non-comparison contexts. In the picture-description task, this was done by having two of the four slides per celebrity explicitly prompt comparisons from the participants. Because there were four celebrities in the task, in total there were eight slides that created explicit contexts of comparison. In the contextualized preference task, there were sixteen total slides, of which eight slides presented contexts in which comparisons within an individual frame of reference occurred. Thus, for the current analysis, the eight comparison slides from each task were grouped to form a [+comparison] group of contexts, which was then compared to the remaining non-comparison slides, i.e. the [–comparison] group. In each group, [+comparison] and [–comparison], there were 16 slides total, 8 from the picture-description task and 8 from the contextualized preference task.
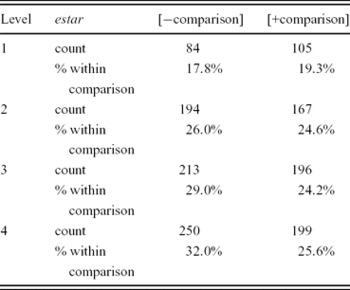
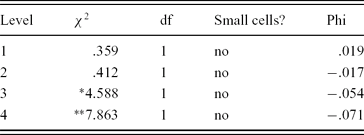
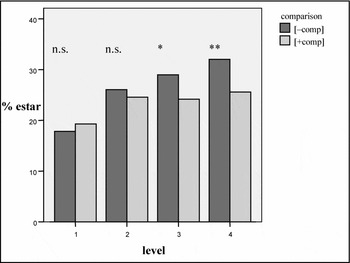
Table 8 presents the distribution of estar by comparison slides by level. A chi-square analysis was then run for each level in order to examine the effect of comparison contexts on the frequency of estar. Results from the analyses are presented in Table 9 and graphed in Figure 6.
Distribution of estar by comparison slides by level.

Chi-square results for estar by comparison slides by level.
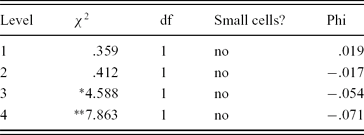
*= p < .05; ** = p < .01; ** = p < .001
Estar by comparison slides by level.

The chi-square analyses confirm that comparison contexts have a significant effect on the frequency of estar at different levels of proficiency. At levels 1 and 2, this effect is not significant, but at levels 3 and 4 learners use estar significantly more frequently in contexts of [–comparison] than in contexts of [+comparison]. It is important to note that the overall significant trend is contrary to what is hypothesized: not only does the frequency of estar increase in non–comparison contexts, but the difference between the frequency of estar in [–comparison] and [+comparison] contexts increases in significance across levels. Table 8 and Figure 6 clearly show that as learner proficiency increases, estar is used more frequently in non-comparison contexts than in comparison contexts.
Estar by immediate experience with the referent
As with contexts of comparison within an individual frame of reference, the research design in the current study creates equal numbers of contexts in which visual, immediate experience with the referent is present and of contexts in which it is absent. In the picture-description, eight of the sixteen slides prompt participants to describe photographs of celebrities Harrison Ford, Britney Spears, Michael Jackson and Madonna. In the contextualized preference task, eight of the sixteen items represent contexts in which an immediate experience with the referent occurs. Thus, for the current analysis, these slides are grouped into a [+immediate] group, while those slides without pictures and items without immediate experiences are grouped as [–immediate]. In both groups, therefore, there are sixteen total slides, eight from the picture-description task and eight from the contextualized preference task.
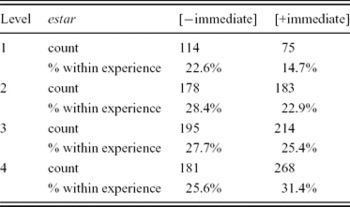
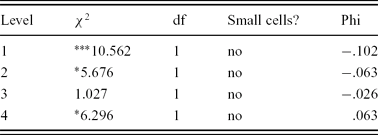
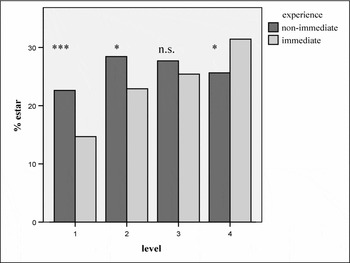
Table 10 presents the distribution of estar by immediate experience by level. A chi-square analysis was run for each level in order to examine the effect that immediate experience has on the use of estar. Results from the analyses are presented in Table 11 and graphed in Figure 7.
Distribution of estar by immediate experience by level.

Chi-square results for estar by immediate experience by level.
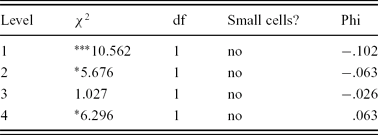
*= p < .05; ** = p < .01; *** = p < .001
Estar by immediate experience by level.

It can be seen that immediate experiences show a developmental pattern across levels of proficiency: levels 1 and 2 show that immediate experience has a significant effect on the use of estar, such that participants more frequently choose estar in [–immediate] contexts. This effect is opposite to what is expected. However, the effect changes across levels, reaching non-significance at level 3 and significance in the opposite – and hypothesized – direction at level 4. Thus, at level 4, [+immediate] contexts elicit estar significantly more frequently than [–immediate] contexts.
4.3 Multiple regression analyses
Thus far, the two independent variables “individual frame of reference” and “immediate experience” have been examined separately from other variables or each other. It has been found that contexts of comparison within an individual frame of reference behave opposite to what is expected: estar is used more frequently in non-comparison contexts at higher levels of proficiency. On the other hand, visual, immediate experiences with the referent significantly predict copula choice in the expected direction at higher levels and reveal a clearer developmental pattern for estar: though there are significant inverse effects at level 1 and level 2, this effect becomes non-significant at level 3, and significant in the expected direction at level 4.
The current section advances the analysis by exploring the significance of these variables when other factors are considered. A multiple regression analysis is conducted for each level of proficiency using the following variables: task type, individual frame of reference, immediate experience, adjective type, resultant state and referent animacy. Dependent variables are estar and non-estar. By running a multiple regression analysis, a predictive model for each level will be established, identifying significant predictors of copula choice among the independent variables.
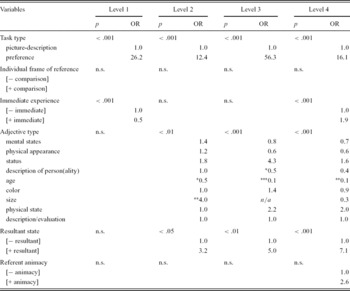
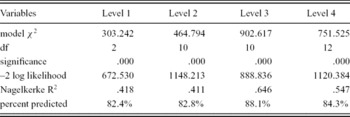
Results from the regression analyses of estar are presented in Table 12 and Table 13. Table 12 presents the significance of each predictor (p value) at each level as well as the odds ratios (ORs) for each option within each variable. Table 13 contains details of each regression analysis for estar by level.
Significance and odds ratios (ORs) of predictors of estar by level.

n.s. = not significant; * = p < .05; ** = p < .01; *** = p < .001
Details of regression analysis for estar by level of proficiency.

Table 12 presents several important findings. First, “task type” is seen to be a highly significant predictor of the use of estar at all levels of proficiency. In fact, the odds ratios suggest that it is by far the most significant predictor of estar at all levels of proficiency. Second, results from the regression analysis for estar by level of proficiency both confirm and clarify results from the analyses of individual variables. For example, Table 12 shows that “individual frame of reference” is never a significant predictor of the use of estar. This finding softens the earlier negative relationship observed between estar and comparison slides in the individual variable analysis. It is an important finding in that a non-relationship is more likely than a significant negative relationship, given the theoretical association of estar with comparisons within an individual frame of reference. Also, it can be seen that “immediate experience” with the referent is a significant predictor at level 1 and level 4: [–immediate] contexts predict estar at level 1, while [+immediate] contexts predict estar at level 4. Interestingly, the significant negative relationship between “immediate experience” and estar at level 2, from the earlier single-variable analysis, loses its significance in the presence of other factors. Regarding additional variables, Table 12 reveals that “resultant state” becomes a significant predictor at level 2 and increases in significance through level 4, as do the odds ratios at those levels: 3.2 to 5.0 to 7.1 from levels 2 through 4. Additionally, “referent animacy” is included in the predictability model at level 4, though it does not reach significance (p = .051) despite having a 2.6 odds ratio.
“Adjective type” is interesting to examine insofar as it becomes significant at level 2 and reaches high significance at levels 3 and 4. Unlike the binary variables discussed above, however, “adjective type” is more difficult to interpret given the presence of nine distinct adjective categories. In fact, a close look at the odds ratios across levels of proficiency reveals very few consistent developmental patterns: only “mental states” and “description of person(ality)” decrease across all levels of proficiency in their predictive ability. However, it must be remembered that the odds ratios are all calculated in relation to the adjective type “description/evaluation” which is held constant at 1.0, when in all probability this type also fluctuates across levels.
5. Discussion and conclusion
5.1 Discussion: “Individual frame of reference”
Findings from the present study suggest that comparisons within an individual frame of reference do not elicit the use of estar with adjectives more frequently than contexts lacking these types of comparisons. In fact, the analysis of this variable alone reveals significant trends in the opposite direction at levels 3 and 4. The regression analyses for estar, which take into consideration the impact of other variables, reveal that comparisons within an individual frame of reference were not significant predictors of estar at any level of proficiency.
“Individual frame of reference” and the SLA of copula choice
The findings from this study in relation to “individual frame of reference” are consistent with results from earlier studies. Though it is difficult to compare groups, given differences in proficiency estimates, differences in tasks and even differences in data coding procedures, previous studies that have included “individual frame of reference” as a predictive variable have also found either that “individual frame of reference” has no effect on the use of estar, or that it actually has a negative effect on the use of estar, that is, that “individual frame of reference” actually predicts the use of non-estar verbs instead of estar, opposite to what is hypothesized. Geeslin (Reference Geeslin1999, Reference Geeslin, Leow and Sanz2000), for example, finds no significant effect for “individual frame of reference” on the use of estar at levels 1 and 2, but significant negative effects at levels 3 and 4. Geeslin (Reference Geeslin2003) finds no significant effect among her native speaker group, but a significant negative effect among advanced learners. It should be noted that participants in Geeslin (Reference Geeslin1999, Reference Geeslin, Leow and Sanz2000) were high-school students at four levels of instruction, roughly corresponding to the current study's first two levels of proficiency, and that participants in Geeslin (Reference Geeslin2003) are beyond the proficiency levels addressed in the present study. Nevertheless, the non-significant or even significant negative effects of “individual frame of reference” on the use of estar are generally consistent with the findings from the current study.
Miller and Schmitt (Reference Miller and Schmitt2005) present another point of comparison for the current investigation due to the similarities of instrument design. In their study, Miller and Schmitt (Reference Miller and Schmitt2005) examine the development of ser and estar in Chilean children and adults using a picture description task that elicits individual frame-of-reference comparisons through side-by-side comparisons. The study found that adult speakers generally prefer ser for any kind of comparison, regardless of frame of reference. Thus, the non-significant effect of “individual frame of reference” on the use of estar found in the current investigation, is consistent with findings from Miller and Schmitt (Reference Miller and Schmitt2005).
“Individual frame of reference” and theoretical conceptualizations
As discussed above, findings from the current study as well as previous research either challenge or outright contradict the theoretical conceptualization of estar as a means to highlight a comparison within an individual frame of reference. However, several observations emerge from the present study that may address this discrepancy.
First, the current study examines a specific type of comparison within an individual frame of reference. These comparisons are elicited through slides that explicitly prompt side-by-side comparisons of the referent “before” and “now”. Non-comparison slides do not have these prompts nor do they have side-by-side frames. However, two additional types of comparisons emerge from the data. One type of comparison is “before” versus “now” frames within comparison slides. This kind of comparison incorporates a consideration of time frame. Thus, both “before” and “now” descriptions occur within comparisons, but are differentiated based on time frame. A second type of comparison that emerges is “initial” versus “subsequent” descriptions. This comparison is possible given that the first description may serve as the individual norm to which all other descriptions are compared. In this case, comparisons might occur beyond the explicit prompts to compare and include descriptions from all slides except the first. It can be seen, therefore, that the type of comparison contexts examined as “individual frame of reference” in the current study is only one of several types of comparisons created by the instrument design, all of which may be considered comparisons within an individual frame of reference. Thus, the discussion regarding the first research question must be tailored to this specific type of comparison: the use of estar in a side-by-side comparison with “before” and “now” frames.
The emergence of these additional types of comparisons within an individual frame of reference reveals the complexity of the theoretical conceptualization, a complexity that must be continually addressed in research designs. The considerations discussed above are present in the theory reviewed earlier. “Before” versus “now” comparisons relate to Bull's (Reference Bull1942) argument that change can be expressed forward or backward in time (p. 446), that the speaker perceives a change to have happened or believes one will soon occur. Similarly, Falk (Reference Falk1979a, Reference Falkb) recognizes the relevance of time in relation to comparison when he incorporates susceptibility to change into his “norm theory”. “Subsequent” compared to “initial” descriptions are present in the debate over the use of estar to express first impressions (Bull, Reference Bull1942; Navas Ruiz, Reference Navas Ruiz1963; Roldán, Reference Roldán1974a). Franco and Steinmetz (Reference Franco and Steinmetz1983, Reference Franco and Steinmetz1986) argue that comparisons of the X/X type can take many forms, for example X(now)/X(in its usual state) or X(in reality)/X(in its anticipated state). Silva-Corvalán (Reference Silva-Corvalán1986, Reference Silva-Corvalán1994) may best exemplify an application of “initial” versus “subsequent” to research design by requiring that speakers establish a norm for the individual before using estar to reference that norm. Thus, it can be seen that the additional considerations that emerge from the present study are not novel to theoretical conceptualizations, but rather represent the ongoing challenge of applying the theoretical conceptualizations of the use of estar with adjectives to research design and actual language use.
In conclusion, the present study addresses only one specific type of comparison within an individual frame of reference. It is clear, both from the data and from theoretical conceptualizations that other types of comparisons within an individual frame of reference are possible. Future research examining “individual frame of reference” will need to explore the additional considerations mentioned in the discussion above. For instance, does time frame play a role within comparison contexts? Does an initial description serve to establish a norm for the individual to which all other descriptions are compared? One way to explore these considerations is to more closely examine the content of the descriptions in order to identify contrasting descriptions within contexts of comparison. For example, the presence of opposing adjectives – such as viejo “old” and joven “young” – within comparisons would provide an opportunity to see if estar is used with at least one of them to express this contrast. This could be compared to the use of estar with non-opposing adjectives within the same contexts – such as maintaining that someone was intelligent then and is intelligent now. In the same way, a closer examination of the content of descriptions might help clarify differences between “initial” and “subsequent” descriptions. Future research, therefore, should make better use of the content of descriptions to ensure contrasts are occurring within comparison contexts.
In addition to the content of descriptions, features of the discourse may prove helpful in future research. For example, the use of “temporal anchors” – such as ahora “now” and antes “before” – should be examined in relation to the use of estar. Theoretical conceptualizations of the Spanish copula include this consideration as a factor for the use of estar (Fernández Leborans, Reference Fernández Leborans, Bosque and Demonte1999). Also, “justifications” emerge from the data as possible clues to the presence of resultant states. These “justifications” are often preceded by porque “because”, and take the form of an explanation for the attribute. Thus, Él está alegre porque ganó la lotería “He is happy because he won the lottery” provides an attribute which is justified by winning the lottery. The presence of these kinds of triggers would, in theory, increase the likelihood of using estar over ser. Discourse features such as “temporal anchors” and “justifications”, in addition to description content, should be examined in relation to the use of estar in “copula + adjective” in comparison contexts.
5.2 Discussion: “Immediate experience”
Results from the current study suggest that “immediate experience” does interact significantly with copula choice at different levels of proficiency: at levels 1 and 2 it has a significant negative effect on estar, at level 3 this effect is not significant, and at level 4 there is a positive effect on the use of estar. Thus “immediate experience” contexts predict estar with ever-increasing frequency from levels 1 through 4. When considered with other factors, the regression analysis shows that “immediate experience” is a significant negative predictor for estar at level 1 and a significant positive predictor for estar at level 4. The second research question can therefore be answered with a conditional yes: “immediate experience” predicts the use of estar at level 4, but predicts the use of non-estar verbs at level 1.
“Immediate experience” and the SLA of copula choice
Findings from the current study in relation to “immediate experience” differ slightly from previous research in the SLA of copula choice. Once again, it should be noted that comparisons are tentative given differences in methods used to establish proficiency levels, to collect data and to code data. For example, the current study is the first to use pictures specifically to elicit immediate experiences, contrasting them with non-picture experiences, and coding data accordingly. Additionally, as discussed in the methodology section, adapting the theoretical concept of “experience with the referent” to research design remains a challenge. However, despite these limitations, some comparisons can be made.
Geeslin (Reference Geeslin1999, Reference Geeslin, Leow and Sanz2000) finds “immediate experience” to be a negative predictor of estar at levels 1 and 2 and a non-significant negative predictor at level 4. If Geeslin's (Reference Geeslin1999, Reference Geeslin, Leow and Sanz2000) levels correspond roughly with the current study's first two levels, it can be seen that results from both studies generally agree. “Immediate experience” is a negative predictor of estar at low levels of proficiency: levels 1 and 2 in Geeslin (Reference Geeslin1999, Reference Geeslin, Leow and Sanz2000) and level 1 in the current study. This finding goes against what is hypothesized in the theory. By contrast, Geeslin (Reference Geeslin2003) finds that “immediate experience” is a non-significant predictor of estar among advanced learners, and one that is removed completely from the predictive model for native speakers. Results from the current study differ in that the significance of “immediate experience” increases in its predictive ability as levels of proficiency increase. Thus, level 4 reveals “immediate experience” as a significant positive predictor of estar. These findings seem to be more consistent with theoretical conceptualizations that associate estar with “immediate experience”.
“Immediate experience” and theoretical conceptualizations
Results from the current study suggest that “immediate experience” becomes an increasingly significant predictor of estar across levels of proficiency. This finding generally confirms the theoretical association of estar with contexts of immediate experience. However, it should be noted that “immediate experience” is a significant predictor of non-estar usage at level 1, a finding that is contrary to theoretical expectations. At level 1, non-immediate experiences are actually better predictors of the use of estar than contexts of immediate experience. Therefore, even though there is a pattern of increased use of estar in “immediate experience” across levels of proficiency, and even though “immediate experience” predicts the use of estar at higher levels of proficiency, the starting point at level 1 is actually an inverse relationship between “immediate experience” and estar.
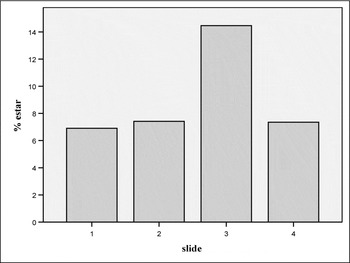
In the discussion of “individual frame of reference”, it was seen that the present study examined only one of several possible types of comparisons within an individual frame of reference, and that discourse features were important considerations for future research. In a similar way, the present study examines a specific type of “immediate experience”, namely a visual encounter with the referent. However, additional considerations related to “immediate experience” emerge from the data collected in the present study. For example, the notion of “unusualness” needs to be included as an added dimension of experience with the referent. The third slide in the sequence for each celebrity presented an “unusual” photograph of that celebrity: Harrison Ford in a Speedo bathing suit, a disheveled and confused Britney Spears, Michael Jackson in the Jackson Five, Madonna showing off her pregnant abdomen. A quick glance at the overall distribution of estar per slide (Figure 8) clearly shows that the third slide has a huge impact on the use of estar. Overall, estar is used nearly twice as frequently in the third slide as in any other slide. The notion of “unusualness”, therefore, merits attention in future research of the SLA of Spanish copula choice.
Estar by slide.

In addition to the examination of “unusualness”, future research would also benefit from a closer study of the discourse context. One particular feature of the discourse seems especially relevant to theoretical associations of estar with immediate reactions to the referent. Participants at times laughed or expressed other verbal indicators of surprise when encountering the unusual pictures in the third slide for each celebrity. This kind of discourse feature confirms a reaction to the picture, one that creates an opportunity to use estar to highlight that reaction. Future studies into “immediate experience” would benefit from examining this and other types of discourse features that confirm speaker reaction to the immediate experience with the referent.
5.3 Discussion: Methodology
In addition to the examination of the contextual variables “individual frame of reference” and “immediate experience”, an important contribution from the present investigation is the exploration, design and implementation of research instruments that create clear contexts for these pragmatic variables and elicit production data. As discussed in the methodology section, previous research instruments were not designed to intentionally create clear contexts of comparison within an individual frame of reference nor contexts of immediate experience with the referent. As a result, analyses of contextual variables often relied on researcher interpretation or were limited to coding for the possible presence of these variables in certain contexts. Additionally, theoretical conceptualizations of ser and estar are not easily adapted to research designs, particularly those theories that center on a speaker's intent within a particular context. The present study, therefore, tackles the challenge of adapting theoretical conceptualizations to research design, of creating clear contexts for these variables, and of confirming speaker intent, specifically in production data.
At the same time, the methodology needs to be further examined. First and foremost, there is the need to verify native speaker performance on the instrument. Results from native speakers often serve as a point of comparison for learner data elicited from a specific instrument. However, and perhaps of greater importance, native speaker data would help confirm the objectives of the instrument design, namely the creation of contexts of comparison and immediate experience. Secondly, future research into areas where contexts may be even more ambiguous and speaker intent just as relevant to theory would help to confirm the need and effectiveness of the instrument design. Two areas in Spanish that come readily to mind are the preterit/imperfect distinction and the choice to use the subjunctive: in both areas, the speaker has the ability to impose a specific interpretation on the context. Thirdly, the highly significant difference between task type – between production and preference data – suggests that future research should examine the tasks in relation to each other. Why do learners show a clear and strong preference for estar on the preference task, while ser dominates the production task? Are pragmatic contexts able to be represented effectively through narrative discourse? Finally, components of the present research design could be fine-tuned to include explorations of the additional types of comparisons discussed earlier, as well as the notion of “unusualness” within “immediate experience”.
5.4 Conclusion and directions for future research
The current study has successfully examined the SLA of Spanish copula choice with adjectives in contexts of comparisons within an individual frame of reference and in contexts of immediate experience with the referent. This was done through the design and use of two research tasks that create clear contexts of comparison within an individual frame of reference and immediate experience in order to confirm speaker intent within those contexts. When all variables examined are taken into account, results show that “individual frame of reference” is not a significant predictor of estar at any of the 4 levels of proficiency participating in the study. By contrast, “immediate experience” increases in its predictive ability across levels of proficiency, beginning with a surprising negative effect on estar at level 1, and progressing to a positive effect at level 4. Directions for future research emerge as a result of acknowledging the complexity of theoretical conceptualizations and the ongoing challenge to adapt theory to research practices. These directions relate both to a continued examination of the SLA of Spanish copula choice, particularly within different types of comparisons within an individual frame of reference and an examination of “unusualness” within immediate experience, as well as to the confirmation and use of the current instrument design for studies beyond the SLA of Spanish copula choice.