1. Introduction
The tokamak start-up process consists of a plasma breakdown phase, an impurities burn-through phase and a plasma current ramping-up phase (Knoepfel Reference Knoepfel1985; Jackson et al. Reference Jackson, Politzer, Humphreys, Casper, Hyatt, Leuer, Lohr, Luce, Van Zeeland and Yu2010; Mueller Reference Mueller2013). In this process, its success and failure severely depend on the prefiling gas pressure, induced field, impurities, stray magnetic field, hardware issues and so on. The first phase, plasma breakdown, is mainly achieved by the inductively induced toroidal electric field from a central solenoid. There are alternative start-up techniques, such as microwave heating (Yoshinaga et al. Reference Yoshinaga, Uchida, Tanaka and Maekawa2007; Lee et al. Reference Lee, Kim, An, Yoo, Hwang and Na2017; Shinya et al. Reference Shinya, Takase, Yajima, Moeller, Yamazaki, Tsujii, Yoshida, Ejiri, Togashi and Toida2017) and coaxial helicity injection (Ono et al. Reference Ono, Bell, Bell, Bigelow, Bitter, Blanchard, Darrow, Fredrickson, Gates and Grisham2001; Hammond, Raman & Volpe Reference Hammond, Raman and Volpe2018).
In the early days, plasma breakdown physics was mainly revealed by classical Townsend theory. However, the plasma in the tokamak is strongly magnetized, with electric characteristics being greatly different from the traditional Townsend discharge. In fact, the electric field for plasma breakdown is larger than that predicted by the Townsend theory. Experimental studies (Sand, Waelbroeck & Waidmann Reference Sand, Waelbroeck and Waidmann1973; Holly et al. Reference Holly, Prager, Shepard and Sprott1981; Lloyd & Edlington Reference Lloyd and Edlington1986; Yoshino & Seki Reference Yoshino and Seki1997; Kajiwara et al. Reference Kajiwara, Ikeda, Seki, Moriyama, Oikawa and Fujii2005) revealed that the electric field can be smaller when using the assist heating or preionization methods. In recent decades, many further studies have been developed on plasma breakdown (Jiang et al. Reference Jiang, Peng, Zhang and Lapenta2016; Yoo et al. Reference Yoo, Lee, Kim and Na2017; Peng et al. Reference Peng, Jiang, Innocenti, Zhang, Hu, Zhuang and Lapenta2018; Yoo et al. Reference Yoo, Lee, Kim, Kim, Maviglia, Sips, Kim, Hahm, Hwang and Lee2018). It has been found that the self-electric field produced by charge separation plays a large role in plasma breakdown. Besides, the breakdown is also related to other parameters, such as stray magnetic field, and prefill pressure (Lloyd et al. Reference Lloyd, Jackson, Taylor, Lazarus, Luce and Prater1991). Chew's work presented a three-dimensional simulation of a hydrogen discharge to expand to the tokamak ohmic breakdown (Chew et al. Reference Chew, Gibbon, Brömmel, Wauters, Gribov and de Vries2021) and compared different scatter models for electron–neural collisions.
It is also reported that the impurities have an influence on the tokamak breakdown process (Hawryluk & Schmidt Reference Hawryluk and Schmidt1976; Lloyd et al. Reference Lloyd, Jackson, Taylor, Lazarus, Luce and Prater1991; Lazarus et al. Reference Lazarus, Hyatt, Jackson and Humphreys1998) no matter whether it is assisted heating or not. Numbers of experiment studies (Hawryluk & Schmidt Reference Hawryluk and Schmidt1976; Kim, Fundamenski & Sips Reference Kim, Fundamenski and Sips2012; Kim, Sips & Fundamenski Reference Kim, Sips and Fundamenski2013b) and model simulations (Lloyd, Carolan & Warrick Reference Lloyd, Carolan and Warrick1996; Kim & Sips Reference Kim and Sips2013a; Kim, Sips & de Vries Reference Kim, Sips and de Vries2013c) have reported that the impurities from the wall could strengthen the radiated power loss during the plasma burn-through phase, which gives rise to the discharge failure. One is concerned more about the impurities when it is related to the plasma–wall interactions rather than plasma breakdown. Therefore, little attention has been paid to the effect of impurities on the plasma breakdown phase. Actually, the physical mechanism of the plasma breakdown with impurities has been far from understood clearly. It is well known that radiation by impurities in the plasma is unwanted, which is especially serious with heavy elements. Moreover, the impurities can contaminate the plasma and influence the plasma stability, even giving rise to the failure of discharge. The control of impurity levels in magnetically confined plasma is also a critical issue for fusion devices.
Since beryllium (Be) is the lightest metal that has a low retention hydrogen isotope and low radiation, it has been selected as the first wall in ITER. Beryllium is not suitable for a reactor (such as DEMO) and ITER chose this as the main wall material to mitigate the risk that tungsten poses on ITER achieving its mission to operate at 15 MA and at $Q=10$ . Therefore, it has drawn much attention to the tokamak plasma discharge with the ITER-like wall, including simulation and experimental studies. Experiments in an HT-7 tokamak with full metallic first walls have shown that with lithium coating, the impurity level and hydrogen recycling have been decreased (Chen et al. Reference Chen, Wu, Liu, Wang, Duan, Gao, Zhang, Huang, Sun and Jie2014). A more detailed analysis of beryllium poisoning can be found elsewhere (Wróblewska et al. Reference Wróblewska, Blanchet, Lyoussi, Blaise, Jagielski, Marcinkowska, Boettcher, Machtyl, Januchta and Wilczek2021). The inner-wall erosion has been compared at JET during the ITER-like wall campaigns (Krat et al. Reference Krat, Mayer, Coad, Lungu, Heinola, Baron-Wiechec, Jepu and Widdowson2021). An 0 dimension mode has been developed to simulate plasma start-up with the carbon wall and the ITER-like wall and it is found that the operation space was narrowed for the carbon wall compared with the pure deuterium plasma (Kim & Sips Reference Kim and Sips2013a). The effect of beryllium on plasma initiation obtained by JET between a carbon and a beryllium wall has been compared (de Vries et al. Reference de Vries, Sips, Kim, Lomas, Maviglia, Albanese, Coffey, Joffrin, Lehnen and Manzanares2013). Only by keeping the impurity level in the plasma sufficiently low will the plasma performance not be degraded. Currently, most diagnostic tools do not have a sufficient temporal resolution to measure the low-density, low-temperature plasma directly. A further simulation is needed. In this paper, we focus on the influence of beryllium impurity. Only by figuring out the impurities’ behaviours can the solution in obtaining good confinement plasma be carried out better.
In this work, the study is mainly focusing on two purposes. (i) The first purpose is to understand how the impurity of Be influences the plasma breakdown in the case of ohmic heating. We explore the behaviours of impurities, such as various collision rates, impurity ion energy and density. (ii) The second purpose is to provide experimental references for general tokamak operation. The initial plasma can have an effect on the overall tokamak discharge, which may lead to discharge failure, even to a later disruption. The study on the influence of beryllium during the tokamak start-up should be investigated to cast new points for experiment research.
This paper is organized as follows. In § 2 the implicit particle-in-cell (PIC) coupled with a Monte Carlo collision (MCC) simulation method is briefly described. Section 3 presents simulation results of the tokamak plasma breakdown under various amounts of impurity of beryllium. In § 4, the ionization rate of breakdown discharge and the averaged electric field are discussed. Finally, § 5 will conclude the work and give a prospect for future research and technical modifications.
2. Description of the model
Tokamak start-up is a complex problem. In order to make the simulation possible, we have made some assumptions. Our model is a one-dimensional model along the toroidal direction, which means it is a short slice of the infinitely long axis of a cylindrical tokamak. The plasma is uniform. In this work a PIC–MCC method (Lapenta, Brackbill & Ricci Reference Lapenta, Brackbill and Ricci2006) is used. This method which was developed previously has been applied to different plasma areas, such as microdischarges in the low-temperature plasma (Jiang, Zhang & Bogaerts Reference Jiang, Zhang and Bogaerts2014; Zhang, Jiang & Bogaerts Reference Zhang, Jiang and Bogaerts2014), magnetized capacitively coupled plasma (Yang et al. Reference Yang, Innocenti, Zhang, Yi and Jiang2017a,Reference Yang, Zhang, Wang, Cui and Jiangb; Wu et al. Reference Wu, Zhou, Gao, Peng, Wang and Jiang2021) and fusion plasma (Jiang et al. Reference Jiang, Peng, Zhang and Lapenta2016; Peng et al. Reference Peng, Jiang, Innocenti, Zhang, Hu, Zhuang and Lapenta2018). Here a brief description is given. The PIC is applied to describe the motions of particles, including electrons and ions. In the breakdown process, we mainly trace electron, ${\rm H}^{+}$ , ${\rm Be}^{+}$
 rather than ${\rm Be}^{+2}$
 , since the highly ionized ions appear in the burn-through process. The charged particles are in the three-dimensional velocity space. In the non-relativistic condition, the particle mover can be written as

where $\boldsymbol {a}^n={q\boldsymbol {E}^n}/{m}$ . The field solution has two kinds of algorithms, the direct implicit method and the implicit moment method (Lapenta et al. Reference Lapenta, Brackbill and Ricci2006). In the former method, the field is derived from direct summation and extrapolation of particle motion. In the implicit moment method the field is derived from the Vlasov movement equation. Here we adopt the direct implicit method. The electric field $\boldsymbol {E}$
 includes two parts: one is the induced loop electric field $\boldsymbol {E}_{\boldsymbol {ind}}$
 and the other one is the self-consistent electric field $\boldsymbol {E}_{\boldsymbol {se}}$
 (also called the ambipolar diffusion electric field) caused by the space charge effect, which can be obtained from the Poisson equation. The Poisson equation is solved from the charge density $\rho$
 which is weighted by all the charged particles in the cell. To simulate the limited length, a periodic field boundary condition is used. The $\boldsymbol {E}$
 and $\rho$
 repeat in every simulation space and the net charge is zero (Birdsall & Langdon Reference Birdsall and Langdon2005). It has been proved that $\boldsymbol {E}_{\boldsymbol {se}}$
 plays an important role in the current initiation in the tokamak (Valovi Reference Valovi1987).
The MCC procedure is coupled into PIC algorithms to consider the collisions, such as elastic collision, excitation and ionization collisions between electron and neutral, elastic collision and charge exchange collision between ion and neutral. All the collision reactions considered in the work are listed in table 1. In order to decrease the computational cost, we consider a null collision process (Vahedi & Surendra Reference Vahedi and Surendra1995), which is efficient in dealing with collisions. The collision probability is written as

Here $\nu _{{\rm max}}$ is the collision frequency calculated by summing up all the considered collision cross-sections between electrons and hydrogen atoms. The cross-section data used in this paper are referred from Phelps & Petrovic (Reference Phelps and Petrovic1999) and Zatsarinny & Bartschat (Reference Zatsarinny and Bartschat2004). Since the dissociated hydrogen is widely used in the simulation (Lloyd et al. Reference Lloyd, Carolan and Warrick1996; Kim et al. Reference Kim, Sips and de Vries2013c; Peng et al. Reference Peng, Jiang, Innocenti, Zhang, Hu, Zhuang and Lapenta2018), here we also adopt this assumption. The ionization cross-sections of the hydrogen atom and beryllium with electrons are shown in figure 1. The Be impurity profile is assumed uniform in the beginning.
Collision reactions considered in the simulation.

Ionization collision cross-section of H and Be with electrons, respectively.

In this work, the time step is $4\times 10^{-10}$ s, which has been tested many times to get fast and reliable simulation results. The physical time is 25–35 ms, which can ensure the entire breakdown. The physical length is 64 millimetres and is uniformly divided into 32 cells. The number of macroparticles per cell is 200, which is enough to restrain the numerical noise. Furthermore, the simulation results calculated are averaged every 1000 time steps to suppress the data noise. In addition, during the plasma breakdown phase, the electron increases exponentially, which may exhaust the memory and reduce computing speed, so the particle rezone trick is used.
3. Simulation results
3.1. Electron kinetics
The plasma breakdown with prefill pressure of $4.0\times 10^{-3}$ Pa and electric field of 0.3 V m$^{-1}$
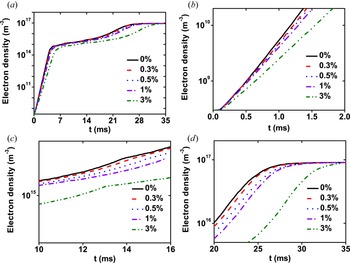
 is studied first. Figure 2 shows the temporal evolution of electron density. The longitudinal coordinate is a logarithmic plot. In previous studies (Jiang et al. Reference Jiang, Peng, Zhang and Lapenta2016; Peng et al. Reference Peng, Jiang, Innocenti, Zhang, Hu, Zhuang and Lapenta2018), we have found that the breakdown can be divided into three phases: fast avalanche, transition and slow avalanche. From this figure, three phases can be figured out clearly, showing in figure 2(b–d), respectively. The electron density increases exponentially at the beginning of the discharge. Electrons are accelerated by the loop electric field. When the electron energy exceeds the ionization collision threshold, ionization collision reactions occur, which causes an increase in electron density. The new electrons are accelerated by the induced loop electric field, which prompts more subsequent electrons. In the first phase, electron density increases fastest in the case without beryllium impurity. As theamount of beryllium increases, the ionization growth rate of electron density decreases. It is indicated that the impurity can affect the plasma ionization. In the second phase, as shown in figure 2(c), when the electron density reaches approximately $10^{15}\,{\rm m}^{-3}$
 , the growth rate of the electron density becomes slower than that in the first phase by comparing with the slope of electron density in figure 2(b,c). In the third phase, the ionization growth rate of electron density becomes larger than that in the second phase and smaller than that in the first phase. Moreover, the discrepancy in the ionization growth rate of electron density becomes large with the increase of electron density. Finally, the five discharge cases reach the same density, approximately $9\times 10^{16}\,{\rm m}^{-3}$
 . From the evolution of electron density, it is clear that the breakdown time is different as the amount of beryllium increases and the effect of impurities becomes larger with the increase of plasma density. The breakdown time is delayed due to the existence of the beryllium.
Time evolution of electron density for different Be amounts ($0\,\%$ (black), $0.3\,\%$
 (red), $0.5\,\%$
 (blue), $1\,\%$
 (violet), $3\,\%$
 (olive)): (a) 0–35 ms; (b) an expanded figure from (a) in 0–2 ms; (c) an expanded figure from (a) in 10–16 ms; (d) an expanded figure from (a) in 20–35 ms. This figure is a logarithmic plot. The discharge parameters are $P=4.0\times 10^{-3}$
 Pa and $E_{{\rm ind}}=0.3$
 V m$^{-1}$
 .

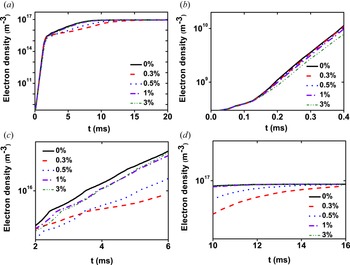
Up to now, the breakdown electric field using ohmic heating is often larger than the requirement on ITER, so here we also simulated the discharge with the electric field of 1.0 V m$^{-1}$ which is a typical value adopted on the tokamaks that are in operation. The time-evolution of electron density with different amounts of beryllium is shown in figure 3. It is clear to see that the breakdown is greatly improved after raising the breakdown electric field compared with the discharge cases in figure 2. From figure 3(a), the effect of beryllium does not rise much as the amount of beryllium increases. The breakdown only presents two phases: the fast avalanche and the slow avalanche phase. Since the induced electric field is larger, the transition phase becomes so short that it can be neglected. In the fast avalanche phase the growth rates of electron density in five discharges changes slightly, as shown in figure 3(b), which denotes that the effect of beryllium becomes weak during the low-density situation. Figure 3(c) presents the slow avalanche phase. In this figure, the electron density increases slowest in the case of $0.3\,\%$
 of beryllium impurity, followed by the case of $0.5\,\%$
 of beryllium impurity, which illustrates the growth rate of electron density does not increase with the amount of beryllium. This is a different characteristic compared with the discharge cases under the low breakdown electric field of 0.3 V m$^{-1}$
 .
Time evolution of electron density for different Be amounts (0 % (black), $0.3\,\%$ (red), $0.5\,\%$
 (blue), $1\,\%$
 (violet), $3\,\%$
 (olive)): (a) 0–20 ms; (b) an expanded figure from (a) in 0–0.4 ms; (c) an expanded figure from (a) in 2–6 ms; (d) an expanded figure from (a) in 10–16 ms. This figure is a logarithmic plot. The discharge parameters are $P=4.0\times 10^{-3}$
 Pa and $E_{{\rm ind}}=1.0$
 V m$^{-1}$
 .

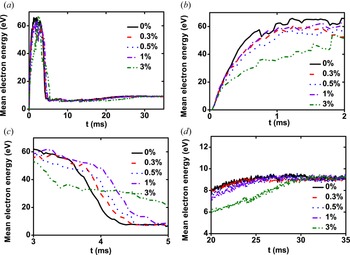
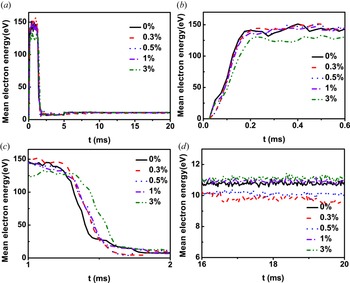
Since the electron density is related to the electron energy, the averaged electron energy evolution is shown in figure 4. The averaged energy rises rapidly to dozens of electron volts (eV) at the beginning of the discharge. In figure 4(b) the maximum energy can reach 65 eV in the discharge case without beryllium impurity. For the case containing 3 % beryllium impurity, the maximum averaged energy is approximately 40 eV. It is seen that the whole evolution of mean electron energy drifts to the right as the amount of beryllium increases. As the discharge proceeds, the averaged electron energy drops and then increases slowly. Finally, it reaches approximately 9 eV. Because of the induced loop electric field, electrons are mainly accelerated to obtain energy in the low-density situation. When the number of energetic electrons is considerable, large numbers of collision reactions occur, which leads to the reduction of electron energy. Moreover, as the electron density rises, the space charge effect will generate, which is also a cool source for electrons. With the increase of beryllium impurity, the mean electron energy becomes small due to the higher collision loss in a larger beryllium impurity discharge. When increasing the loop electric field, the mean electron energy evolution is shown in figure 5. The energy evolution is similar to the cases in figure 4, while the maximum energy can be 150 eV since the loop electric field (1.0 V m$^{-1}$ ) is larger. With the increase of beryllium impurity, the differences in the growth rate of electron energy are smaller compared with the cases in figure 4, which denotes that during the breakdown phase, the effect of beryllium becomes weak in the high electric field operation. As the discharge goes on, the electron energy decreases greatly due to collisions. The final energy in the case with $0.3\,\%$
 of beryllium impurity is the smallest, approximately 10 eV, while the case with $3\,\%$
 of beryllium impurity has the largest averaged electronenergy.
Time evolution of averaged electron temperature for different beryllium amounts ($0\,\%$ (black), $0.3\,\%$
 (red), $0.5\,\%$
 (blue), $1\,\%$
 (violet), $3\,\%$
 (olive)): (a) 0–35 ms; (b) an enlarged figure from (a) between 0 and 2 ms; (c) an enlarged figure from (a) between 3 and 5 ms; (d) an enlarged figure from (a) between 20 and 35 ms.

Time evolution of averaged electron temperature for different beryllium amounts ($0\,\%$ (black), $0.3\,\%$
 (red), $0.5\,\%$
 (blue), $1\,\%$
 (violet), $3\,\%$
 (olive)): (a) 0–20 ms; (b) an enlarged figure from (a) between 0 and 0.6 ms; (c) an enlarged figure from (a) between 1 and 2 ms; (d) an enlarged figure from (a) between 16 and 20 ms.

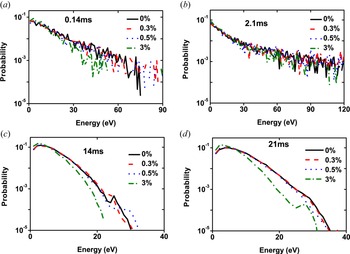
In order to estimate the effect of beryllium impurity on the electron kinetic behaviours, the electron energy probability function (EEPF) is presented. The EEPF can be calculated by solving the Boltzmann equation which describes the distribution function. If the EEPF is a Maxwell distribution, it can be written as

Here $\varepsilon$ is the electron energy, $T_{e}$
 is the electron temperature and $n_{e}$
 represents the electron density, so $\ln g_{p}$
 is linear with $\varepsilon$
 . If the collision cross-section is constant, the EEPF satisfies a Druyvesteyn distribution (Lieberman & Lichtenberg Reference Lieberman and Lichtenberg2005) which often happens in low-energy situations. The initial electron energy is 0.03 eV. Figure 6 shows the EEPF evolution for four discharge cases: 0 % beryllium; 0.3 % beryllium; 0.5 % beryllium; 3 % beryllium. The EEPFs at different times are presented to analyse the electron energy distribution thoroughly. At 0.14 ms as shown in figure 6(a), we can see that the electron energy can be dozens of electron volts from 0.03 eV, which indicates that electrons have been accelerated to get high energy. In this figure, the EEPF shows a Maxwell distribution. At approximately 2.1 ms, the EEPF shows a high-energy tail, which means the electrons are further heated by the ohmic heat power. After that, the EEPF decreases due to the occurrence of large numbers of excitation and ionization collisions. From 14 to 21 ms, the EEPFs changes slowly, but the electron energy still increases. From figure 6(c) the EEPF changes from the Maxwell distribution to the Druyvesteyn distribution for four discharge cases, which implies that electron energy decreases because of the large numbers of collisions. When the electron density is high, the electron energy increases slowly. Besides, with the increase in beryllium impurity, the EEPF becomes slightly small, which means the impurity can influence the electron energy distribution.
Electron energy probability function in four cases with prefill pressure of $4.0\times 10^{-3}$ Pa, the electric field of 0.3 V m$^{-1}$
 under different amounts of beryllium.

3.2. Ion kinetics
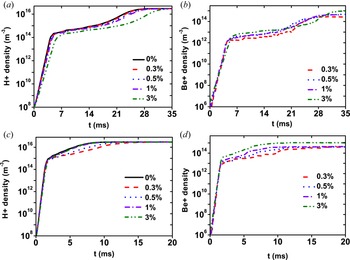
The evolution of ion density is shown in figure 7, including ${\rm H}^{+}$ and ${\rm Be}^{+}$
 . The discharge condition in figure 7(a,b) is under the induced loop electric field of 0.3 V m$^{-1}$
 , while in figure 7(c,d) the induced loop electric field is 1 V m$^{-1}$
 . As shown in figure 7(a), ${\rm H}^{+}$
 density increases exponentially, and the trend is the same as the electron density, showing three phases. The growth rate of ${\rm H}^{+}$
 density decreases as the amount of beryllium rises. The higher the beryllium level, the smaller the ${\rm H}^{+}$
 density, which is the same as the electron density. In the slow avalanche phase, the discrepancy in the density evolution becomes larger with higher amount of beryllium discharge. It is evident that the effect of beryllium impurity is important in the high plasma density situation, which in turn illustrates that impurities will influence the burn-through process much more. This is because a large number of radiations caused by the impurity occur during a larger plasma density. The ${\rm Be}^{+}$
 density is shown in figure 7(b). The change rate of ${\rm Be}^{+}$
 density is proportional to the beryllium level since the collision ionization increases with the beryllium density. When improving the induced loop electric field, the evolution of ${\rm H}^{+}$
 density presents two phases: fast avalanche and slow avalanche phases, as shown in figure 7(c). In this figure, the growth rate of ${\rm H}^{+}$
 density is not proportional to the beryllium level, which is different from that in figure 7(a). The growth rate in the case with $0.3\,\%$
 beryllium decreases greatly during the slow avalanche phase. Figure 7(d) shows the temporal evolution of ${\rm Be}^{+}$
 density. It is obvious that the ${\rm Be}^{+}$
 density increases fastest with $3\,\%$
 beryllium in four discharge cases in the whole breakdown process. This is because the beryllium collision rate is proportional to the beryllium density.
Time evolution of (a) ${\rm H}^{+}$ density, (b) ${\rm Be}^{+}$
 density in the prefill pressure of $4.0\times 10^{-3}$
 Pa, the electric field of 0.3 V m$^{-1}$
 with different amounts of beryllium. Time evolution of (c) ${\rm H}^{+}$
 density, (d) ${\rm Be}^{+}$
 density in the prefill pressure of $4.0\times 10^{-3}$
 Pa, the electric field of 1.0 V m$^{-1}$
 under different amounts of beryllium.

The evolution of ${\rm H}^{+}$ ions means energy under the electric field of 0.3 V m$^{-1}$
 is shown in figure 8(a). The initial ion energy is 0.03 eV which is the same as the working gas. During the fast avalanche phase, the ion energy increases slowly. This is because the loop electric field is mainly used to heat electrons, while the ion energy is mainly obtained from electrons. In the transition phase, the evolution of ion energy has a clear discrepancy. As the plasma density rises, the ambipolar diffusion field caused by the space charge effect begins to play a role, which is a heating source for ions. In the slow avalanche phase, the averaged ion energy increases more with the increase of the beryllium level. During this phase, the ambipolar diffusion field increases to a certain value. With the growth of the ambipolar diffusion field, the ions obtain energy from electrons. The larger the ambipolar diffusion field, the higher the average ion energy. The ion energy can be 8–12 eV at the end of the breakdown. Figure 8(b) shows the evolution of average ion energy under the electric field of 1.0 V m$^{-1}$
 with different amounts of beryllium. When the induced loop electric field increases, the final ion energy is much higher. The final ion energy indicates that the effect of beryllium impurity becomes weak as the electric field increases. That is to say under the low electric field operation scenario, the discharge has a more strict requirement for impurity levels.
The time evolutions of averaged ${\rm H}^{+}$ ion energy with the prefill pressure of $4.0\times 10^{-3}$
 Pa and electric field of 0.3 V m$^{-1}$
 .

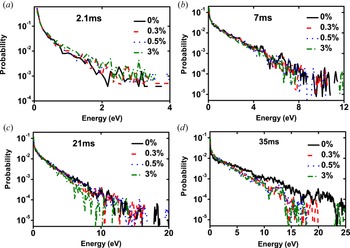
In order to investigate the ion kinetic behaviours, the ion energy probability function (IEPF) is shown in figure 9. This figure shows the evolutions of IEPF at different times under four discharge cases with different amounts of beryllium. The IEPF shows a Maxwell distribution and it indicates that the ion energy rises gradually with the discharge. At 2.1 ms, the IEPFs in figure 9(a) have a small discrepancy: the discharge with a higher amount of beryllium has a large IEPF. This is because electrons are mainly heated rather than colliding with hydrogen atoms, so the collision frequency between electrons and hydrogen atoms is lower as the beryllium level increases. When electron energy is larger than the ionization threshold, a larger number of ionization collisions occur, and then the IEPFs show little difference at 7 ms. At 21 ms, the phenomenon is reversed. At this time, the plasma density is relatively high, and collisions are greatly enhanced, so the ionization and radiation loss are increased in the higher beryllium level case, which leads to a decrease in the IEPF. Besides, there is a small fraction of high-energy ions whose energy can reach 60 eV. At the end of the breakdown process, the discrepancy of IEPFs under different amounts of beryllium becomes much larger at 35 ms. The higher the beryllium level, the lower the IEPF. This can be explained that when large numbers of collisions happen, the beryllium impurity radiation and ionization loss increase, so the final ion energy is lower in the high beryllium level case. The IEPFs are in good agreement with the ion mean energy in figure 8.
The ${\rm H}^{+}$ ion energy probability function in the case with prefill pressure of $4.0\times 10^{-3}$
 Pa, electric field of 0.3 V m$^{-1}$
 under different amounts of beryllium.

4. Discussion
4.1. Ionization rate
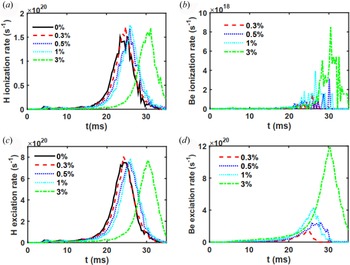
The ionization rate and excitation rate under different discharge parameters are shown in figure 10. Figure 10(a) shows the H ionization rate. As the discharge proceeds, the hydrogen atom ionization rate increases until the peak occurs, and then it begins to decrease. Electrons are heated by the loop electric field in the beginning. Once numbers of electrons get enough energy to collide with hydrogen atoms or beryllium molecules, a large number of excitation collisions occur, as well as ionization collisions. As the discharge proceeds, the hydrogen atom density decreases, then the collision rate also decreases. The peak values at different beryllium level cases have little difference, while they drift to the right as the amount of beryllium rises, which indicates that beryllium can influence plasma breakdown. It is clear evidence that impurities can delay the breakdown process. Figure 10(c) shows the total excitation rate of beryllium. Here the excitation rate is like the $D_{\alpha }$ , and its peak is often regarded as the breakdown time. Moreover, the peak value is like the ionization rate, it drifts to the right. This demonstrates that beryllium impurity can delay the breakdown. The breakdown time isapproximately 23–33 ms in the different amounts of Be cases. Figures 10(b) and 10(d) show the beryllium ionization rate and excitation rate, respectively. Since the ionization rate is proportional to beryllium density, the maximum value occurs in the $3\,\%$
 beryllium discharge. The trend of the beryllium excitation rate is like that of the hydrogen atom. It increases as the plasma density rises until the peak value and then drops. The larger the amount of beryllium, the higher the excitation rate peak.
Time evolution of (a) H ionization rate, (b) Be ionization rate, (c) H excitation rate, (d) Be excitation rate in the prefill pressure of $4.0\times 10^{-3}$ Pa, the electric field of 0.3 V m$^{-1}$
 with different amounts of beryllium.

4.2. Electric field
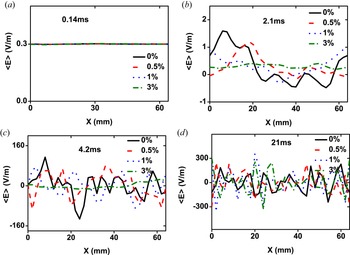
With the discharge proceeding, the electric field in the plasma has changed. Figure 11 shows the spatial evolution of total electric field in the toroidal direction at different times. In this work, the electric field satisfies the equation $E_{{\rm total}}^{\phi }=E_{{\rm ind}}^{\phi }+E_{{\rm se}}^{\phi }$ . The ambipolar diffusion electric field must have various directions and magnitudes to satisfy Gauss's law ($\boldsymbol {\nabla } \boldsymbol {\cdot } E= \rho /\epsilon _{0}$
 ), which leads to the fluctuations in the electric field. At a specific time, $E_{{\rm se}}$
 cannot only cancel $E_{\varPhi }$
 out at some positions but also can strengthen $E_{\varPhi }$
 at the other positions. From figure 11(a) the averaged electric field is a constant (0.3 V m$^{-1}$
 ) which is equal to the induced electric field. It is clear to see that the induced loop electric field plays a dominant role in heating electrons when the plasma density is low at 0.14 ms. As it increases, the ambipolar diffusion field caused by the separation of electrons and ions begins to grow. From figure 11(b–d), it oscillates along space, and the oscillation frequency becomes fast as the discharge proceeds. Finally, its amplitude can reach approximately 300 V m$^{-1}$
 in figure 11(d). Its length can be approximately 8 mm. It illustrates that the ambipolar diffusion field becomes dominant during the third phase. Although the ambipolar diffusion field is much larger than $E_{{\rm ind}}^{\phi }$
 at some positions, the spatial average electric field is still comparable to the loop-induced electric field. In addition, as the amount of beryllium increases, the growth rate of the ambipolar diffusion field decreases. The impurity particles suppress the increase of the ambipolar diffusion field and it in turn influences the growth rate of plasma density and finally delays the plasma breakdown, which is in good agreement with the plasma density evolution in figure 2.
The time-averaged electric field with prefill pressure of $4.0\times 10^{-3}$ Pa, electric field of 0.3 V m$^{-1}$
 at different times.

5. Conclusions
In this paper, tokamak start-up by ohmic heating has been studied with an implicit PIC–MCC model. This contribution mainly describes the temporal evolution of plasma parameters and analyses the behaviours of an impurity (beryllium). Electron density increases exponentially during the breakdown and early burn-through phase under the induced loop voltage. The evolution of electron density can be divided into three phases with different ionization rates. However, with the increase in the amount of beryllium. The generation rate of electrons is suppressed, which illustrates that the beryllium impurity can restrain the breakdown. On one side, the beryllium particles can cause energy loss, which will consume the ohmic power. On the other side, impurities can impede the motion of plasmas, which will suppress the growth of the ambipolar electric field. Both two sides cause the plasma breakdown delay. As the loop electric field increases, the effect of impurity decreases. It indicates that plasma breakdown has a higher requirement for impurity amount in the low electric field regime.
Based on the simulation results, we propose possible operation suggestions for better plasma breakdown. Firstly, since the impurity can influence the generation rate of plasma, especially in the low electric field regime, it is necessary to control the impurity amount. Secondly, the impurity can also affect the plasma energy. Since the impurity collisions cause energy loss, the averaged electron energy is restrained. Once the electron energy is higher, higher ionization collisions will occur, which will cause much larger energy loss.
Finally, it is necessary to state future research. Since in this work, the plasma breakdown process is completed with milliseconds, the high ionization state of an impurity is neglected. However, the electron energy becomes more elevated in the burn-through process, so the high ionization state must be considered. In the future, we will expand our research to the burn-through process and consider impurity particles with high ionization states and energy balance.
Acknowledgements
The authors thank the anonymous reviewers for their valuable feedback.
Editor H. Zohm thanks the referees for their advice in evaluating this article.
Funding
This work was supported by the National Natural Science Foundation (grant numbers 11905030, 12005136), the Natural Science Foundation of Jiangxi Province (grant number 20212BAB211002), the Undergraduate Innovation and Entrepreneurship Training Plan (grant number 202010405002) and the East China University Of Technology Research Foundation for Advanced Talents (grant numbers DHBK2019207, DHBK2019212).
Declaration of interests
The authors report no conflict of interest.