





%20--%3e%3c!DOCTYPE%20svg%20PUBLIC%20'-//W3C//DTD%20SVG%201.0//EN'%20'http://www.w3.org/TR/2001/REC-SVG-20010904/DTD/svg10.dtd'%3e%3csvg%20version='1.0'%20id='Layer_1'%20xmlns='http://www.w3.org/2000/svg'%20xmlns:xlink='http://www.w3.org/1999/xlink'%20x='0px'%20y='0px'%20width='64px'%20height='64px'%20viewBox='5.5%20-3.5%2064%2064'%20enable-background='new%205.5%20-3.5%2064%2064'%20xml:space='preserve'%3e%3cg%3e%3ccircle%20fill='%23FFFFFF'%20fill-opacity='0'%20cx='37.785'%20cy='28.501'%20r='28.836'/%3e%3cpath%20fill='%23595959'%20d='M37.441-3.5c8.951,0,16.572,3.125,22.857,9.372c3.008,3.009,5.295,6.448,6.857,10.314%20c1.561,3.867,2.344,7.971,2.344,12.314c0,4.381-0.773,8.486-2.314,12.313c-1.543,3.828-3.82,7.21-6.828,10.143%20c-3.123,3.085-6.666,5.448-10.629,7.086c-3.961,1.638-8.057,2.457-12.285,2.457s-8.276-0.808-12.143-2.429%20c-3.866-1.618-7.333-3.961-10.4-7.027c-3.067-3.066-5.4-6.524-7-10.372S5.5,32.767,5.5,28.5c0-4.229,0.809-8.295,2.428-12.2%20c1.619-3.905,3.972-7.4,7.057-10.486C21.08-0.394,28.565-3.5,37.441-3.5z%20M37.557,2.272c-7.314,0-13.467,2.553-18.458,7.657%20c-2.515,2.553-4.448,5.419-5.8,8.6c-1.354,3.181-2.029,6.505-2.029,9.972c0,3.429,0.675,6.734,2.029,9.913%20c1.353,3.183,3.285,6.021,5.8,8.516c2.514,2.496,5.351,4.399,8.515,5.715c3.161,1.314,6.476,1.971,9.943,1.971%20c3.428,0,6.75-0.665,9.973-1.999c3.219-1.335,6.121-3.257,8.713-5.771c4.99-4.876,7.484-10.99,7.484-18.344%20c0-3.543-0.648-6.895-1.943-10.057c-1.293-3.162-3.18-5.98-5.654-8.458C50.984,4.844,44.795,2.272,37.557,2.272z%20M37.156,23.187%20l-4.287,2.229c-0.458-0.951-1.019-1.619-1.685-2c-0.667-0.38-1.286-0.571-1.858-0.571c-2.856,0-4.286,1.885-4.286,5.657%20c0,1.714,0.362,3.084,1.085,4.113c0.724,1.029,1.791,1.544,3.201,1.544c1.867,0,3.181-0.915,3.944-2.743l3.942,2%20c-0.838,1.563-2,2.791-3.486,3.686c-1.484,0.896-3.123,1.343-4.914,1.343c-2.857,0-5.163-0.875-6.915-2.629%20c-1.752-1.752-2.628-4.19-2.628-7.313c0-3.048,0.886-5.466,2.657-7.257c1.771-1.79,4.009-2.686,6.715-2.686%20C32.604,18.558,35.441,20.101,37.156,23.187z%20M55.613,23.187l-4.229,2.229c-0.457-0.951-1.02-1.619-1.686-2%20c-0.668-0.38-1.307-0.571-1.914-0.571c-2.857,0-4.287,1.885-4.287,5.657c0,1.714,0.363,3.084,1.086,4.113%20c0.723,1.029,1.789,1.544,3.201,1.544c1.865,0,3.18-0.915,3.941-2.743l4,2c-0.875,1.563-2.057,2.791-3.541,3.686%20c-1.486,0.896-3.105,1.343-4.857,1.343c-2.896,0-5.209-0.875-6.941-2.629c-1.736-1.752-2.602-4.19-2.602-7.313%20c0-3.048,0.885-5.466,2.658-7.257c1.77-1.79,4.008-2.686,6.713-2.686C51.117,18.558,53.938,20.101,55.613,23.187z'/%3e%3c/g%3e%3c/svg%3e)
%20--%3e%3c!DOCTYPE%20svg%20PUBLIC%20'-//W3C//DTD%20SVG%201.0//EN'%20'http://www.w3.org/TR/2001/REC-SVG-20010904/DTD/svg10.dtd'%3e%3csvg%20version='1.0'%20id='Layer_1'%20xmlns='http://www.w3.org/2000/svg'%20xmlns:xlink='http://www.w3.org/1999/xlink'%20x='0px'%20y='0px'%20width='64px'%20height='64px'%20viewBox='5.5%20-3.5%2064%2064'%20enable-background='new%205.5%20-3.5%2064%2064'%20xml:space='preserve'%3e%3cg%3e%3ccircle%20fill='%23FFFFFF'%20fill-opacity='0'%20cx='37.637'%20cy='28.806'%20r='28.276'/%3e%3cg%3e%3cpath%20fill='%23595959'%20d='M37.443-3.5c8.988,0,16.57,3.085,22.742,9.257C66.393,11.967,69.5,19.548,69.5,28.5c0,8.991-3.049,16.476-9.145,22.456%20C53.879,57.319,46.242,60.5,37.443,60.5c-8.649,0-16.153-3.144-22.514-9.43C8.644,44.784,5.5,37.262,5.5,28.5%20c0-8.761,3.144-16.342,9.429-22.742C21.101-0.415,28.604-3.5,37.443-3.5z%20M37.557,2.272c-7.276,0-13.428,2.553-18.457,7.657%20c-5.22,5.334-7.829,11.525-7.829,18.572c0,7.086,2.59,13.22,7.77,18.398c5.181,5.182,11.352,7.771,18.514,7.771%20c7.123,0,13.334-2.607,18.629-7.828c5.029-4.838,7.543-10.952,7.543-18.343c0-7.276-2.553-13.465-7.656-18.571%20C50.967,4.824,44.795,2.272,37.557,2.272z%20M46.129,20.557v13.085h-3.656v15.542h-9.944V33.643h-3.656V20.557%20c0-0.572,0.2-1.057,0.599-1.457c0.401-0.399,0.887-0.6,1.457-0.6h13.144c0.533,0,1.01,0.2,1.428,0.6%20C45.918,19.5,46.129,19.986,46.129,20.557z%20M33.042,12.329c0-3.008,1.485-4.514,4.458-4.514s4.457,1.504,4.457,4.514%20c0,2.971-1.486,4.457-4.457,4.457S33.042,15.3,33.042,12.329z'/%3e%3c/g%3e%3c/g%3e%3c/svg%3e)
1. Introduction
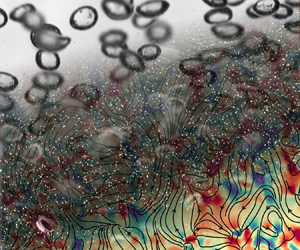
When a swarm of bubbles rises in an otherwise stagnant fluid, due to the motion of bubbles disturbances are created in the surrounding fluid giving rise to velocity fluctuations. At a moderate to high Reynolds number,  $Re$, these velocity fluctuations in the wake behind the bubbles interact with one another giving rise to the emergence of
 $k^{-3}$ scaling of the energy spectra,
 $E(k)$, of velocity fluctuations. This signature
 $k^{-3}$ scaling of the energy spectra instead of the classical
 $k^{-5/3}$ Kolmogorov scaling is regarded as bubble-induced turbulence, also referred to as pseudoturbulence (Risso Reference Risso2018).
Lance & Bataille (Reference Lance and Bataille1991) were the first to observe the emergence of  $k^{-3}$ scaling of energy spectra,
 $E(k)$, with respect to the wavenumber,
 $k$, for the bubble-induced turbulence in Newtonian fluids. They argued that in a spectral space, the balance between the energy produced by the motion of bubbles and the viscous dissipation in a statistically steady state gives rise to the emergence of
 $k^{-3}$ scaling. Following this pioneering work, a number of numerical (Esmaeeli & Tryggvason Reference Esmaeeli and Tryggvason1996; Bunner & Tryggvason Reference Bunner and Tryggvason2002b; Balachandar & Eaton Reference Balachandar and Eaton2010) and experimental (Zenit, Koch & Sangani Reference Zenit, Koch and Sangani2001; Martínez-Mercado, Palacios-Morales & Zenit Reference Martínez-Mercado, Palacios-Morales and Zenit2007; Riboux, Legendre & Risso Reference Riboux, Legendre and Risso2013; Prakash et al. Reference Prakash, Mercado, Van Wijngaarden, Mancilla, Tagawa, Lohse and Sun2016; Alméras et al. Reference Alméras, Mathai, Lohse and Sun2017) works supported the emergence of
 $k^{-3}$ scaling for both the spatial and temporal velocity fluctuations generated by the bubble motion (Risso Reference Risso2018). Amoura et al. (Reference Amoura, Besnaci, Risso and Roig2017) showed experimentally that irrespective of the dispersed phase, be it bubbles or random fixed solid spheres, the velocity fluctuations generated in the continuous phase give rise to the
 $k^{-3}$ scaling. Pandey, Mitra & Perlekar (Reference Pandey, Mitra and Perlekar2023) identified the coexistence of Kolmogorov's turbulence with the bubble-induced turbulence for a wide range of Reynolds number and Galilei number (ratio of buoyancy to viscous forces). Recently, Zamansky, De Bonneville & Risso (Reference Zamansky, De Bonneville and Risso2024) proposed that the
 $k^{-3}$ subrange of the energy spectra results from the mean shear rate imposed by the bubbles, ruling out the speculation by Lance & Bataille (Reference Lance and Bataille1991) of the balance between spectral production and spectral dissipation.
Experimentally determining the liquid velocity fluctuations in two-phase gas–liquid flows is challenging. Due to the dispersed nature of bubbly flow, laser-based techniques within the bubble swarm can only be used for very dilute flows. On the other hand, the hot-wire-based techniques (Martínez-Mercado et al. Reference Martínez-Mercado, Palacios-Morales and Zenit2007; Mendez-Diaz et al. Reference Mendez-Diaz, Serrano-Garcia, Zenit and Hernandez-Cordero2013; Alméras et al. Reference Alméras, Mathai, Lohse and Sun2017) are far from perfect as their use implies elaborate signal processing. To overcome these difficulties, Riboux, Risso & Legendre (Reference Riboux, Risso and Legendre2010) measured the liquid velocity fluctuations by abruptly stopping the bubble formation using a solenoid valve thus leaving the wake behind the bubble swarm free of bubbles to be analysed using particle image velocimetry (PIV). They showed that the  $k^{-3}$ scaling, independent of the gas volume fraction and bubble diameter, is observed between the Eulerian length scale (
 $\varLambda = D/C_d$) and the bubble diameter (
 $D$), where
 $C_d$ is the drag coefficient of a single rising bubble. Later Risso (Reference Risso2018) modified the Eulerian length scale,
 $\varLambda = {D}/{\sqrt {C_d {Re}}}$, to include the Reynolds number.
An intriguing question is to explore what happens to the energy spectra of the bubbly flows at lower Reynolds number (Bunner & Tryggvason Reference Bunner and Tryggvason2002a,Reference Bunner and Tryggvasonb). When  $Re < 20$, the bubbles will not have significant wakes behind them (Blanco & Magnaudet Reference Blanco and Magnaudet1995; Mougin & Magnaudet Reference Mougin and Magnaudet2001). A clue as to what to expect for smaller Reynolds numbers was summarized by Mazzitelli, Lohse & Toschi (Reference Mazzitelli, Lohse and Toschi2003), who conducted numerical simulations for bubbly Newtonian fluids considering bubbles as point particles. Specifically, they did not observe the
 $k^{-3}$ scaling, thus concluding the essentiality of the wakes. They further argued that the energy spectrum slope for bubbly flows with little to no wakes behind them will depend on the number of bubbles and will therefore be non-universal (Mazzitelli et al. Reference Mazzitelli, Lohse and Toschi2003; Mazzitelli & Lohse Reference Mazzitelli and Lohse2009). Most surprisingly, to our knowledge, there are only a few experimental studies in this regime (Cartellier & Rivière Reference Cartellier and Rivière2001; Martínez-Mercado et al. Reference Martínez-Mercado, Palacios-Morales and Zenit2007; Mendez-Diaz et al. Reference Mendez-Diaz, Serrano-Garcia, Zenit and Hernandez-Cordero2013). Cartellier & Rivière (Reference Cartellier and Rivière2001) studied bubble-induced agitations at
 $Re \sim O(1)$; however, to delay the onset of large-scale instabilities (transition into the heterogeneous bubbly regime) an inner tube within the bubble column was used to create the liquid flow rate due to the gas lift. Further, they did not address the nature of energy spectra of liquid velocity fluctuations.
In the present study we focus only on the homogeneous bubbly regime to address the effect of Reynolds number on the bubble-induced turbulence. Using the PIV technique proposed by Riboux et al. (Reference Riboux, Risso and Legendre2010), the liquid velocity fluctuations are determined to calculate the energy spectra. We find that as the Reynolds number decreases the slope of the energy spectra emerges as  $k^{-5/3}$ instead of the
 $k^{-3}$ scaling observed for the bubble-induced turbulence. Further, we show that this slope of the energy spectra depends on the number of bubbles in the column. Understanding the spectral structure of the fluid velocity fluctuations in two-phase flows at low
 $Re$ could be justified by their relevance in modern applications such as microfluidics (Anna Reference Anna2016) and hydrogen production (Avci & Toklu Reference Avci and Toklu2022).
2. Experimental set-up and methods
2.1. Experimental set-up
Figure 1(a) shows a schematic of the experimental set-up used in the present study. It consists of a transparent acrylic tank of height 1000 mm with a cross-section of  $100\,{\rm mm}\times 50\,{\rm mm}$. Monodispersed air bubbles are injected at the bottom of the tank through a removable capillary bank. The capillary bank is custom made with identical capillaries of inner diameter 0.6 mm in tandem with a secondary capillary of inner diameter 0.25 mm, arranged in a hexagonal array to increase the number of identical capillaries per unit area (Martínez-Mercado et al. Reference Martínez-Mercado, Palacios-Morales and Zenit2007). The tandem arrangement provides sufficient hydraulic resistance through the capillaries such that individual bubbles are formed in a quasi-steady manner, thereby avoiding the generation of gas jets (Oguz & Prosperetti Reference Oguz and Prosperetti1993). The gas flow rate is adjusted using a needle valve.
(a) Schematic of the experimental set-up used in the current study. Using a solenoid valve, the formation of bubbles is abruptly stopped and the wake behind the bubble swarm is visualized using PIV in the measurement section. The size of the measurement section is  $40\,{\rm mm} \times 40\,{\rm mm}$. A sample snapshot of a bubbly flow with gas volume fraction of
 $\alpha \approx 0.025$ in Newtonian fluid with viscosity (b)
 $Re = 626$ and
 $We = 3.2$ and (c)
 $Re = 6$ and
 $We = 0.5$. The scale bar is 10 mm.

The velocity fluctuations in the liquid phase are measured from the wake behind the bubble swarm, following the method used by Riboux et al. (Reference Riboux, Risso and Legendre2010). The airflow is abruptly stopped by using a rapid solenoid valve. Then, the region behind the bubble swarm is studied using high-speed PIV (Photron FASTCAM SA5 at 500 frames per second). The recorded images were then analysed using PIVLab in MATLAB. For the PIV analysis,  $32 \times 32$ pixel interrogation regions in the first pass and
 $16 \times 16$ pixel interrogation regions in the second pass with 50 % overlap on the subsequent pass are used. The physical distance between two neighbouring vectors is 0.3 mm. Spurious vectors are detected by median test and replaced by interpolating neighbour vectors. From the two-dimensional PIV data, the liquid velocity fluctuations in the bubble swarm wake are obtained as follows:
 $\boldsymbol {u'} = \boldsymbol {u} - \langle \boldsymbol {u}\rangle$. Here
 $\langle \rangle$ represents the average in space. The energy spectra,
 $E(k)$, of the velocity fluctuations are determined from the decaying turbulence behind the bubble swarm following Riboux et al. (Reference Riboux, Risso and Legendre2010). The energy spectra of horizontal and vertical velocity fluctuations are then obtained using the Welch method by averaging the energy spectra of each row and column, respectively. To determine the velocity fields within the bubbly swarm at low gas volume fraction, fluorescent particles with an orange filter in the camera were used. The details of the fluorescent particle imaging technique can be found in our earlier study (Ravisankar et al. Reference Ravisankar, Correa, Su and Zenit2022).
2.2. Test fluids
To prepare viscous Newtonian fluids, water–glycerin mixtures were used. The properties of the fluids used in the study, including shear viscosity, density and surface tension measured using an ARES-G2 rheometer (TA Instruments), density meter (Anton Paar) and bubble pressure tensiometer (KRUSS Scientific Instruments), are listed in table 1. To reduce bubble coalescence, a small amount of magnesium sulfate salt (0.05 mol l $^{-1}$) was added to all the fluids used in the study, following Lessard & Zieminski (Reference Lessard and Zieminski1971). The relevant dimensionless numbers used in the current study are (i) Reynolds number,
 $Re = \rho U D/\mu$, where
 $U$ is the average bubble velocity,
 $D$ is the average bubble diameter,
 $\rho$ is the fluid density and
 $\mu$ is the fluid viscosity, and (ii) Weber number,
 $We = \rho U^2 D/\sigma$, where
 $\sigma$ is the surface tension. The average bubble diameter and velocity were obtained from the probability distribution derived from the image processing. The Kolmogorov length scale was calculated as
 $\eta = (\nu ^3/\epsilon )^{1/4}$, where
 $\nu = \mu /\rho$ is the kinematic viscosity and
 $\epsilon$ is the dissipation rate. In turn,
 $\epsilon$ was determined from the fluctuating rate of strain tensor using the local isotropic assumption following Xu & Chen (Reference Xu and Chen2013). The mean gas volume fraction,
 $\alpha = (H_0/\Delta H + 1)^{-1}$, is measured from the increase in the liquid level after the injection of bubbles, where
 $H_0$ is the initial liquid level and
 $\Delta H$ is the liquid level increase.
Physical properties of the fluids:  $\rho$, density;
 $\sigma$, surface tension;
 $\mu$, viscosity;
 $D$, average bubble diameter;
 $U$, average bubble velocity;
 $\eta$, Kolmogorov length scale;
 $Re$, Reynolds number;
 $We$, Weber number.

3. Results and discussion
3.1. Probability density functions of the velocity fluctuations
Figure 2 shows the probability density functions (PDFs) of the horizontal and vertical velocity fluctuations within the bubble swarm normalized by the corresponding standard deviations for a bubble Reynolds number of  $Re = 6$ at a constant gas volume fraction of
 $\alpha \approx 0.010$. The PDFs of the vertical velocity fluctuations are positively skewed whereas the PDFs of the horizontal velocity fluctuations are symmetric and non-Gaussian, similar to that of the bubbly flows at high Reynolds number (Risso & Ellingsen Reference Risso and Ellingsen2002; Riboux et al. Reference Riboux, Risso and Legendre2010; Alméras et al. Reference Alméras, Mathai, Lohse and Sun2017). Here, determining the PDFs within the bubble swarm is essential as the velocity fields in the wake of the bubble swarm will be symmetric and Gaussian (Lee et al. Reference Lee, Kim, Lee and Park2021; Ma et al. Reference Ma, Hessenkemper, Lucas and Bragg2022). Though there is little to no wake for low-Reynolds-number bubbles, here the exponential tail and the positive skewness in the vertical velocity fluctuations are attributed to the large fluctuations in the vicinity of the bubbles (Riboux et al. Reference Riboux, Risso and Legendre2010; Alméras et al. Reference Alméras, Mathai, Lohse and Sun2017).
The PDFs of the liquid velocity fluctuations in (a) the horizontal and (b) vertical directions within the bubbly flows in viscous Newtonian fluid ( $Re = 6$) normalized by the standard deviation for gas volume fraction of
 $\alpha = 0.010$. The dashed line corresponds to a Gaussian profile. Here, the colour gradients, ranging from blue to red, correspond to 2 ms of measurement within the bubble swarm.

3.2. Energy spectra of the velocity fluctuations
We investigate the energy spectra of velocity fluctuations for different bubble Reynolds number at a fixed gas volume fraction. Figure 3 shows the horizontal and vertical energy spectra of velocity fluctuations normalized by the corresponding variance and bubble diameter for a family of bubble Reynolds number at a constant gas volume fraction of  $\alpha \approx 0.025$. Here, the abscissa is normalized by the wavenumber corresponding to the bubble diameter,
 $k_d = 2 {\rm \pi}/D$. As seen in figure 3, at large scales (small wavenumbers) the energy spectra of the liquid velocity fluctuations scale as
 $k^{-1}$ in agreement with Zamansky et al. (Reference Zamansky, De Bonneville and Risso2024). At intermediate scales, for Reynolds numbers
 $Re \gg O(10)$, the signature
 $k^{-3}$ scaling of the energy spectra is obtained similar to Martínez-Mercado et al. (Reference Martínez-Mercado, Palacios-Morales and Zenit2007) and Riboux et al. (Reference Riboux, Risso and Legendre2010), which also serves as a validation of our experimental method (see Appendix A). When the bubble Reynolds number
 $Re \sim O(100)$, the
 $k^{-3}$ subrange is significantly narrower compared with that when
 $Re = 626$. On further decreasing the Reynolds number, for
 $Re = 11$ and 6, the signature
 $k^{-3}$ scaling for the pseudoturbulence does not emerge. The numerical results obtained for the bubble-induced turbulence by Bunner & Tryggvason (Reference Bunner and Tryggvason2002b) for
 $Re$ between 12 and 30 indicated that energy spectra decay with a
 $k^{-3}$ scaling, which agrees with the present findings. To our knowledge, no other data for
 $Re < O(10)$ exist.
(a) Horizontal and (b) vertical spectra of the liquid velocity fluctuations normalized by the bubble diameter and the variances for a family of Reynolds numbers at a constant gas volume fraction of  $\alpha \approx 0.025$. The abscissa is normalized by the wavenumber corresponding to the bubble diameter,
 $k_d$. The solid, dashed and dot-dashed black lines correspond to the
 $k^{-3}$,
 $k^{-5/3}$ and
 $k^{-1}$ scalings, respectively.

It has been argued that the observed  $k^{-3}$ scaling is the result of the contribution from the bubble wakes (Risso Reference Risso2018). In the current study, however, for
 $O(1) < Re < O(10)$, no significant wakes behind the bubbles are expected to appear (Blanco & Magnaudet Reference Blanco and Magnaudet1995). Thus, instead of the signature
 $k^{-3}$ scaling for the pseudoturbulence, the energy spectra of velocity fluctuations induced by the low-Reynolds-number bubbles in our experiments scale as
 $k^{-5/3}$. We argue that the
 $k^{-5/3}$ scaling emerges from the small-scale disturbances generated by the bubble motion, which are strong enough to generate a large-scale flow with the same characteristics as the Kolmogorov turbulence (Mazzitelli & Lohse Reference Mazzitelli and Lohse2009). Thus, we provide the first experimental evidence that for very low-Reynolds-number bubbly flows, the energy spectra of the liquid velocity fluctuations scale as
 $k^{-5/3}$. Further, we note that at small scales (large wavenumbers) the energy spectra of the liquid velocity fluctuations for
 $O(1) < Re < O(10)$ follow an exponential decay due to the dominance of viscosity beyond the Kolmogorov microscale,
 $\eta$, as listed in table 1. The compensated energy spectra, included in Appendix B, show the emergence of
 $k^{-3}$ and
 $k^{-5/3}$ more clearly at different length scales.
Further, Riboux et al. (Reference Riboux, Risso and Legendre2010) suggested that the  $k^{-3}$ scaling observed in the pseudoturbulence does not depend on the bubble diameter and gas volume fraction for a wide range of Reynolds numbers. We show that this is not the case at small Reynolds number. Figure 4(a) shows the horizontal spectra of liquid velocity fluctuations normalized by the bubble diameter and the variance for a family of gas volume fractions at
 $Re = 114$. It is to be noted that at very low gas volume fractions, though the bubbles have significant wake, the energy spectra do not show the
 $k^{-3}$ scaling. However, as the gas volume fraction increases, the
 $k^{-3}$ scaling emerges. Note that this
 $k^{-3}$ subrange is significantly narrower. This is because as the number of bubbles (i.e the gas volume fraction) increases the average distance between the bubbles decreases, thus leading to wake interactions. This is further corroborated using spatial correlation in the next section. Whereas, for
 $Re = 11$ as seen in figure 4(b), the
 $k^{-3}$ scaling is not observed; instead the
 $k^{-5/3}$ scaling is obtained. This is in agreement with the results from Mazzitelli et al. (Reference Mazzitelli, Lohse and Toschi2003) that the slope of the energy spectra no longer shows the signature
 $k^{-3}$ scaling for the pseudoturbulence and that the slope of the energy spectra depends on the number of bubbles and therefore is non-universal.
Horizontal spectra of the liquid velocity fluctuations normalized by the bubble diameter and the variances for a family of gas volume fractions at (a)  $Re = 114$ and (b)
 $Re = 11$. The abscissa is normalized by the wavenumber corresponding to the bubble diameter,
 $k_d$. The solid, dashed and dot-dashed black lines correspond to the
 $k^{-3}$,
 $k^{-5/3}$ and
 $k^{-1}$ scalings, respectively.

3.3. Structure functions
To demonstrate that at low Reynolds numbers the energy spectra of the bubbly flows exhibit a  $k^{-5/3}$ scaling, we consider the second-order longitudinal velocity structure function across a length scale
 $r$ defined as
 \begin{equation} S_2(r) = \langle {[u_x\!\boldsymbol{(x+r) -} u_x\boldsymbol{(x)}]\boldsymbol{\cdot}(\boldsymbol{r}/r)}^2 \rangle. \end{equation}
Here  $\langle \rangle$ denotes the spatial average. For homogeneous and isotropic turbulence in an incompressible Newtonian fluid, it is known that if the second-order velocity structure function scales as
 $S_2(r) \sim r^\beta$, then the corresponding energy spectra should scale as
 $E(k) \sim k^{-(\beta +1)}$ (Frisch Reference Frisch1995). For classical Kolmogorov turbulence, the second-order velocity structure function scales as
 $S_2(r) \sim r^{2/3}$ in the inertial range and as
 $S_2(r) \sim r^{2}$ in the dissipative range. Figure 5 shows the normalized second-order velocity structure function observed in the wake of the bubble swarm as a function of normalized length scale
 $r$, across a range of Reynolds numbers for a constant gas volume fraction of
 $\alpha \approx 0.025$. For all experiments, when the normalized length scale
 $r/D < 0.25$ (dissipative range), the structure function scales as
 $S_2(r) \sim r^{2}$. In the inertial range, because of the bubble wake–wake interactions, instead of the
 $S_2(r) \sim r^{2/3}$ scaling, the second-order structure function scales as
 $S_2(r) \sim r^2$ for
 $Re \gg O(100)$ (Ma et al. Reference Ma, Hessenkemper, Lucas and Bragg2022). At Reynolds numbers
 $Re \sim O(100)$, for length scales smaller than the bubble diameter (
 $r/D < 1$), the structure function scales as
 $S_2(r) \sim r^{2/3}$. Whereas, for length scales larger than the bubble diameter (
 $r/D > 1$), the structure function scales as
 $S_2(r) \sim r^2$. This highlights that the
 $k^{-3}$ scaling in the energy spectra can be recovered for bubbles with sufficiently large wakes (i.e.
 $Re = 144$ and
 $Re = 87$). On further decreasing the Reynolds number to
 $Re \sim O(10)$, the structure function follows
 $S_2(r) \sim r^{2/3}$ for length scales larger than that of the dissipative range and thus the corresponding energy spectra of the velocity fluctuations for low-Reynolds-number bubbly flows scale as
 $E(k) \sim k^{-5/3}$, as shown in figure 3.
The normalized second-order structure function  $S_2(r)$ as a function of normalized length scale
 $r$ for a family of Reynolds numbers at a constant gas volume fraction of
 $\alpha \approx 0.025$. The solid and dashed lines correspond to
 $r^{2}$ and
 $r^{2/3}$ scalings, respectively.

3.4. Spatial correlation
To further understand why the slope of the energy spectra depends on the gas volume fraction for low to moderate Reynolds number, the spatial correlation of the horizontal velocity fields is considered. The spatial correlation of the horizontal velocity,  ${u}_x$, is defined as
 \begin{equation} {\bar{R}}_{xx} = \frac{\langle {u}_x(\boldsymbol{x}) \boldsymbol{\cdot} {u}_x(\boldsymbol{x + r})\rangle}{\langle u^2_x \rangle}. \end{equation}
Here  $\langle \rangle$ represents the average in space. Figure 6(a) shows the spatial correlation of the horizontal velocity behind the bubble swarm at a constant gas volume fraction of
 $\alpha \approx 0.025$. It is evident that as
 $Re$ decreases from 626 to 144 and to 87, we observe a higher correlation over longer distances. This may be because the size of the bubble decreases as fluid viscosity increases (see table 1). Therefore, more bubbles are needed to reach a fixed gas volume fraction (say
 $\alpha \approx 0.025$). This longer correlation with the decrease in the Reynolds number is in agreement with the numerical results from Esmaeeli & Tryggvason (Reference Esmaeeli and Tryggvason1996), who showed that there is an emergence of flow structures many times larger than the bubble size, which is also observed in particle suspensions at finite Reynolds numbers (Climent & Maxey Reference Climent and Maxey2003). However, on further decreasing the Reynolds number (
 $Re = 11$ and 6), the velocity is decorrelated quickly as seen in figure 6(a). This agrees with previous literature (Lance & Bataille Reference Lance and Bataille1991; Mazzitelli et al. Reference Mazzitelli, Lohse and Toschi2003; Riboux et al. Reference Riboux, Risso and Legendre2010; Risso Reference Risso2018) in that the presence of a wake is essential for the signature
 $k^{-3}$ scaling to emerge as seen in figure 3. Figure 6(b) shows the spatial correlation of the horizontal velocity observed behind the bubble swarm for a family of gas volume fractions at
 $Re = 114$. It is immediately evident that as the gas volume fraction increases, the horizontal velocity is correlated over a longer distance, thus agreeing with our results for the energy spectra, as seen in figure 4(a), depending on the number of bubbles. However, as seen in figure 6(c), when
 $Re = 11$, even with higher gas volume fraction, the horizontal velocity is quickly decorrelated beyond one bubble radius.
Spatial correlation of the horizontal velocity observed in the wake of the bubble swarm (a) at a constant gas volume fraction of  $\alpha \approx 0.025$ for a family of Reynolds numbers. Spatial correlation of the horizontal velocity for a family of gas volume fractions (mentioned in figure 4) at (b)
 $Re = 114$ and (c)
 $Re = 11$.

4. Conclusions
The bubbly flow properties in viscous Newtonian fluids have been studied experimentally by varying the concentration of glycerin in a water mixture. The PIV technique was used to visualize the wake behind the bubble swarm to determine the velocity fluctuations in the decaying agitations. We demonstrated experimentally that the signature  $k^{-3}$ scaling of the pseudoturbulence is replaced by
 $k^{-5/3}$ scaling for the energy spectra of velocity fluctuations induced by low-Reynolds-number bubbles. We showed that as the Reynolds number decreases to
 $Re \sim O(100)$, the
 $k^{-3}$ subrange becomes significantly narrower. Further, for low-Reynolds-number bubbly flows the slope of the energy spectra depends on the number of bubbles in the flow.
These experimental results agree with the numerical results of Mazzitelli et al. (Reference Mazzitelli, Lohse and Toschi2003) in that the energy spectra are non-universal for bubbles with  $O(1) < Re < O(10)$. To understand why the slope of the energy spectra depends on the gas volume fraction, the spatial correlation of the velocity field was considered. For a constant gas volume fraction, with
 $O(10) < Re < O(100)$, a higher correlation over longer distances was observed in agreement with the results from Esmaeeli & Tryggvason (Reference Esmaeeli and Tryggvason1996). As the bubble size decreases with Reynolds number, more bubbles (i.e. higher gas volume fraction) are required to maintain the same gas volume fraction. Thus, as the distance among bubbles decreases, the wake interactions are more pronounced. Whereas for
 $O(1) < Re < O(10)$ the velocity quickly decorrelates beyond the bubble radius, and thus the signature
 $k^{-3}$ scaling for the bubble-induced turbulence does not emerge.
Acknowledgements
M.R. and R.Z. thank Professor M. Maxey, Professor F. Risso, Professor D. Legendre and Professor V. Mathai for crucial insights and stimulating discussions.
Declaration of interests
The authors report no conflict of interest.
Appendix A. Comparison with the experiments of Riboux et al. (Reference Riboux, Risso and Legendre2010)
In figure 7, we compare our measurement technique with that of Riboux et al. (Reference Riboux, Risso and Legendre2010). The grey lines correspond to the energy spectra of the vertical liquid velocity fluctuations for each column of the velocity field obtained from the PIV measurement. The average of all these vertical energy spectra is shown as a solid red line. Here, we compare our result with that obtained by Riboux et al. (Reference Riboux, Risso and Legendre2010) at  $Re = 670$ and gas volume fraction
 $\alpha \approx 0.046$ (solid black line with symbols). Further, we clearly identify the
 $k^{-1}$ scaling at large scales (dot-dashed black line),
 $k^{-3}$ scaling at intermediate scales (solid black line) and
 $k^{-5/3}$ scaling at small scales (dashed black line) in accordance with Zamansky et al. (Reference Zamansky, De Bonneville and Risso2024).
Vertical spectra for each vertical column of the liquid velocity fluctuations at  $Re = 626$ and gas volume fraction
 $\alpha \approx 0.0025$ are shown by the grey lines. The solid red line corresponds to the average energy spectra of the vertical velocity fluctuations. The abscissa is normalized by the wavenumber corresponding to the bubble diameter,
 $k_d$. Solid black line with symbols corresponds to the spectrum obtained from experiments by Riboux et al. (Reference Riboux, Risso and Legendre2010) at
 $Re = 670$ and gas volume fraction
 $\alpha \approx 0.0046$.

Appendix B. Compensated energy spectra of velocity fluctuations
In figure 8, we plot the compensated spectra of the horizontal and vertical liquid velocity fluctuations showing the emergence of the  $k^{-3}$ scaling for a range of Reynolds numbers at a constant gas volume fraction of
 $\alpha \approx 0.025$. Here, the abscissa is normalized by the wavenumber corresponding to the Kolmogorov length scale,
 $k_\eta = 2 {\rm \pi}/\eta$. It is evident that the compensated energy spectra show the emergence of
 $k^{-3}$ scaling when
 $Re \gg O(10)$. Whereas, when
 $Re \sim O(10)$, the energy spectra of the liquid velocity fluctuations show a
 $k^{-5/3}$ scaling as seen from figure 9. Note that for
 $Re \gg O(10)$, the
 $k^{-5/3}$ scaling is recovered for wavenumbers greater than that of the bubble diameter.
Compensated energy spectra of the (a) horizontal and (b) vertical liquid velocity fluctuations showing the emergence of  $k^{-3}$ scaling for a family of Reynolds numbers at a constant gas volume fraction of
 $\alpha \approx 0.025$. The solid line denotes the
 $k^{-3}$ scaling.

Compensated energy spectra of the (a) horizontal and (b) vertical liquid velocity fluctuations showing the emergence of  $k^{-5/3}$ scaling for a family of Reynolds numbers at a constant gas volume fraction of
 $\alpha \approx 0.025$. The dashed line denotes the
 $k^{-5/3}$ scaling.


 Open access

