Implications
The fractional rate of degradation (FRD) of LE0 model generally had high correlation with gas production at 2, 4, 6 and 8 h across all four subsets tested, and thus provides a good alternative to reveal the rate of early stage in vitro fermentation. The FRD of LE0 model would have an implication in quantifying the rate of fermentation and evaluating digestion efficiency of feedstuffs in the rumen, as ruminal retention time of feedstuffs is short. However, further studies are needed to testify whether a higher FRD leads to a higher nutritive value (e.g. volatile fatty acid profile, microbial protein synthesis and feedstuff digestibility) for ruminants.
Introduction
The in vitro gas production technique has been widely accepted as a tool for feedstuff and feed additive evaluation. Gas production at early stage incubation is mainly caused by fermentation of water-soluble components in feedstuffs, including sugars, pectin and CP components (Cone et al., Reference Cone, Van Gelder and Driehuis1997; Cone and van Gelder, Reference Cone and van Gelder1999). Some feed additives and supplements can affect the early stage in vitro fermentation of feedstuffs (Colombatto et al., Reference Colombatto, Mould, Bhat, Morgavi, Beauchemin and Owen2003; Jalilvand et al., Reference Jalilvand, Odongo, Lopez, Naserian, Valizadeh, Shahrodi, Kebreab and France2008). Furthermore, the rate of fermentation measured at early stages of in vitro incubations (i.e. <12 h) might be an indicator of the efficiency at which feedstuffs are used in vivo and play a potential role of the degradable feed in the development of acidosis, because the retention time of liquid and particles in the rumen of Holstein non-lactating cows is <14 and 22 h, respectively (Oshita et al., Reference Oshita, Sudo, Nonaka and Ochiai2008). So, compared characterization of the early fermentation is important for the evaluation of feedstuffs using in vitro gas production systems.
Fractional rate of degradation (FRD) is defined as the rate of degradation (RD) divided by the weight of degradable substrate and changes with the alteration of hydration of particle, microbial attachment and microbial numbers (France et al., Reference France, Dhanoa, Theodorou, Lister, Davies and Isac1993 and Reference France, Dijkstra, Dhanoa, Lpez and Bannink2000). So, comparing with the RD, the FRD is not related to degradable substrate weight for different incubated feedstuffs. Many studies indicate that FRD is an important component for rate parameter systems and permits to calculate the extent of ruminal degradation (France et al., Reference France, Dijkstra, Dhanoa, Lpez and Bannink2000 and Reference France, López, Kebreab, Bannink, Dhanoa and Dijkstra2005). A rate parameter system also includes half-life and time to reach 90% or 95% of total gas production (Murray et al., Reference Murray, Longland and Moore-Colyer2006 and Reference Murray, Longland and Dunnett2008). A higher FRD may indicate faster in vitro fermentation, which means a greater gas volume production after a certain incubation time. However, FRD of different models have different mathematical expressions, thereby leading to the inconsistent abilities to represent the rate of in vitro fermentation. Few studies have been conducted to systematically investigate the FRD of different models for the in vitro fermentation.
The first objective of this study was to develop biologically meaningful equations to predict FRD for in vitro fermentation, derived from a previously developed LE0 model (Wang et al., Reference Wang, Tang and Tan2011). The second objective was to explore an appropriate form of FRD, which quantified the in vitro fermentation process at an early stage of incubation. Four models including the Exponential model with a discrete LAG (EXPLAG), LE0, generalization of the Mitscherlich (GM) and c th order Michaelis–Menten (MM) were compared.
Material and methods
Logistic-exponential (LE) model
Wang et al. (Reference Wang, Tang and Tan2011) proposed that the rate of gas production (dV/dt, ml/h) of the LE model is expressed as
 $${\rm{d}}V/{\rm{d}}t\: = \:cV(1{\rm{ - }}V/{{V}_{\rm{F}}})/{{V}_{\rm{F}}}\: + \:cd(1{\rm{ - }}V/{{V}_{\rm{F}}})$$
where c is proportional to V F2 with dimension of ml/h; d is a positive shape parameter without dimension; and V F is the final asymptotic gas volume (ml).
The LE model with initial gas volume being zero (LE0) is obtained by solving equation (1) and can be expressed as
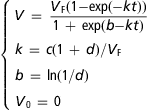 $${\left\{ {\matrix { V \: = \:\displaystyle \frac{{{{V}_{\rm{F}}}(1{\rm{ - exp}}({\rm{ - }}kt))}}{{1\: + \:{\rm{exp}}(b{\rm{ - }}kt)}} \cr \!\!\!\!\!\!\!\!\!\! k \: = \:c(1\: + \:d)/{{V}_{\rm{F}}} \cr \!\!\!\!\!\!\!\!\!\!\!\!\!\!\!\!\!\!\!\!\!\!\!\!b\: = \:{\rm{ln}}(1/d) \cr \!\!\!\!\!\!\!\!\!\!\!\!\!\!\!\!\!\!\!\!\!\!\!\!\!\!\!\!\!\!\!\!\!\!\!\!{{V}_0}\: = \:0 \right$$
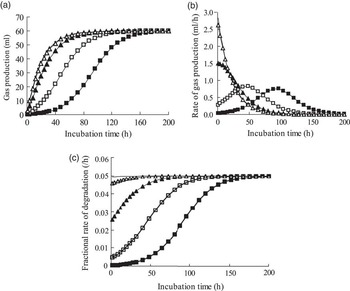
where k is fractional rate of gas production (FRG) at particular time (1/h), V 0 is the initial gas volume at t-value = 0 (ml) and leads to V 0/V F-value = 0. The LE0 model showed a wide range of curve shapes (Figure 1).
Behavior of Logistic-Exponential (LE) model with initial gas volume being zero (LE0), stimulated for different values of shape parameter (b). The final asymptotic gas volume (V F) and fractional rate of gas production (k) were set to 60 ml and 0.05/h over the range of d being 0.01 to 100, respectively.  $$$$, b = 4.6;
 $$$$, b = 2.3;
 $$$$b = 0;
 $$$$, b = −2.3;
 $$$$, b = −4.6.

Gas production data
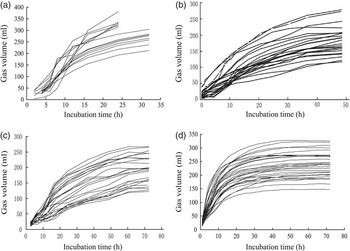
A total of 94 in vitro gas production curves (Figure 2) were used to evaluate the relationship between FRD and initial fermentation processes. The curves belong to four subsets originating from different laboratories and with different lengths of incubation. The chemical composition of the substrates from the four subsets is summarized in Table 1.
The 94 in vitro gas production curves. (a) subset 1 (n = 14); (b) subset 2 (n = 23); (c) subset 3 (n = 24); and (d) subset 4 (n = 33).

Chemical composition of feedstuffs (g/kg DM)Footnote *

DM = dry matter; OM = organic matter; nd = not determined.
Data were expressed as ‘means ± s.d.’.
* The NDF was assayed without using sodium sulphite and heat stable amylase in subsets 2 and 3, and assayed with a heat stable amylase in subset 4; the NDF and ADF were expressed inclusive of residual ash in subsets 2, 3 and 4.
Subset 1 (n = 14, Figure 2a) includes six 24 h in vitro gas production curves (i.e. 2, 4, 6, 8, 12, 16 and 24 h) from starchy feed ingredients (i.e. potato, pea, barley, wheat feed flour, wheat and maize), and eight 32 h in vitro gas production curves (i.e. 4, 6, 8, 12, 16, 24 and 32 h) from maize silages (Chai et al., Reference Chai, Van Gelder and Cone2004). Subset 2 (n = 23, Figure 2b) consists of 48 h in vitro gas production curves (i.e. 0.5, 1, 1.5, 2, 4, 6, 8, 10, 12, 16, 20, 24, 30, 36 and 48 h) from grasses, silages, hays and straws to represent a wide range of feedstuffs (Tang et al., Reference Tang, Jiang, Zhou and Tan2005, Reference Tang, Tan, Zhou, Jiang, Jiang and Sheng2006 and Reference Tang, Tayo, Tan, Sun, Wang, Ren and Han2008). Subset 3 (n = 24, Figure 2c) consists of 72 h (i.e. 2, 4, 6, 8, 10, 12, 16, 20, 24, 30, 36, 48 and 72 h) in vitro gas production curves from (a) six hybrid Napier grasses ((Pennisetum purpureum × Pennisetum americanum) ×P. purpureum cv. Mott) harvested monthly from May to October 2007; and (b) eighteen broadleaf paspalum (Paspalum atratum cv. Reyan 11) collected at four clipping heights with a regrowth period of 30 days from July to October (n = 16) and in May and June (n = 2) in 2007. The samples of subset 3 were collected at the Experimental Station of Karst Agro-ecosystem in Huanjiang, Guangxi province, China. Subset 4 (n = 33, Figure 2d) contains 72 h in vitro gas production curves (i.e. every 1 min) from six cultivars of perennial ryegrass (Lolium perenne) and forage chicory (Cichorius intybus), harvested in summer and autumn at Grasslands and Aorangi Experimental stations of AgResearch Limited (Palmerston North, New Zealand), which were minced freshly or ground after freeze-drying before incubation (n = 28). The remaining five samples were herbs (Achillea millefolium, Ornithopus sativus, Sanguisorba minor and Plantago lanceolata) and willow tree leaves (Salix alba).
For subset 1, 500 mg dry matter (DM) of each substrate was weighed into 250 ml bottles, and then filled with 20 ml of rumen fluid from two non-lactating fistulated cows 2 h after the morning feeding, and 40 ml of anaerobic buffer/mineral solution, followed by incubation in a fully automated system (Chai et al., Reference Chai, Van Gelder and Cone2004). For subsets 2 and 3, 200 mg DM of each oven-dried feedstuff was weighed into 100 ml glass syringes fitted with plunger, and then filled with 10 ml rumen fluid from two fistulated Liuyang black goats before the morning feeding, and 20 ml McDougall's buffer, followed by manual collection of gas production data as described by Tang et al. (Reference Tang, Jiang, Zhou and Tan2005, Reference Tang, Tan, Zhou, Jiang, Jiang and Sheng2006 and Reference Tang, Tayo, Tan, Sun, Wang, Ren and Han2008). For subset 4, 600 mg DM from each substrate was weighed into 120 ml glass bottles, then filled with 12 ml rumen fluid from two non-lactating fistulated Friesian × Jersey cows maintained on a pasture diet, and 48 ml McDougall's buffer, followed by incubation in a fully automated gas production system as described by Sun et al. (Reference Sun, Hoskin, Muetzel, Molano and Clark2011) and Muetzel et al. (Reference Muetzel, Hunt and Tavendale2011). The excess gas was automatically released, when the pressure in any bottle exceeded 9 kPa.
Curve fitting
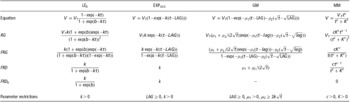
The LE0 (Wang et al., Reference Wang, Tang and Tan2011), the EXPLAG (Schofield et al., Reference Schofield, Pitt and Pell1994), the GM (France et al., Reference France, Dhanoa, Theodorou, Lister, Davies and Isac1993) and the MM (Groot et al., Reference Groot, Cone, Williams, Debersaques and Lantinga1996) models were compared for their ability in revealing fermentation processes from the gas production curve (Table 2 and Figure 3). The NLREG version 5.4 software (Sherrod, Reference Sherrod1995) was used to calculate fermentation parameters with the four models tested.
Description of models

LE0 = Logistic-Exponential model with initial gas volume being zero; EXPLAG = exponential model with a discrete LAG; GM = Generalization of the Mitscherlich model; MM = c th order Michaelis–Menten model; V F = final asymptotic gas volume; k = fractional rate of gas production at particular time; b and c, shape parameters; LAG = discrete LAG time; μ 1 and μ 2 = the rate constant; K = the time at V F/2; RG = rate of gas production; FRG = fractional rate of gas production; FRD = fractional rate of degradation; FRD 0 = initial fractional rate of degradation at t-value = 0.
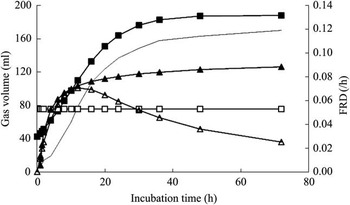
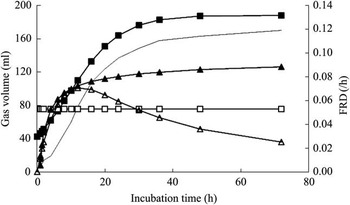
Behavior of the fractional rate of degradation (FRD) of LE0 ( $$$$), EXPLAG (
 $$$$), GM (
 $$$$) and MM (
 $$$$) derived from the gas production curve (Solid line,
 $$$$). The gas curve was derived from fermentation of a hybrid Napier grass in subset 3. LE0 = Logistic-Exponential model with initial gas volume being zero; EXPLAG = Exponential model with a discrete LAG; GM = Generalization of the Mitscherlich model; MM = c th order Michaelis–Menten model.
Results
Deriving FRD from the LE0 model
Gas production is related directly to the amount of degradable substrate (S), and a fixed constant (β) was set to link the produced gas volume and degraded substrate (Wang et al., Reference Wang, Tang and Tan2011). The gas volume generated by the degraded substrate was expressed as
 $${\left\{ {\matrix{ \displaystyle \frac{{{\rm{d}}V}}{{{\rm{d}}t}}\: = \:{\rm{ - }}\beta \frac{{{\rm{d}}S}}{{{\rm{d}}t}} \cr \!V \: = \:{{V}_{\rm{F}}}{\rm{ - }}\beta S \cr \!\!\!\!\!\!\!\!{{V}_{\rm{F}}}\: = \:\beta {{S}_{\rm{0}}} \right$$
where S 0 is potentially degradable substrate (g) and dS/dt is RD. The RD was obtained by combining equations (1) and (3), and expressed as
 $$\frac{{{\rm{d}}S}}{{{\rm{d}}t}}\: = \:{\rm{ - }}\frac{k}{{(1\: + \:d){{S}_0}}}S({{S}_0}(1\: + \:d){\rm{ - }}S)$$
The equation for S was obtained by combining equations (2) and (3), and expressed as
 $$ S\: = \:\frac{{{{S}_0}(1\: + \:{\rm{exp}}({\rm{b}}))}}{{{\rm{exp}}(kt)\: + \:{\rm{exp}}({\rm{b}})}}$$
Equation (5) indicates that degradable substrate decreases continuously during incubation. The first derivative of equation (5), representing the RD, was expressed as
 $$\frac{{{\rm{d}}S}}{{{\rm{d}}t}}\: = \:{\rm{ - }}\frac{{{{S}_0}k(1\: + \:{\rm{exp}}({\rm{b}})){\rm{exp}}(kt)}}{{{{{({\rm{exp}}(kt)\: + \:{\rm{exp}}(b))}}^2} }}$$
The mathematical form of FRD was defined by the equation −(dS/dt)/S by France et al. (Reference France, Dijkstra, Dhanoa, Lpez and Bannink2000), calculated as the negative ratio value of equations (6) and (5), and then expressed as
 $$ FRD\: = \:\frac{k}{{1\: + \:{\rm{exp}}(b{\rm{ - }}kt)}}$$
Equation (7) indicates that the FRD continuously increases with advancing incubation time, and exhibits sigmoidal and non-sigmoidal curves for b-value > 0 and b-value < 0, respectively (Figure 1c). The variation of FRD with advancing incubation time is lower when b decreases (Figure 1c), and FRD-value = k is obtained at b-value → −∞. The initial (FRD 0) and final asymptotic (FRD F) values were obtained by substituting t-value = 0 and t-value → +∞ in equation (7), respectively, and expressed as
 $$ FR{{D}_0}\: = \:\frac{k}{{1\: + \:{\rm{exp}}(b)}}$$
 $$ FR{{D}_{\rm{F}}}\: = \:k$$
The half-life (t 0.5) represents the time at which half of the final gas production is generated, and it was obtained by substituting S by S 0/2 in equation (5), and expressed as
 $${{ t}_{0.5}}\: = \:\frac{{{\rm{ln}}(2\: + \:{\rm{exp}}(b))}}{k}$$
The FRD at half-life ( $$$FR{{D}_{{{t}_{0.5}}}} $$$) was obtained by substituting t by t 0.5 in equation (7), and expressed as
 $$ FR{{D}_{{{t}_{0.5}}}}\: = \:\frac{{k(1\: + \:0.5{\rm{exp}}(b))}}{{1\: + \:{\rm{exp}}(b)}}$$
As the degradable feed is subjected to both passage and degradation in the rumen, the extent of degradation in the rumen (E) follows the classic equation (France et al., Reference France, López, Kebreab, Bannink, Dhanoa and Dijkstra2005)
 $${\left\{ {\matrix{E\: = \:\displaystyle\frac{{{{k}_{\rm{p}}}{{S}_0}}}{{{{S}_0}\: + \:{{U}_0}}}{\int}_{\!\!\!\!0}^{{ + \infty }} {{{\phi }_{(t)}}{\rm{exp}}({\rm{ - }}{{k}_{\rm{p}}}t)} {\rm{d}}t \cr \!\!\!\!\!\!\!\!\!\!\!\!\!\!\!\!\!\!\!\!\!\!\!\!\!\!\!\!\!\!\!\!\!\!\!\!\!\!\!\!\!\!\!\!\!\!\!\!\!\!\!\!\!{{\phi }_{(t)}}\: = \:1{\rm{ - }}S/{{S}_0}$$
where k p is the constant rate of ruminal passage h−1, U 0 is the undegradable substrate (g), φ (t ) is a positive, continuously increasing function in the range 0 to 1 with initial value φ 0-value = 0 and an asymptote φ+ ∞-value = 1. The solution of equation (12) is attained by combining equation (5), and expressed as
 $$E\: = \:\frac{{{{k}_{\rm{p}}}{{S}_0}}}{{{{S}_0}\: + \:{{U}_0}}}{\int}_{\!\!\!\!0}^{{ + \infty }} {\frac{{(1{\rm{ - exp}}({\rm{ - }}kt)){\rm{exp}}({\rm{ - }}{{k}_{\rm{p}}}t)}}{{1\: + \:{\rm{exp}}(b{\rm{ - }}kt)}}} {\rm{d}}t$$
This integral is non-analytical and has to be evaluated numerically. However, the equation (13) was not evaluated owing to unavailability of substrate residue data in some subsets.
Statistical model
The FRD is a constant for the EXPLAG model and is equal to its FRG (k). The FRD for the LE0, GM and MM models varies with incubation time, and was calculated by the equations listed in Table 2. The discrete lag time, the needed time for ruminal microorganisms to adapt to degrade substrate in the buffered rumen fluid, was excluded for LE0 and MM models on the basis of two reasons. For an automatic system, an Excel macro was used to search the time of starting gas production with the constraint of pressure exceeding zero, so that a discrete lag time is unnecessary for sigmoidal models. For a syringe system, our previous study indicated that models without a discrete lag time were good enough to model the curves (Wang et al., Reference Wang, Tang and Tan2011). The discrete lag time was added for exponential model, because incorporating a discrete lag time increases its ability in modelling sigmoidal curves (Dhanoa et al., Reference Dhanoa, López, Dijkstra, Davies, Sanderson, Williams, Sileshi and France2000).
The early fermentation processes were defined by the gas volume at incubation times <12 h. However, incubation times of up to 24 h were investigated to expand our knowledge of relationships between FRD and fermentation processes.
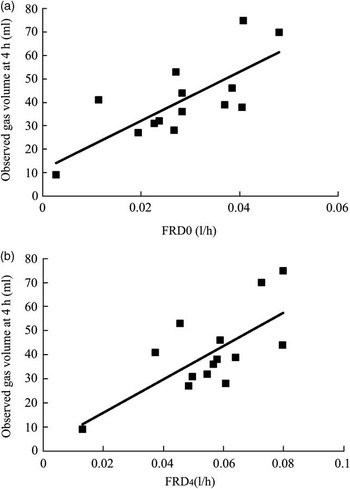
The linear relationships between FRD and gas production at six incubation points (i.e. 2, 4, 6, 8, 12 and 24 h) were explored for the four models. As the gas data were derived from quite different conditions of substrate, amount of substrate, incubation system and incubation duration, the four subsets were analyzed separately to ensure that the differences among each subset only come from different substrates. The initial FRD (FRD 0) and FRD at 4 h (FRD 4) were calculated by substituting t-value = 0 and t-value = 4 to equation (4), respectively. Figure 4a and b showed for subset 1 the relationship between gas production at 4 h at one side and FRD 0 and FRD 4, respectively, at the other. The relationships between FRD 0 and the gas production at the six incubation times were solely explored for the LE0 model, because the FRD 0 is zero for the MM model, equal to k for EXPLAG model and does not exist for the GM model.
Linear regression between fractional rate of degradation (FRD) and observed gas volume at 4 h of subset 1. (a) FRD 0, initial FRD of Logistic-Exponential (LE) model with initial gas volume being zero (LE0) model; (b) FRD 4, FRD of LE0 model at 4 h.

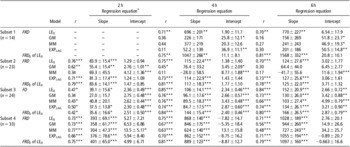
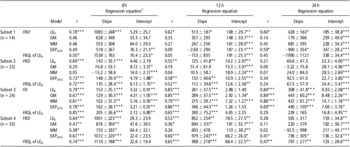
The best linear regression between the FRD and gas production was derived using ordinary least squares (OLS), and performed using SPSS 12.0 software (Chicago, IL, USA). As a result, the Pearson Correlation (r), statistical significance and regression equations were obtained by regression reports of SPSS 12.0 software and provided in Tables 3 and 4.
Correlation r, slope and intercept of linear regressions between fractional rate of degradation and gas production at 2, 4 and 6 h

FRD = fractional rate of degradation at particular incubation time; LE0 = Logistic-Exponential model with initial gas volume being zero; GM = Generalization of the Mitscherlich model; MM = c th order Michaelis–Menten model; EXPLAG = Exponential model with a discrete LAG; FRD 0 = initial fractional rate of degradation at t-value = 0; – = data not provided.
♯Regression equations are expressed by the estimated value ± s.e.
*P < 0.05; **P < 0.01; ***P < 0.001.
Correlation r, slope and intercept of linear regressions between fractional rate of degradation and gas production at 8, 12 and 24 h

FRD = fractional rate of degradation at particular incubation time; LE0 = Logistic-Exponential model with initial gas volume being zero; GM = Generalization of the Mitscherlich model; MM = c th order Michaelis–Menten model; EXPLAG = Exponential model with a discrete LAG; FRD 0 = initial fractional rate of degradation at t-value = 0; – = data not provided.
♯Regression equations are expressed by the estimated value ± s.e.
*P < 0.05; **P < 0.01; ***P < 0.001.
Correlation between FRD and gas production
For subset 1, the FRD of LE0 model (r > 0.622, P < 0.05) correlated stronger with gas production at 4, 6, 8 and 12 h than the GM (r < 0.462), MM (r < 0.460) and EXPLAG (r < 0.487) models, and exhibited the positive slope of linear regression (Tables 3 and 4). Gas production at 2 h was not available for some substrates (Chai et al., Reference Chai, Van Gelder and Cone2004), and was therefore not investigated. Compared with FRD of the LE0 model, the FRD 0 of the LE0 model had positive slope, smaller intercept and correlated stronger with gas production at 4 (r = 0.707 v. 0.751) and 6 h (r = 0.699 v. 0.806).
For subset 2, the FRD of the LE0 model (r > 0.545, P < 0.01) had positive slope, smaller intercept and correlated stronger with gas production at 2, 4, 6, 8 and 12 h than that of the GM (r < 0.617) and MM (r < 0.337) models (Tables 3 and 4). Intercept and correlations between FRD and gas production at 2, 4, 6, 8 and 12 h were close for LE0 and EXPLAG (r > 0.581, P < 0.01) models. For the LE0 model, in comparison with FRD, the FRD 0 had positive slope and correlated stronger (r > 71.8) with gas production at 2, 4, 6 and 8 h and had a larger intercept.
For subset 3, good correlations (P < 0.005) between FRD and gas production at 4, 6, 8 and 12 h were observed for LE0 (r > 0.791), GM (r > 0.673), MM (r > 0.611) and EXPLAG (r > 0.738) models, and exhibited the positive slope of linear regression (Tables 3 and 4). The FRD 0 and FRD of LE0 model both correlated closely (P < 0.001) with gas production at 2, 4, 6, and 8 h (average r = 0.737 v. 0.730).
For subset 4, FRD of the LE0, GM, MM and EXPLAG models correlated (P < 0.001) with gas production at 2, 4 and 6 h and exhibited the positive slope of linear regression, whereas the strength of the correlations decreased markedly at 8, 12 and 24 h for GM and MM models (Tables 3 and 4). In general, the LE0 model had numerically stronger correlation (r > 0.528) than the GM (r > 0.363) and MM (r > 0.258) models at 2, 4, 6, 8 and 12 h. For the LE0 model, the FRD 0 correlated stronger (r > 0.648) with gas production at 2, 4, 6, 8 and 12 h than the FRD (r > 0.528).
Discussion
Gas production and substrate degradation
The shape parameter d affects the rate of gas production (Wang et al., Reference Wang, Tang and Tan2011). Parameter b is a natural logarithm-transformed value of 1/d, which behaves in an inverse fashion to d. The b-value < 0 expresses curves with non-sigmoidal shapes, and the rate of gas production decreases continuously (Figure 1a and b). The b-value > 0 expresses curves with sigmoidal shapes, and the rate of gas production initially increases, reaches a maximum rate and finally decreases (Figure 1a and b). Lower b-values leads to a greater rate of gas production at t-value = 0 (Figure 1b), and thus gives lower time needed to reach a certain gas volume (Figure 1a). Curve shapes showed a wider variation for b-value > 0 than for b-value < 0. Furthermore, the variation of curve shapes was smaller for b-value < −2.3 than within the range from −2.3 to 0. For example, the curve shape of gas production was close for b-value −2.3 and −4.6 (Figure 1c).
The FRD is an important indicator for the substrate degradation and of the rate of fermentation. The FRD of the LE0 model increases asymptotically with incubation time to reach FRD F, with either sigmoidal or non-sigmoidal curve shapes (Figure 1c). The FRD F is obtained at t-value → +∞, and equal to the parameter k (i.e. FRD F = k). Lower b-values increase the FRD 0, leading to a smaller gap between the FRD 0 and FRD F, such as b-value < −4.6 (Figure 1c). In this case, the FRD 0 can be an important starting value of FRD to represent the rate of fermentation at early incubation stage. It could be concluded that the FRD of LE0 model increases continuously with longer incubation time, and thereby has different characteristics from that of other models. The MM and GM models both might not increase continuously with longer incubation time and have different characteristics from other models. For the MM model (Groot et al., Reference Groot, Cone, Williams, Debersaques and Lantinga1996), the FRD increases initially to a maximum value and decreases or continuously decreases till the minimum FRD, depending on the shape parameter. For the GM model (France et al., Reference France, Dijkstra, Dhanoa, Lpez and Bannink2000), the FRD can be constant, can decrease or increase asymptotically with time, depending on the rate constant. It is impossible for the GM model to have a FRD at t-value = 0, when rate constant is not zero. Therefore, there are large differences in the FRD among the LE0, MM and GM models (Figure 3), resulting from different underlying assumptions included in the models. The LE0, MM and GM models are developed on the basis of the conception of microbial growth and substrate degradation (Wang et al., Reference Wang, Tang and Tan2011), enzyme reactions (Groot et al., Reference Groot, Cone, Williams, Debersaques and Lantinga1996) and substrate surface and complete invasion by microbes (France et al., Reference France, Dhanoa, Theodorou, Lister, Davies and Isac1993), respectively.
It is widely accepted that FRG and the FRD are different concepts (Dijkstra et al., Reference Dijkstra, Kebreab, Bannink, France and López2005; López et al., Reference López, Dhanoa, Dijkstra, Bannink, Kebreab and France2007). The FRG is calculated using equation (dV/dt)/V, whereas the FRD is calculated using equation −(dS/dt)/S. The equations of FRG and FRD of four models were provided in Table 2. Any changes of FRG and the FRD are because of the extra force, driven by the alteration of hydration of particle, microbial attachment and microbial numbers during the incubation (France et al., Reference France, Dhanoa, Theodorou, Lister, Davies and Isac1993 and Reference France, Dijkstra, Dhanoa, Lpez and Bannink2000), or by treatments of different substrates and inoculated ruminal microorganisms. The FRD is better than FRG in revealing the rate of fermentation at early stage in vitro incubation, because FRG cannot be defined at t-value = 0 (i.e. (dV/dt)/V = +∞), and changes fast with longer incubation time. The FRG (dV/dt)/V can be expressed as S/(S 0−S)(−(dS/dt)/S) by introducing −(dS/dt)/S in equation (3). The (dV/dt)/V = k was assumed for a more accurate definition of k, and k is equal to the FRG at  $$$ V\: = \:{{V}_{\rm{F}}}(\sqrt {d(1\: + \:d)} {\rm{ - }}d) $$$ for LE0 model, and FRG at
 $$$ V\: = \:0.5{{V}_{\rm{F}}} $$$ for EXPLAG model. At half-life (i.e. S = S 0/2 and V = V F/2), the FRG has the same equation as the FRD of four models. López et al. (Reference López, Dhanoa, Dijkstra, Bannink, Kebreab and France2007) reported that FRD and FRG have the same value at a particular time point (e.g. half-life).
Comparison of models
Differences among the four models in calculating FRD lead to an inconsistent ability in revealing biologically based behavior of in vitro fermentation processes. In our study, the FRD of the EXPLAG, GM and MM models showed a weak correlation with gas production at six incubation time points. The EXPLAG model could not reveal the rate of the in vitro fermentation processes in detail because it provides only the overall average FRD for the whole duration of in vitro fermentation. The FRD of GM and MM models is time dependent, and their correlation with gas production at early stage was low. Thereby, higher FRD may not represent a faster rate of fermentation with higher gas production at early stage. To overcome this limitation, time needed to produce a certain amount of total gas was added into the rate parameter systems (France et al., Reference France, Dhanoa, Theodorou, Lister, Davies and Isac1993; Jalilvand et al., Reference Jalilvand, Odongo, Lopez, Naserian, Valizadeh, Shahrodi, Kebreab and France2008; Murray et al., Reference Murray, Longland and Dunnett2008). Although, similar to the GM and MM models, the FRD with a time-dependent rate in the LE0 model generally had strong correlation with gas production, especially at the early incubation times (i.e. up to 12 h). Thus, the FRD of LE0 model has potential to reveal the early process of in vitro fermentation, although the extent of correlation was decreased at the later incubation points (e.g. 24 h).
The main difference in methodology between data sets 2 and 3 was the length of incubation. Our study indicated that the incubation period had a smaller effect on the performance of the LE0 model compared with the EXPLAG, GM and MM models. For example, the MM model had the highest final asymptotic gas volume and the longest half-life, when short incubation data (48 h) from subset 2 were fitted, followed by EXPLAG and GM; the LE0 model had the lowest asymptotic gas volume (Wang et al., Reference Wang, Tang and Tan2011). This suggests that the MM and EXPLAG models may not be suitable to describe gas production curves from short in vitro incubation experiments because they overestimate the final gas volume and underestimate the rate of fermentation in those situations (Wang et al., Reference Wang, Tang and Tan2011).
The FRD 0 was the starting value of FRD and affected by the initial fermentation efficiency of inoculated microbes for a feedstuff. The results of our study indicated a relatively strong correlation (P < 0.05) between FRD 0 and gas production at 2, 4, 6 and 8 h of four subsets. It seemed that FRD at t-value = 0 of the LE0 model was an important starting rate of early in vitro incubation, although increased FRD was observed with longer incubation time. The extent of correlation was noticeably decreased with advancing incubation stages (i.e. 12 and 24 h), because the microbial activity and available substrate greatly changes with the longer incubation time. Thus, the FRD 0 was a good indicator for the rate of fermentation at early incubation stages of ‘<12 h’, but unable to reveal the rate of in vitro fermentation during the middle and late stages of ‘>12 h’ of in vitro incubation.
Although the feedstuffs used represent a wide range of characteristics of in vitro fermentation from different laboratories, the FRD of LE0 model also shows high correlations with gas volumes at the early stage in vitro incubation. As the amount of organic matter degradation, microbial protein synthesis and volatile fatty acids (VFAs) production of feedstuffs in the rumen depend highly on the degree of fermentation, the rate of fermentation and the rate of digesta flow (Dijkstra et al., Reference Dijkstra, Kebreab, Bannink, France and López2005; Cone and Becker, Reference Cone and Becker2012), they could have a close correlation with the FRD at the early stage in vitro fermentation. Further studies should be conducted to validate this hypothesis with both in vitro and in vivo measurements.
For the middle stage of in vitro fermentation, half-life, the time to reach half of asymptotic gas volume, can be a good choice and has been used in many in vitro studies (Mauricio et al., Reference Mauricio, Owen, Mould, Givens, Theodorou, France, Davies and Dhanoa2001; Calabrò et al., Reference Calabrò, López, Piccolo, Dijkstra, Dhanoa and France2005; Jalilvand et al., Reference Jalilvand, Odongo, Lopez, Naserian, Valizadeh, Shahrodi, Kebreab and France2008). For example, half-life ranged from 10 to 20 h for in situ degradation of 87 ruminant feeds (López et al., Reference López, France, Dhanoa, Mould and Dijkstra1999) and from 8 to 50 h for in vitro gas production kinetics of 24 feeds (Mauricio et al., Reference Mauricio, Owen, Mould, Givens, Theodorou, France, Davies and Dhanoa2001; Calabrò et al., Reference Calabrò, López, Piccolo, Dijkstra, Dhanoa and France2005). For the late stage of in vitro fermentation, the time to produce 90% or 95% of total gas production can be a good choice for a rate parameter system (Murray et al., Reference Murray, Longland and Dunnett2008).
Acknowledgments
The authors thank the National Natural Science Foundation of China (Grant No.31001023), the ‘Strategic Priority Research Program – Climate Change: Carbon Budget and Relevant Issues’ (Grant No. XDA05020700) and Knowledge Innovation Program of CAS (Grant No. KZCX2-YW-455) of the Chinese Academy of Sciences for the joint financial support. The authors also thank Drs Arjan Jonker and Ronaldo Vibart for critical reading and comments.