Introduction
Globally, Brazil is the fourth leading consumer of fertilizers based on nitrogen, phosphorus, and potassium (NPK), ranking behind only China, India, and the United States with a total quantity of 15.3 million Mg in 2017 (Associação Nacional para a Difusão de Adubos – ANDA, 2019). About 3.5 million Mg of N, which represents 22% of the N fertilizer applied in Brazilian agriculture, is used in sugarcane (Saccharum spp.) cultivation, surpassed only by corn (25%) (International Fertilizer Industry Association – IFA, 2017). However, several studies indicate that the recovery of 15N, also called N uptake efficiency (relation between the quantity of N from fertilizer absorbed by the crop and the N fertilizer dose applied), by sugarcane is low: only 25%–40% of N in the plant at harvest is derived from fertilizer (Boschiero et al., Reference Boschiero, Mariano and Trivelin2018; Franco et al., Reference Franco, Otto, Faroni, Vitti, Almeida de Oliveira and Trivelin2011; Trivelin et al., Reference Trivelin, Lara Cabezas, Victoria and Reichardt1994; Vieira-Megda et al., Reference Vieira-Megda, Mariano, Leite, Franco, Vitti, Megda, Khan, Mulvaney and Trivelin2015). The majority of N use by the crop originates from other sources, such as mineralization of organic material, biological fixation of N, dry and wet deposition, and planting material reserve (stalk) (Otto et al., Reference Otto, Castro, Mariano, Castro, Franco and Trivelin2016). Increasing nitrogen use efficiency (NUE), which is the capacity to produce biomass per unit of N in vegetal tissue, is a challenge for improving sustainability of the productive system.
NUE at the plant nutrition its capacity to use the available N resources in order to optimize its productivity (Gupta et al., Reference Gupta, Gupta, Gaur and Kumar2012). Genotypes from the same species are able to take in the same quantity of N in a different manner, as reported in wheat, sorghum, corn, rice, and soy (Fageria and Baligar, Reference Fageria and Baligar2005). Evidence that this occurs also in sugarcane was provided in two genotypes with contrasting N levels in leaves and N partition for the components of photosynthetic apparatus, including chlorophyll and the CO2-fixing enzyme ribulose-1,5-bisphosphate carboxylase/oxygenase (RuBisCO) (Ranjith and Meinzer, Reference Ranjith and Meinzer1997). Subsequently, high NUE was shown to enable sugarcane-efficient genotypes to produce more biomass under the conditions of low N supply (Robinson et al., Reference Robinson, Fletcher, Whan, Critchley, von Wirén, Lakshmanan and Schmidt2007). In general, plants can be classified into four groups according to their efficiency in the use of nutrients: efficient and responsive (ER), efficient and nonresponsive (ENR), inefficient and responsive (IR), and inefficient and nonresponsive (INR) (Gerloff, Reference Gerloff and Wright1976). Efficient genotypes are those that present greater productivity in relation to other genotypes under conditions of low availability of nutrients, while responsive genotypes are those that elevate productivity when the relative availability of nutrients increases (Gerloff, Reference Gerloff and Wright1976; Moll et al., Reference Moll, Kamprath and Jackson1982). The use of particular plant species and their genotypes to evaluate efficiency in the uptake and use of N is an important strategy to maximize NUE in agricultural systems (Fageria et al., Reference Fageria, Moreira, Moraes, Hale and Viator2013).
Another factor related to NUE is the preferred form of N absorbed by the plants. Terrestrial plants absorb predominantly inorganic N from the soil, mainly in the form of ammonium (NH4 +) and nitrate (NO3 −) ions (Willianms and Miller, Reference Willianms and Miller2001), which have distinct consequences in plant metabolism (Britto and Kronzucker, Reference Britto and Kronzucker2005). Some plant species are able to produce more biomass or accumulate greater quantities of N when grown in the presence of a specific N source compared with another (Britto and Kronzucker, Reference Britto and Kronzucker2013). This preference can be measured by using the isotope 15N, and C3 species generally present greater capacity (about 55% to 91%) for NO3 − uptake than C4 (Lin et al., Reference Lin, Lerch, Garrett, Jordan and George2007; Sehtiya and Goyal, Reference Sehtiya and Goyal2000). It has been reported that sugarcane presents preferential uptake for NH4 + (Robinson et al., Reference Robinson, Brackin, Vinall, Soper, Holst, Gamage, Paungfoo–Lonhienne, Rennenberg, Lakshmanan and Schmidt2011). However, for the growth period of one cycle of ratoon sugarcane under field conditions (∼365 days after fertilization), applying NH4 + did not increase the recovery of 15N compared to supplying NO3 − (Boschiero et al., Reference Boschiero, Mariano and Trivelin2018). In another study under hydroponic conditions, plants supplied only with NH4 + showed greater uptake and transport efficiencies for NH4 +, but the highest NUE occurred in plants receiving only NO3 − (Boschiero et al., Reference Boschiero, Mariano and Trivelin2018). Nevertheless, all these studies have evaluated single sugarcane genotypes and single N sources.
Sugarcane genotypes present highly varied behavior in relation to NUE (Hajari et al., Reference Hajari, Snyman and Watt2015; Robinson et al., Reference Robinson, Fletcher, Whan, Critchley, von Wirén, Lakshmanan and Schmidt2007; Schumann et al., Reference Schumann, Meyer and Nair1998; Whan et al., Reference Whan, Robinson, Lakshmanan, Schmidt and Aitken2010), but usually the strategies adopted by the plants that contribute to greater NUE are not clearly described and remain unknown. Our hypothesis is that sugarcane N uptake amount is related to preferential mineral N ammonium and nitrate form absorbed by genotypes. In the present work, we aim at evaluating, under controlled conditions, the preferential N uptake (NH4 + versus NO3 −) for genotypes of sugarcane contrasting in their NUE that have previously been identified as related to efficiency and response.
Material and Methods
Plant material, experimental design, and soil substrate
Four sugarcane genotypes from the Brazilian Inter-University Network for the Development of the Sugarcane Energy Sector (RIDESA), previously characterized in relation to their efficiency and response to N fertilization (Kölln, Reference Kölln2016), were used in this study: (i) ER – RB975375; (ii) ENR – RB937570; (iii) IR – RB867515; and (iv) INR – RB92579, which were selected based on a previous experiment in which we did one screening with genotypes using NUE measure under high and low N supply (Figure 1). For this, 18 genotypes were grown under controlled conditions with low (10 mg N kg−1) and high (270 mg kg−1) nitrogen supply using sand as substrate. This screening was based on methodology of Robinson et al. (Reference Robinson, Fletcher, Whan, Critchley, von Wirén, Lakshmanan and Schmidt2007). The experimental design used was completely randomized, with four repetitions. The treatments were arranged in the factorial scheme 4 × 2 × 3, complete. Two labels of nitrogen fertilizer in 15N (15N-NH4 + and 15N-NO3) and three evaluation times [0, 24, and 72 h after applying fertilizer labeled 15N (HAF)].
The conceptual diagram of selected genotypes and the development of the experiment.

The experiment was developed in a growth chamber (HGC 1514, Fitotron, Weiss Technik) using 4 L pots filled with 3.6 kg of dry soil with a sandy texture (sand at 813 g kg−1; silt at 24 g kg−1 and clay at 163 g kg−1; 0–0.2 m depth). The substrate was collected from the surface layer (0–0.2 m) of one Psamments (Soil Survey Staff, 2014), located at lat 22°35’46” S and long 48°48’40’’W, in Lençóis Paulista/SP, Brazil. This location is included in an area cultivated with sugarcane for more than 30 years under a manual cutting system with previous burning. In the last 8 years, this area has been harvested mechanically, with the maintenance of biomass residues (dry leaves and tops) on the soil. The main soil chemical characteristics before fertility correction were as follows: pH (CaCl2): 4,7; organic carbon (OC): 9.5 g dm−3; P: 2 mg dm−3; Ca, K, Mg, potential acidity (H + Al), and cationic exchange capacity (CEC): 13.0, 3.0, 0.5, 26, and 43 mmolc dm−3, respectively. Furthermore, the proportions of N-NH4 + and N-NO3 − in soil were 20 and 35 mg dm−3, respectively; mineral N was extracted in duplicate from 5 g of soil with 25 mL of 2 M KCl (ratio 1:5, soil: solution), with shaking for 1 h. The extracts were filtered through analytic filter paper and analyzed in flow injection analysis (FIA) system (Reis et al., Reference Reis, Vieira, Krug and Giné1997). The forms of nitric N (NO3 − + NO2 −) were determined simultaneously by the spectrophotometric method, by reducing NO3 − to nitrite in a copperized cadmium column, followed by the nitrite reaction with sulfanilamide in an acid medium, forming an azo compound (Giné et al., Reference Giné, Zagatto and Reis1980). The pH was determined in a solution of CaCl2 0.01 mol L−1 (soil: solution – m: v) (van Raij et al., Reference van Raij, Andrade, Cantarella and Quaggio2001). The OC was determined by the Walkley–Black procedure; the soil sample was oxidized with acidified K2Cr2O7, and the unreacted excess of Cr was determined by titration (Nelson and Sommers, Reference Nelson, Sommers and Sparks1996). The proportions of available P and exchangeable Ca, K, and Mg were extracted using ion exchange resin and determined by calorimetry (P), flame photometry (K), and atomic spectroscopy absorption (Ca and Mg) (van Raij et al., Reference van Raij, Andrade, Cantarella and Quaggio2001). The potential acidity of the soil was quantified by the SMP buffer method (Shoemaker et al., Reference Shoemaker, McLean and Pratt1961). The CEC at pH 7.0 was calculated as the sum of exchangeable cations (K+, Ca+2, and Mg+2) and the content of H + Al. The soil acidity correction and the elevation of Ca and Mg proportions were carried out by applying dolomitic limestone (PRNT 90%) to achieve saturation by CTC bases of 70% (van Raij et al., Reference van Raij, Andrade, Cantarella and Quaggio2001). After liming, the soil was incubated for 30 days at 65% of maximum capacity for water retention.
Plant growth conditions
The sugarcane seedlings were obtained from minisets containing one bud (25 mm length) removed from the medial third of 10-month-old stalks. The minisets were germinated in inert vermiculite without addition of nutrients, in plastic trays. After 30 d, the seedlings were transplanted into pots containing soil as substrate, and each vase received one seedling. The plants were irrigated daily by means of weighing, maintaining the water content at 65% of the maximum capacity for water retention. Temperature (ºC) and relative air humidity (%) were controlled during plant growth, 30 ºC and 70% RH during the daytime (7h00 to 19h00), and 24 ºC and 80% RH during the night (19h01 to 6 h59). In young plants (up to 30 days after transplant – DAT), the flow of photons (irradiance was maintained at 1200 μmol m−2 s−1) subsequently increased to 1400 μmol m−2 s−1.
Seven DAT plants were fertilized with P (120 mg kg−1) and K (150 mg kg−1) (KH2PO4), and with micronutrients: Zn (3 mg kg−1; ZnSO4), B (1 mg kg−1; H3BO), Cu (0.5 mg kg−1; CuSO4), Fe (5 mg kg−1; ferric EDTA), Mn (4 mg kg−1; MnSO4), and Mo (0.3 mg kg−1; Na2MoO4). After 1 month of growth, plants were supplied with 100 mg of N kg−1 of soil (NO3NH4 form). Sixty DAT plants received a solution containing labeled N (15N). Half of the pots received 50 ml with 10 mmol of N (K15NO3, 4.02 atoms % 15N) + 10 mmol of N [(NH4)2SO4], while the other half received 50 ml with 10 mmol of N (15NH4)2SO4, 4.18% of atoms 15N) + 10 mmol of N (KNO3). To avoid possible nitrification of NH4 +, all pots received 170 μg dicyandiamide (DCD), a nitrification inhibitor equivalent to 5% of the total N applied. Destructive evaluations were also made in plants before the application of the solution labeled as 15N (time zero), 24 and 72 hours after fertilization.
Biomass dry yield, N content, N in plant derived from fertilizer, 15N-recovery, and NUE
For each harvest time, one central portion of the first leaf lamina with visible ligule without the ribs and active roots (young and with color white) were collected, immediately frozen in liquid N, and stored at −80 ºC for enzymatic and metabolic determinations. The plants were then separated into leaves, stems, and roots and dried in a forced-air ventilation oven at 65 ºC for obtaining the dry biomass. Subsequently, the samples were ground to a fine powder, and the isotopic and N abundance were determined (% atoms of 15N) by a mass spectrometer (ANCA-GSL Hydra 20–20 SERCON Co., Crewe, UK) coupled to an automatic N analyzer (Barrie and Prosser, Reference Barrie, Prosser, Boutton and Yamasaki1996). The N content of each plant fraction was calculated by multiplying the proportion of N (g kg−1) by the production of dry biomass (g plant−1). The N content of the plant derived from fertilizer (NPPF) (eq. 1) and the recovery of 15N fertilizer (eq. 2) were estimated according to Trivelin et al., (Reference Trivelin, Lara Cabezas, Victoria and Reichardt1994). The NUE (g mg−1) was calculated by the production of biomass in g, divided by plant N content in mg (eq. 3) (Siddiqi and Glass, Reference Siddiqi and Glass1981):
 $$NDFF{\rm{\;}}\left( {mg{\rm{\;}}plan{t^{ - 1}}} \right) = \left. {\left( {{\rm{\;}}{{a - b} \over {c - b}}} \right.} \right)\times{\rm{\;}}N{\rm{\;}}plant$$
 $${N^{15}}RFF\left( {{\rm{\% \;}}} \right)\left. {\left( {{{NDFF{\rm{\;}}\times{\rm{\;}}100} \over {N{\rm{\;}}\left( {plant} \right)}}} \right.} \right)$$
 $$NUE = {{Biomass} \over {N{\rm{\;}}accum}}$$
where NDFF is N in plant derived from fertilizer (mg plant−1), a is the abundance of 15N atoms in the sample, b is the abundance of 15N atoms in the fertilizer, c is the natural abundance of 15N atoms (0.366%), N plant is total N accumulated of plant (mg plant−1), 15 N RFF (%) is the N recovery from fertilizer, NUE is the nitrogen use efficiency, biomass is the total shoot biomass accumulated in plant, and N accum is the total N accumulated in the plant.
Soil mineral N content
For determining mineral N content (NH4 + and NO3 −), soil subsamples were collected and stored at −10 ºC in order to diminish microbiological activity. Mineral N was extracted in duplicate from 5 g of soil with 25 mL of 2 M KCl (ratio 1:5, soil: solution), with shaking for 1 h. The extracts were filtered through analytic filter paper and analyzed in FIA system. NH4 + was analyzed in alkaline medium, passing through a hydrophobic membrane of polytetrafluoroethylene, with the flow being directed toward a conductivity cell (Reis et al., Reference Reis, Vieira, Krug and Giné1997). The forms of nitric N (NO3 − + NO2 −) were determined simultaneously by the spectrophotometric method, by reducing NO3 − to nitrite in a copperized cadmium column, followed by the nitrite reaction with sulfanilamide in an acid medium, forming an azo compound (Giné et al., Reference Giné, Zagatto and Reis1980). Mineral N results were corrected for soil humidity and expressed as dry soil mass, after drying the soil subsamples in an oven at 105 ºC.
Nitrate reductase and glutamine synthetase (GSa) assay
Nitrate reductase activity of NO3 − (NRa) was determined in samples from leaves and roots, according to Wray and Fido (Reference Wray, Fido, Dey and Harborne1990). Two hundred milligrams of fresh material were extracted with 600 µL of 100 mM phosphate buffer (pH 7.5) containing 1 mM EDTA, 5 mM DTT, 4 μM leupeptin, and 2% (m/v) PVPP. After centrifugation (14 000 rpm, 10 min, 4 ºC), the extract (40 µL) was incubated with the reaction mix [100 mM phosphate buffer (pH 7.5) containing 10 mM KNO3, 2mM EDTA, 5 mM DTT, and 0.2 mM NADH] in a total volume of 160 µL. The reaction proceeded for 15 min at 30 ºC and was stopped by adding 40 µL of 0.5 M zinc acetate. Subsequently, the samples were centrifuged (4000 rpm, 2 min), and 100 µL was transferred to a new microplate to which 50 μL of 1% sulfanilamide in 3M HCl and 50 μL of n-(1-naphthyl) ethylenediamine dihydrochloride 0.1% were added. After 20 min, the quantification of enzyme activity was determined spectrophotometrically at 540 nm, using different concentrations of nitrite as standards.
The activity of glutamine synthetase (GS) was based on O’Neal and Joy (Reference O’Neal and Joy1973), adapted for microplates. Two hundred milligrams of fresh material were extracted with 600 μL (leaves) or 400 μL (roots) of 100 mM Tris buffer (pH 7.6) containing 1 mM MgCl2, 1 mM EDTA, 5 mM DTT, and 4 μM leupeptin. Due to the difficulty of obtaining a rapid separation between glutamine produced in the reaction and the substrate glutamate, hydroxylamine was used as an alternative substrate for ammonia (Lea et al., Reference Lea, Blackwell, Chen, Hecht and Lea1990). After centrifugation (14 000 rpm, 10 min, 4 ºC), the extract (50 µL) was incubated with Tris 100 mM (pH 7.6) containing 20 mM MgSO4.7H2O, 80 mM glutamate, 6 mM NH2OH, and 4 mM EDTA] in the absence (blank) or presence of 8 mM ATP, in a final volume of 150 µL. The reaction proceeded for 30 min at 30 ºC and was stopped by adding 150 µL 0.37 M FeCl3, 0.2 M trichloroacetic acid, and 0.67 M HCl. After centrifugation (4000 rpm, 2 min), 200 µL of each sample was transferred to a new microplate, and the quantification of enzyme activity was determined spectrophotometrically at 540 nm, using different concentrations of glutamyl-gamma-hydroxamate as standards.
Metabolite profiling analysis
Fifty milligrams of tissue of the middle part of leaf +1 without nervure and one portion of live root were collected and extracted with methyl tert-butyl ether buffer, as described previously (Giavalisco et al., Reference Giavalisco, Li, Matthes, Eckhardt, Hubberten, Hesse, Segu, Hummel, Khl and Willmitzer2011). Aliquots of 100 μl of the organic phase were dried and derivatized as described in Roessner et al. (Reference Roessner, Luedemann, Brust, Fiehn, Linke, Willmitzer and Fernie2001). One microliter of the derivatized samples was analyzed using an Agilent 7890 Gas Chromatograph coupled to a Leco Pegasus 2 time-of-flight mass spectrometer (LECO, St. Joseph, MI, USA) (Weckwerth et al., Reference Weckwerth, Loureiro, Wenzel and Fiehn2004). Chromatograms were exported from Leco Chroma TOF software (version 3.25) to R software. Peak detection, retention time alignment, and library matching were performed using Target Search R-package (Cuadros-Inostroza et al., Reference Cuadros-Inostroza, Caldana, Redestig, Kusano, Lisec, Peña-Cortés, Willmitzer and Hannah2009). Metabolites were quantified by the peak intensity of a selective mass. Metabolite intensities were normalized by the fresh weight, followed by the sum of total ion count and global outlier replacement as described by Giavalisco et al. (Reference Giavalisco, Li, Matthes, Eckhardt, Hubberten, Hesse, Segu, Hummel, Khl and Willmitzer2011) and Huege et al. (Reference Huege, Krall, Steinhauser, Giavalisco, Rippka, Marsac and Steinhauser2011).
Statistical analysis
Three-way factorial ANOVA (4 genotypes × 2 15N fertilizers × 3 sampling times) was carried out for the results obtained from soil mineral N, dry biomass, and N accumulation. For all other analyses, a two-way arrangement was performed considering only genotypes and sampling times. The ANOVA was performed with PROC GLM from SAS (version 9.0, SAS Institute Inc., Cary, NC, USA) when F test (p ≤ 0.05) means were compared via Fisher’s LSD test (p ≤ 0.05).
Results
Soil mineral N, dry biomass yield, and N content
The NH4 + levels in soil were influenced by genotypes and sampling time (Figure 2). For the efficient genotypes (ER and ENR), the soil NH4 +, measured by extraction of mineral N form, levels were about 20% lower than those found for the inefficient genotypes (IR and INR), indicating greater nutrient extraction by the plant. The nutrient content passed from zero at time 0 to 34 mg kg−1 24 HAF, decreasing subsequently to 20 mg kg−1 in 72 HAF (Figure 2a). The levels of NO3 −, in turn, presented interaction of the factors genotypes × sampling time (Figure 2b). At time 0, the NO3 − level in the soil was similar among the genotype treatments: on average 25 mg kg−1, 24 h after 15N fertilizer application, the genotype ER presented soil NO3 − levels 10% to 20% lower than the other genotypes; finally, 72 HAF pots with inefficient genotypes (IR and INR) had quantities of NO3 − in soil on average 25% less than pots of the efficient genotypes (ER and ENR), indicating higher NO3 − consumption (Figure 2b).
NH4 +-N (a) and NO3 −-N (b) soil contents of different sugarcane genotypes (ER: efficient and responsive, ENR: efficient and nonresponsive, IR: inefficient and responsive, and INR: inefficient and nonresponsive.) and sampling time. The error bars indicate the SEM (n = 4). Lowercase and capital letters indicate differences between the genotypes within each sampling time and between sampling time within each genotype, respectively, according to Fisher’s LSD test (p ≤ 0.05).

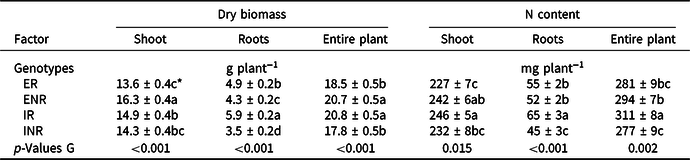
The production of dry biomass was also influenced by the genotypes and sampling time (Table 1). The genotype ENR presented the best performance in terms of above-ground biomass (10%–20% higher than the other genotypes), but it was only the third genotype concerning root biomass (Table 1). In turn, the genotype IR presented 20% to 60% higher root biomass than the other genotypes, but above-ground biomass was close to ENR, about 9% lower (Table 1). In this context, the genotypes ENR and IR presented the greatest production of total dry biomass per plant (∼20.8 g plant−1). The lowest root dry mass production was found for the genotype INR.
Dry biomass and N content in sugarcane plant roots and shoots according to contrasting genotypes (G) for N use efficiency

ER: efficient and responder; ENR: efficient and nonresponder; IR: inefficient and responder; INR: inefficient and nonresponder. Data represent the means (±SEM). *Different lowercase letters within a column indicate differences among the factors, according to Fisher’s protected LSD test (p ≤ 0.05).
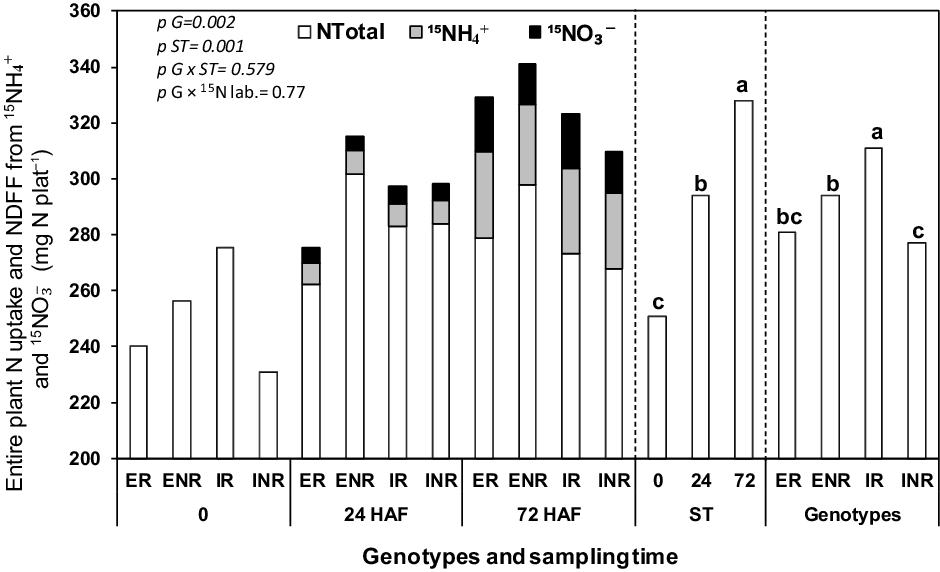
The accumulation of N in the plant was influenced by the genotypes and sampling times, but not by the 15N fertilizer, as expected (Figure 3). The N accumulation in all plant fractions was greater according to the time of fertilizer application (72 h >24h >0 h) (Figure 3). The genotype IR presented the highest N accumulation in all plant parts: 6% and 8% greater than INR and ER, respectively, in aerial parts; 45% higher than INR in roots; and an average of 5% higher at the whole plant level when compared to the other genotypes (Figure 3).
N content in sugarcane plant and nitrogen derived from fertilizer (NDFF) at 24 and 72 h after fertilization according to contrasting genotypes (G) for N use efficiency (ER: efficient and responder; ENR: efficient and nonresponder; IR: inefficient and responder; INR: inefficient and nonresponder), sampling time (ST; 0, 24, or 72 h after application of 15N fertilizer), and 15N labeled of N forms (15N lab., 15N-NH4 +, and 15N-NO3 −). Data represent the means (±SEM). Different lowercase letters within a column indicate differences among the factors, according to Fisher’s protected LSD test (p ≤ 0.05).

Nitrate reductase (NRa) and glutamine synthetase (GSa) activities
The NRa and GSa in roots and leaves were influenced by genotypes and sampling times (Figure 4). The highest NRa in the roots was found in the genotype INR (0.326 μmol NO2 − g−1 h−1), an activity about 20% greater than the other genotypes (Figure 4a). In the leaves, the genotype ER presented NRa (0.825 μmol NO2 − g−1 h−1) 15% and 20% higher than the inefficient genotypes (IR and INR, respectively) (Figure 4b). As to the sampling time, greater NRa was found in roots with increasing the time of N fertilizer application, while in leaves elevated activity was found at 24 h (Figure 4a, b). The efficient genotypes (ER and ENR) showed about 25% higher GSa in roots than the inefficient genotypes (IR and INR) (Figure 4c), whereas in leaves, the genotype ENR showed greater GSa activity (about 30%) compared to the other genotypes (Figure 4d). GSa in roots and leaves was also higher at the 72 h sampling time compared to 0 and 24 h (Figure 4c, d).
Nitrate reductase activity (NRa; a, b) and glutamine synthetase activity (GSa; c, d) in roots and leaves of sugarcane in different genotypes (ER: efficient and responsive; ENR: efficient and nonresponsive; IR: inefficient and responsive; and INR: inefficient and nonresponsive) and sampling time (0, 24, 72 h after application of 15N labeled fertilizer). The error bars indicate the SEM (n = 4). Lowercase and capital letters indicate differences between the genotypes and sampling time, respectively, according to Fisher’s LSD test (p ≤ 0.05).

Nitrogen derived from fertilizer (NDFF) and 15N recovery from fertilizer (15N RFF), and NUE
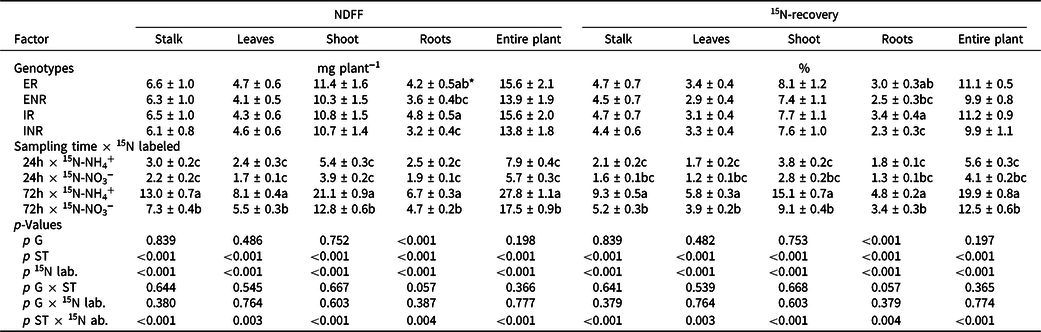
The genotypes of sugarcane influenced NDFF and 15N RFF only in roots, where the responsive genotypes (ER and IR) presented a mean value 40% higher than the genotype INR, the worst genotype for N uptake (Table 2 and Figure 3). Furthermore, the referenced variables were influenced by interaction of sampling time and the forms of N in all plant compartments (Table 2; Figure 5). At 24 HAF, no differences were found for NDFF and 15N RFF independent of the 15N source, while the sampling performed at 72 h detected a greater quantity of 15N-NH4 + than 15N-NO3 − in all organs and at the whole plant level (Figure 5; Table 2). In the final sampling, NDFF and 15N RFF from 15N-NH4 + were greater than 15N-NO3 − in 40% and 65% for the roots and aerial part, respectively (Figure 5; Table 2). In this context, higher values of these variables were found in all plant compartments at 72 h compared to 24 h (Figure 5). The NUE differed among the genotypes, in which genotypes ENR and IR presented greater NUE compared to genotype INR, but genotype ENR showed the highest NUE (Figure 6).
Nitrogen derived from fertilizer (NDFF) and 15N-recovery of fertilizer for stalk, leaves, shoot, roots, and entire plant, as affected by contrasting genotypes (G) for N use efficiency

ER: efficient and responder; ENR: efficient and nonresponder; IR: inefficient and responder; INR: inefficient and nonresponder, sampling time (ST; 24 or 72 h after application of 15N fertilizer), and 15N labeled of N forms (15N lab., 15N-NH4 +, and 15N-NO3 −). Data represent the means (±SEM). *Different lowercase letters in the column indicate differences between genotypes and the interaction sampling time × 15N labeled, according to Fisher’s protected LSD test (p ≤ 0.05).
Recovery of N fertilizer in leaves (a), stalk (b), shoot (c), roots (d), and entire sugarcane plants (e) according to different mineral N forms (15N-NH4 + and 15N-NO3 −) and sampling time (24 or 72 h after application of 15N fertilizer) for all genotypes evaluated. The error bars indicate the SEM (n = 4). Lowercase and capital letters indicate differences between mineral N forms at each sampling date and between the sampling dates at each mineral N forms, respectively, according to Fisher’s LSD test (p ≤ 0.05).

Nitrogen use efficiency (NUE) of different sugarcane genotypes. Vertical bars represent the mean and the error bar indicates the SEM (n = 4). Lowercase letters indicate differences between sugarcane genotypes, according to Fisher’s LSD test (p ≤ 0.05).

Metabolic analysis
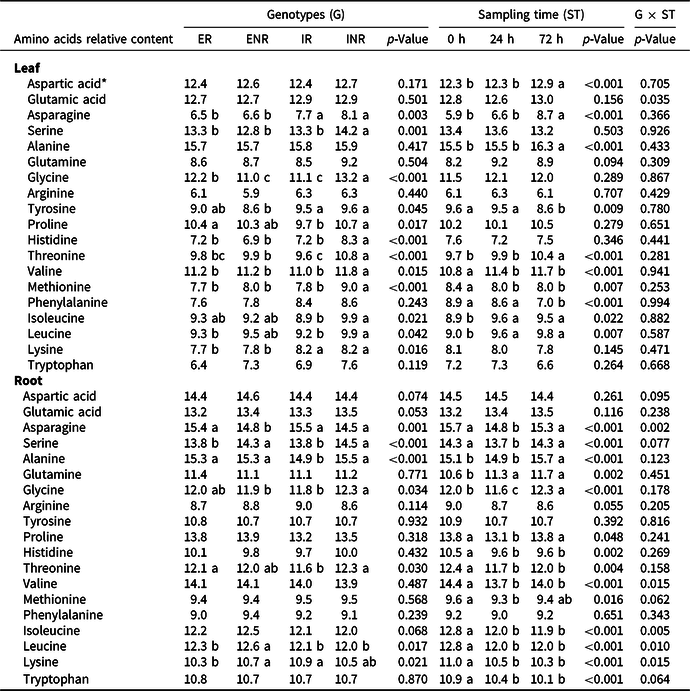
The metabolite profiling revealed that the genotypes differed most in the amino acids from aerial part when compared with the roots. In general, the genotype INR, the worst genotype for N uptake, presented a greater quantity of amino acids than the other genotypes, in both plant organs (Table 3). Alanine and asparagine were the amino acids that present significant difference; alanine was found in larger relative quantity in the plant leaves and roots, together with asparagine; the genotypes did not differ in the quantity of alanine in the aerial part, while in roots, the genotype IR contained the lowest quantities of this amino acid. The smallest asparagine content in the roots was found in the genotype ENR (Table 3).
Influence of contrasting genotypes for N use efficiency

ER: efficient and responder; ENR: efficient and nonresponder; IR: inefficient and responder; INR: inefficient and nonresponder), sampling time (0, 24, or 72 h after application of 15N fertilizer) and their interaction on amino acids concentration in the leaf and root of sugarcane plants. Data represent the means (±SEM). *Different lowercase letters within a row indicate differences among genotypes and/or sampling time, according to Fisher’s protected LSD test (p ≤ 0.05).
Discussion
The mechanisms that involved N absorption, such as nitrate transporters, enzyme activities, and relationship with photosynthesis, have been extensively studied in several plant species. But few studies have evaluated the NH4 + uptake preference effectively in sugarcane (Boschiero et al., Reference Boschiero, Mariano and Trivelin2018; de Armas et al., Reference Armas, Valadier, Champigny and Lamaze1992; Robinson et al., Reference Robinson, Brackin, Vinall, Soper, Holst, Gamage, Paungfoo–Lonhienne, Rennenberg, Lakshmanan and Schmidt2011), a topic also investigated in other species such as Arabidopsis (Helali et al., Reference Helali, Nebli, Kaddour, Mahmoudi, Lachaâl and Ouerghi2010), wheat (Crawford and Chalk, Reference Crawford and Chalk1993), and pine (Bown et al., Reference Bown, Watt, Clinton and Mason2010). Knowledge about the preferential form of N absorbed by the roots can aid in managing agricultural systems to augment NUE in plants. Nevertheless, the interactions between plants-microorganisms and the dynamic cycle of N limit our knowledge on this subject (Näsholm et al., Reference Näsholm, Kielland and Ganeteg2009). For this reason, we have chosen an experimental approach that selected previously contrasting genotypes in NUE carried out with a recognized methodology (Robinson et al., Reference Robinson, Fletcher, Whan, Critchley, von Wirén, Lakshmanan and Schmidt2007) grown in a greenhouse with sand substrate evaluating NUE and response under high and low N supply. After these four genotypes were selected, cultivars were grown under controlled conditions (grown chamber) in sandy soil using a nitrification inhibitor to evaluate the use of mineral N forms by sugarcane. Prior to the application of 15N fertilizer, there was no NH4 + in the soil, with only NO3 − present (Figure 2). This may have occurred due to preferential uptake of NH4 + by the sugarcane (Robinson et al., Reference Robinson, Brackin, Vinall, Soper, Holst, Gamage, Paungfoo–Lonhienne, Rennenberg, Lakshmanan and Schmidt2011) or due to the nitrification process that happens relatively rapidly in tropical soils (Cantarella, Reference Cantarella, Novais, Alvarez, Barros, Fontes, Cantarutti and Neves2007; Mariano et al., Reference Mariano, Leite, Megda, Torres-Dorante and Trivelin2015). The distribution and activity of microorganisms responsible for nitrification are strongly correlated with the environmental conditions (Koch et al., Reference Koch, Galushko, Albertsen, Schintlmeister, Gruber-Dorninger, Lücker, Pelletier, Paslier, Spieck, Nielsen, Wagner and Daims2014). In this experiment, the temperature (24–30 ºC) and RH of the growth chamber (70% to 80%), as well as the soil humidity (65% of the maximum capacity for water retention in the soil), constituted conditions highly prone to nitrification. Together with supplying 15N fertilizer, a nitrification inhibitor was applied (DCD), which presents a bacteriostatic action considered highly efficient for inhibiting the oxidation of NH4 + to NO2 − and constitutes a tool to evaluate the preference of the mineral N forms in crops (Sheng-Xiu et al., Reference Sheng-Xiu, Zhao-Hui and Stewart2013; Yang et al., Reference Yang, Fang, Sun and Shi2016). The DCD was considered efficient in soils and ammonium-oxidizing microorganism responsible for the conversion of ammonium to nitrate in Brazilian conditions (Barth et al., Reference Barth, Otto, Almeida, Cardoso, Cantarella and Vitti2020). Thus, interference of nitrification in the evaluations done at 24 and 72 HAF may be discarded.
Several physiological processes may influence NUE, such as efficiency in the acquisition of N by the roots or N uptake preference, the conversion of N into biomass, the storage of N absorbed in excess, and the remobilization of N during periods of low N supply (Masclaux-Daubresse et al., Reference Masclaux-Daubresse, Daniel-Vedele, Dechorgnat, Chardon, Gaufichon and Suzuki2010). The focus of the present study was to evaluate the influence of NO3 − and NH4 + preference of sugarcane on the recovery of NDFF. It was verified that the efficient genotypes (ER and ENR) absorbed a greater quantity of NH4 + from the soil at 24 and 72 HAF (Figure 2a), while the inefficient genotypes (IR and INR) presented higher NO3 − consumption at 72 HAF (Figure 2b). These differences may be associated with genotypic nutrient uptake preference, but only the recovery of NDFF from the root was influenced by genotypes, while the responsive genotypes presented greater recovery than the genotype INR (Figure 5). Thus, independent of whether the genotype is efficient or inefficient, the ability to be responsive to N provided greater NDFF in the roots. This was in contrast to the expected elevated recovery in the efficient genotypes, which may be attributable to the time of evaluation. The evaluation performed at 72 h after nitrogen fertilizer 15N application was chosen in order to avoid nitrification that can occur even with DCD application but may have been insufficient to provide a quantitative uptake of N by the genotypes to an extent that would have revealed differences among them, conducted in the soil, the absorption of nutrients is slower compared to the experiment with nutrient solution, for example, described by Boschiero et al. (Reference Boschiero, Mariano and Trivelin2018). For example, the maximum recovery of NDFF obtained at this time point was 20% when the NH4 + was supplied as the N source (Figure 5e). A recent work evaluating N preference by sugarcane in nutritive solution reported that the uptake was 150% quicker when an NH4 + source was used (Boschiero et al., Reference Boschiero, Mariano and Trivelin2018).
Sugarcane does not have the capacity to store significant quantities of NO3 − in its vacuoles, contrary to what occurs in other plant species (Boschiero et al., Reference Boschiero, Mariano and Trivelin2018; Robinson et al., Reference Robinson, Brackin, Vinall, Soper, Holst, Gamage, Paungfoo–Lonhienne, Rennenberg, Lakshmanan and Schmidt2011). This capacity is important given that NO3 − absorbed in excess at a determined moment comes to be mobilized for use in the plant under subsequent conditions of low N. Since this does not occur in sugarcane species, the NO3 − must be assimilated soon after its uptake. The activity of NRa in sugarcane roots is lower (about 2–10-fold) than in leaves, indicating that the leaves are the main organs of NO3 − reduction (Robinson et al., Reference Robinson, Vogt, Lakshmanan, Schmidt, Moore and Botha2013). Thus, after being absorbed, the NO3 − must be transported to the aerial part where it will be reduced through NRa and assimilated by GSa. This is attributable to the genotype ER presenting lower NRa activity in the leaves despite having absorbed a smaller quantity of NO3 − compared to the inefficient genotypes (Figure 4b). On the other hand, the assimilation of NH4 + occurs in the roots, near the uptake location through glutamine synthetase and glutamate synthase (GS-GOGAT) system, to prevent injuries due to excessive accumulation of NH4 + and maintain a small quantity of NH4 + in the xylem of the roots (Britto and Kronzucker, Reference Britto and Kronzucker2013). Thus, the efficient genotypes, which absorbed a greater quantity of NH4 + from the soil, presented higher GS activity in the roots compared to the inefficient genotypes (Figure 2a, b). Considering that this enzyme is directly related to the synthesis of glutamate and consequently provide N in plants, our data suggest that genotypes that are more efficient to a greater synthesis of this enzyme uptake more N for both sources. Furthermore, the same genotypes showed more NRa activity; thus, the first reduction of nitrate occurs more quickly via NRa and the metabolization of N by GS.
The uptake discrimination observed for 15N-NO3 − in plants supplied adequate N levels found in the present study (Figure 5) was also reported in other assays conducted under controlled and field conditions (Hajari et al., Reference Hajari, Snyman and Watt2015; Robinson et al., Reference Robinson, Brackin, Vinall, Soper, Holst, Gamage, Paungfoo–Lonhienne, Rennenberg, Lakshmanan and Schmidt2011; Serezino, Reference Serezino2015). In a study under in vitro conditions of Australian sugarcane genotypes contrasting in NUE, all varieties presented a higher uptake rate for N-NH4 + than for N-NO3 − when cultivated with 4 and 20 mM of N (Hajari et al., Reference Hajari, Snyman and Watt2014). The uptake and assimilation of NH4 + by the plants have lower energetic cost compared to NO3 −, since the former occurs through passive absorption (Salsac et al., Reference Salsac, Chaillou, Morot–Gaudry, Lesaint and Jolivet1987). This contrasts with the general consensus that many plant species use NO3 − as their main N source due to its high mobility and availability in agricultural soils and the capacity of plants to absorb, store, and metabolize NO3 − (Robinson et al., Reference Robinson, Vogt, Lakshmanan, Schmidt, Moore and Botha2013). Nevertheless, the production of biomass and losses of mineral N depend on the preference of the plants, rates of nitrification, and external inputs of mineral sources (Boudsocq et al., Reference Boudsocq, Niboyet, Lata, Raynaud, Loeuille, Mathieu, Blouin, Abbadie and Barot2012). For these reasons, this information must be considered in making decisions to achieve more sustainable crop management.
Barley plants (Hordeum vulgare) are reported to produce more asparagine when N is supplied to the plants as NO3 − compared to NH4 + (urea) (De Bona et al., Reference De Bona, Fedoseyenko, von Wirén and Monteiro2011), and similar results were obtained for sugarcane. In fact, the inefficient genotypes, which consumed more NO3 − from the soil (Figure 2), presented a greater quantity of asparagine in leaves compared to efficient genotypes (Table 3).
Although similar experiments were performed to access N preference in sugarcane, they have some pitfalls in relation to how N is supplied (e.g., only NH4 + or NO3 − making it impossible to detect any type of preference and without labeling), according to de Armas et al. (Reference Armas, Valadier, Champigny and Lamaze1992), and time of treatment (e.g., rapid inflow measures only unidirectional influx through the cell membrane without considering whether this N will be remobilized) (Loqué et al., Reference Loqué, Yuan, Kojima, Gojon, Wirth, Gazzarrini, Ishiyama, Takahashi and von Wirén2006). Greater uptake of N-NH4 + in sugarcane was shown in shorter/rapid inflow measurements (Loqué et al., Reference Loqué, Yuan, Kojima, Gojon, Wirth, Gazzarrini, Ishiyama, Takahashi and von Wirén2006; Robinson et al., Reference Robinson, Brackin, Vinall, Soper, Holst, Gamage, Paungfoo–Lonhienne, Rennenberg, Lakshmanan and Schmidt2011; Serezino, Reference Serezino2015). Our results showed that 3 days after applying labeled fertilizer, the N-recovered NDFF was present in leaves (30%), stems (45%), and roots (25%) (Table 2). Furthermore, the sugarcane genotypes analyzed showed an uptake preference for NH4 + instead of NO3 − at 72 hours after application of labeled N, 31 and 42% less N accumulation in roots and aerial part, respectively, when 15N-NO3 − was applied (Table 1). Serezino (Reference Serezino2015) evaluated the inflows of NO3 − and NH4 + in sugarcane plants and verified that, in a condition of sufficiency, the uptake of 15N-NO3 − was 98% lower in relation to NH4 +, decreasing to 95% when the plants were under N limitation.
Conclusion
By using labeled fertilizer, our results confirmed that sugarcane has greater recovery of N when 15N-NH4 + was supplied compared with NO3 − in the first hours after N fertilizer application. The sugarcane genotypes analyzed were contrasting for NUE according to previous study, but in the present study not presenting the same NUE separation. These findings highlight the possibility of fertilizing sugarcane with ammonium sources and obtaining better use of N fertilizer. The initial uptake by the crop can represent an improvement in using the N supplied from fertilizer, principally in cane harvested without burning, which develops a large number of roots. After a short period, all the NH4 + in the soil can be transformed into NO3 −; thus, the use of nitrification inhibitors can be considered for providing a longer NH4 + residence time in the soil, also contributing to augmenting the NUE in sugarcane. The NUE of sugarcane supplied with NO3 − and NH4 + using nitrification inhibitors under Brazilian field conditions remains to be evaluated.
Acknowledgements
We thank the Brazilian Bioethanol Science and Technology Laboratory and the National Center for Research in Energy and Materials for supporting the development of experiments of this work. We thank the Laboratory of Stable Isotopes and Center for Nuclear Energy in Agriculture for supporting the development of a doctoral science degree from the first author. The Universidade Estadual do Norte do Paraná – UENP/PROPG/EDITORA UENP as partial support for this publication. Jim Hesson copyedited the manuscript (https://www.academicenglishsolutions.com/editing-service).
Conflicts of Interests
The authors declare that they have no conflict of interest.