

Introduction
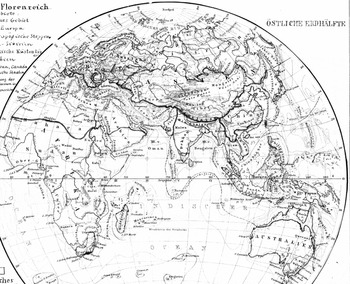
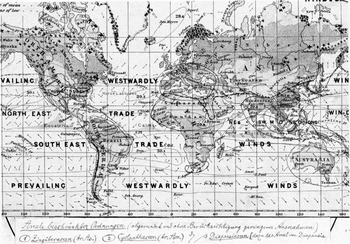
When opening his mail in late March 1884, the Dresden botanist Oscar Drude could hardly believe his eyes. At that time his first major publication – suggesting a new floristic division of the earth's surface – was nearly ready for press (Drude Reference Drude1884). Drude had already finished his text and the one thing that remained to be done was the revision of the accompanying maps. Although Drude had sent detailed hand-sketches to his publishing company Perthes in Gotha, the appearance of the edited results (fig. 1), which he found in his mailbox that day, took him by surprise. Apparently, the cartographer had rearranged the maps and changed a number of details, making for a visual quality hitherto unseen. Enthusiastically, Drude replied to the responsible cartographer Bruno Hassenstein: “Their Totaleindruck is such a pretty sight that I shall now refrain from developing the image I had originally intended to convey in the text.”Footnote 1
Detail of Bruno Hassenstein's revision of Oscar Drude's hand-drawn templates. It depicts a new botanical division of the globe by means of different hues and symbols of “floristic realms.” Unpublished, Archive of the Perthes Verlag (1884) (courtesy Universitäts-und Forschungsbibliothek Erfurt/Gotha, Sammlung Perthes).

Looking at his edited maps “at a glance” (Totaleindruck), Drude perceived something new and entirely fundamental. He identified therein, as he further wrote, new “principles.” Soon, the cartographer's corrections would please the eyes and stir the imagination of much wider circles, contributing to the wide reception of those maps on the “floristic realms” even beyond the botanical scientific community. Decades later, they were still held as graphic standards within plant geography (Eckert Reference Eckert1921–25, 2:389–390). In the meantime Drude, incited by the maps’ popularity, had intensified his cartographic activities and was, as early as the 1920s, declared a “master of vegetational maps” (ibid., 2:393).
What is remarkable both about Drude's surprise at the final appearance of his own sketches, as well as his subsequent initiation into the graphical universe of botanical maps, is its seemingly stupendous belatedness. By the 1880s maps were an established medium within plant geography. As historians have convincingly shown, they had already played a crucial role within scientific achievements of earlier key figures of nineteenth-century plant- and biogeography like Alexander von Humboldt and Charles Darwin, among others (Camerini Reference Camerini1993a; Godlewska Reference Godlewska, Withers and Livingstone1999; Dettelbach Reference Dettelbach1999). Even the Totaleindruck, the technique of observing the interconnectivity of physical phenomena in maps “at a glance,” had been a common visual practice among naturalists for decades (Bigg Reference Bigg and Fiorentini2007). In Drude's own days, the time of such spectacular epistemic innovations was seemingly over. Some historians have therefore been prompted to pinpoint the very end of the “golden age” of distribution maps – such as the one Drude was holding in his hands in 1884 – in the early 1860s (Robinson Reference Robinson1982, 24). Scholars in the late nineteenth century, it is implied, certainly refined already existing techniques, but the collective cartographical perception of plant distribution – the botanist's “period eye”Footnote 2 – remained mostly static and still corresponded to the view of their predecessors.
Interestingly enough, Drude and his contemporaries had a contrary view of the prehistory of plant geography's “period eye,” suggesting a different narrative on the history of botanical distribution maps. Whereas they seldom referred to those first maps from the “golden age” (which they just knew quite superficially), for them, the most trendsetting and reliable maps did not appear at all until the 1860s – maps that would facilitate a substantially new way of looking at plant distribution (Drude Reference Drude1884, 18–19; Engler Reference Engler1887, 358–359, Engler Reference Engler1899, 22–27). They were even convinced that these “new” maps unfolded yet unknown dynamics in the field of botanical mappings, leading to a quantitative explosion from the 1890s onward.Footnote 3 Not until then did maps become elementary to most plant geographical studies, and only then did their use as an argumentative tool became standard. Hence, when late nineteenth-century plant geographers considered their own endeavors, their self-perception contrasted significantly with the historiographical perception of the “development” of botanical mapping at the time.
By analyzing the case of Oscar Drude in more detail, this article aims to mediate between these two contradictory narratives by arguing that there indeed exists a yet invisible and nearly unwritten history of botanical map-making and map-perception in the second half of the nineteenth century. The practice of using maps within plant geography changed substantially in the last decades of the nineteenth century. Although maps were unquestionably an established medium at that time, they were less disseminated and mainly used in order to fixate and present a final stage of knowledge before becoming a common and widespread discursive object in the last decades of the century. This increasing dissemination of maps caused sustainable epistemic consequences. As it were, late nineteenth-century circulation of maps led to a wholesale cartographical calibration – say, scaling – of botany's earlier “period eye,” enabling Drude and other plant geographers to look differently at distribution maps. They began using them for graphical experiments and also explored new applications of maps in order to organize networks of botanical observers. Only then did maps become an indispensable element of botanical observation.
This “mapping impulse”Footnote 4 within plant geography was not driven by semiotic inventions made directly in the field, but rather forced by a broad change in the practice of map-making and map-use. It was caused by specific geographies of knowledge in which plant geographers as Drude interacted with persons and institutions from the academic periphery, i.e. cartographers employed by publishing companies or botanical amateurs organized in regional societies of natural history. Oscar Drude's map-making exemplifies how skills and practices – developed in “popular” fields of knowledge such as commercial cartography and originally conceived for classrooms and unprofessional audiences – affected the “scientific” reflection on the distribution of plants in late nineteenth-century Central Europe.Footnote 5
The interaction between “popular” and “scientific” cultures also explains how new methodological questions very suddenly appeared on the research agenda of plant geographers as Drude. His maps namely shaped a field of study which became a discipline of its own by the turn of the century: scientific ecology.Footnote 6 “Ecology,” however, was by no means the actual goal of his plant cartographical research, but rather a by-product of his regional studies. Both areas – plant cartography and its later “spill-over” to ecology – were strongly interwoven in Drude's every-day practice and driven by the same milieu of “popular” knowledge production.
Focusing on such para-academic and practice-driven geographies of knowledge has proven to be a promising approach to reconsider common narratives in the history of plant geography.Footnote 7 Whereas an older historiography had mainly concentrated on the development of geobotanical theory,Footnote 8 postcolonial studies have brought to light the “practical and useful” implications of biogeography in colonial infrastructures, pervasively shaping the cartographical display of early plant geography (Cañizares-Esguerra Reference Cañizares-Esguerra, Schiebinger and Swan2005).Footnote 9
What has been revealed by this postcolonial approach is a much more complicated picture. Because these studies often tended to construe ecological thinking as an outcome of the colonial interaction with the tropics (Grove Reference Grove1996), the intra-European developments within plant geography have remained, the major colonial institutions apart, somewhat of a black box,Footnote 10 all the more so for the late nineteenth century.Footnote 11 Even the idea of well-identifiable “centers” of biogeography, notably the major European botanical gardens in London or Paris, is de facto belied by the heterogeneity of the discipline's interior social and scientific make-up. While the historiographical focus still remained primarily on the European academe, it is questionable whether this narrative holds up against biogeography's organizational structure. As Drude's case will demonstrate, more social groups were involved in the development of crucial research techniques like mapping than just “pure” (academic) scientists. This perspective converges with Lynn K. Nyhart's recent analysis, challenging the historiographic preoccupation with the academe and showing that a “biological perspective” in late nineteenth-century Germany originated in a very heterogeneous milieu: not in the “elite realm of university science but the civic realm of museums, schools, zoos, and other public enterprises” (Nyhart Reference Nyhart2009, 4–5). The case of Oscar Drude broadens this institutional scope. It highlights that major epistemic shifts within the already established field of plant geography, like the upgrading of maps and even their transfer to new fields of enquiry like ecology, depended highly on regional, scientific-popular dynamics.
This paper falls into two parts. In the first section I will analyze Drude's relationship to the publishing company Perthes. In the later section I will show how the skills he learned from this relationship enabled him to “ecologically” apply maps not only as an epistemic tool, but also in social matters in order to re-organize networks of local observers.
Learning to Draw: Oscar Drude and the Perthes Verlag
When Drude found the maps in his mailbox in 1884, the sender was already a great authority on the production of distribution maps. For an adequate understanding of Drude's activities it is key first to recapitulate the rise of the publishing company and its access to botanical mappings in the decades before. At that time the Perthes Verlag, located in the town of Gotha in today's federal state of Thuringia, was not just participating in nearly all developments within thematic cartography, it was also directly carrying them out.Footnote 12
Since the early nineteenth century the commercial market for cartographical products had already grown to an exceptional level in the German states. Publishing companies like the Perthes Verlag profited from an increasing demand for “popular” atlases, especially for two new school subjects: geography and the more locally-orientated Heimatkunde (Brogiato Reference Brogiato1996; Espenhorst Reference Espenhorst and Grossmann2003–08). The prospering market caused specific institutional developments. Whereas publishing companies in the United States and other countries seldom employed more than ten persons and map-making was more generally linked to state institutions, the German firms, working under fragmented political conditions, strengthened their position by systematically expanding into all areas of cartographical production and especially that of “thematic” (distribution) mapping.Footnote 13 They simultaneously employed innovative methods and technology in order to reduce production costs: all production steps were integrated into one base where they also introduced new printing and coloring techniques (especially lithography).Footnote 14 Thus, so-called “geographical institutes” like the Perthes Verlag had dozens of employees, ranging from editors and cartographers to printers and colorists. Therefore, they rapidly became the centers of the geographical scientific community, successively accumulating skills, knowledge, and technology (Eckert Reference Eckert1921–25, i, 39–42).
By the 1840s the Perthes Verlag had become the primus inter pares, selling up to 60,000 atlases a year (Brogiato Reference Brogiato1996, 44). The “Perthes style”Footnote 15 substantially shaped both the contemporary view on the world as well as the world-view, determining the period eye of an always-growing part of society. Due to its increasing market power, the company was able to dictate the standardization of graphical language within national and international cartography (i.e. the colors red and blue to display temperature in maps). This has been first and foremost a quantitative effect. Since the 1850s up to 800 maps a day were colored by about more than 160 women and girls employed by Perthes-subcontractors (Köhler Reference Köhler1987, 85; Smits Reference Smits2004, 47), to say nothing of the number of lithographed maps also being produced. All in all, the German “geographical institutes” more closely resembled “factories” than the smaller publishing companies in other countries (Köhler Reference Köhler1987, 87–94).
In matters of distribution maps, the Perthes Verlag had entered the stage with a product that has been widely described as a graphical culmination and milestone of “Humboldtian science.” By the mid-1840s, the company published the Physical Atlas of Heinrich Berghaus, the first compendium of thematic cartography, which contained a separate section on plant geography and was soon reissued in Great Britain (see Berghaus Reference Berghaus1845–48, especially section 5; and Johnston Reference Johnston1848).Footnote 16 From an editorial point of view this atlas was above all an attempt to establish a new product besides the already-existing “normal” topographical atlases, like, for example, the best-selling “Stieler.” However, the actual priming of distribution maps came only a decade later and was closely related to the activities of the new chief cartographer of the company, August Petermann.
In the early 1850s, Petermann came to Gotha after having spent a long period of cartographical activity in Great Britain (see Smits Reference Smits2004, 37).Footnote 17 On the British Isles he had participated in a general epistemic and social upgrading of maps in Victorian scientific culture.Footnote 18 During those years Petermann corresponded about botany with key figures of Victorian plant geography, like Hewett C. Watson. However, although maps were fashionable among Victorian naturalists and botanists as a tool for reorganizing scientific inquiry and making visible the usefulness of costly scientific research, only a few of those maps actually came into print due to their high production costs, and Petermann could hardly keep himself afloat in Great Britain (Felsch Reference Felsch2010, 117–129).
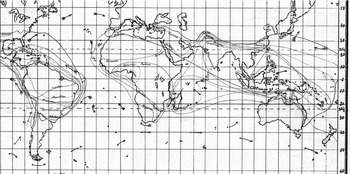
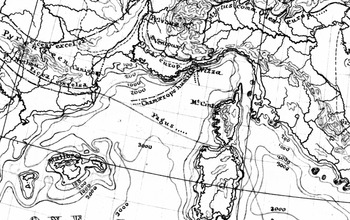
Returning to the German states, where there was a more prosperous cartographical market, Petermann carried in his luggage dozens of hand-drawn and unprinted maps from his British years (fig. 2).Footnote 19 The Perthes Verlag allowed Petermann to put into practice his former claims and circulate his sketches among a wide audience. Soon after Petermann's arrival a new cartographical journal, the Petermann's Geographische Mitteilungen, was released.Footnote 20 From 1855 onwards it appeared in short intervals, containing the results of the most recent geographical research, including many “thematic” studies on subjects such as plant geography. This economically successful journal became a “cash cow” for the publishing company while simultaneously affecting the epistemic setting of Central-European geography. In its very first issue, Petermann claimed that maps should become the “ultimate goal” (Endprodukt) of all geographical research (Petermann Reference Petermann1855, 2). In a long-term perspective, this new image-agenda for geography allowed for maps to become an increasingly “normal” part within other fields of geographical studies like plant geography.
Detail of an unpublished “skeleton map” (untitled) by William Brand, which August Petermann brought to Gotha in 1854. It was financed by the British Association for the Advancement of Science. By locating the specimen's place of discovery in the depicted “sections” it was supposed to be used to control the global circulation of plant material. Unpublished, Archive of the Perthes Verlag (1840) (courtesy Universitäts-und Forschungsbibliothek Erfurt/Gotha, Sammlung Perthes).

In the beginning, Petermann published maps of so-called “cultural plants” (mainly crops) from all over the world. These maps then became prototypes for “pure” botanical ones. During the following decades dozens of regional maps were published in Petermann's Geographische Mitteilungen.Footnote 21 The international reputation of the publishing company grew quickly. Foreign researchers, e.g. British botanist Robert Brown, sent sketches of botanical maps to Gotha, hoping that the publishing company would bear the high costs of map production.Footnote 22 Drude, in this regard, was a case in point. His first botanical map from 1878 also appeared in Petermann's journal and was drawn by the editor (Drude Reference Drude1878). His article and maps on “floristic realms” (as mentioned above) appeared in the journal's supplements (Drude Reference Drude1884).
The journal, however, was not only an easy way of getting things published; simultaneously, it also enabled many botanists to enter into contact with distribution maps for the first time. For example, even when Oscar Drude was already working intensively for the Perthes Verlag, he knew only superficially the physical atlas of Hermann Berghaus, regarded today as the major reference point for all later distribution mappings.Footnote 23 Instead, Drude referenced maps that had appeared in the company's journal. This was for quite simple reasons: while the Physical Atlas had been sold in a relatively small number of 600 to 700 copies and was thus mostly in the hands of outstanding scholars, the journal's circulation was about seven times higher (see Smits Reference Smits2004, 38). Because the journal was – in Drude's words – “actually everywhere and distributed amongst the widest circles,” it was easier to access.Footnote 24 It could become a “source of daily instruction,” especially for non-professional geographers like the botanist Oscar Drude.Footnote 25
As in other fields of geography, the Perthes Verlag also carried out independent research for plant geography. A cartographical archive and a geographical library were built in Gotha containing independent sections for each branch of thematic cartography. Not only did the institute acquire most maps, books, and articles then in print on plant geography, but it also collected heterogeneous material that could be of importance for later map productions and contained observations made both by elite scientists and amateurs. This included offprints of academy-talks, newspaper articles on singular plants and crops (i.e. tea, coffee and opium), reports of gardeners, shopping catalogs of seed companies or schoolbooks for teaching plant geography in secondary schools, to name only a few.Footnote 26
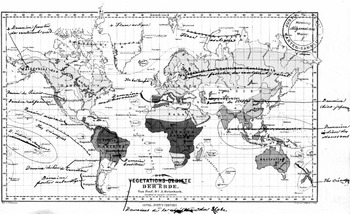
Thus dominating the market, Petermann produced maps that accompanied influential botanical studies in the second half of the nineteenth century. Previous to Drude's maps from the 1880s, Petermann drew a map accompanying an article of the botanist August Grisebach that displayed a new vegetational division of the earth's surface (fig. 3). It was first published in the company's journal in 1866 (Grisebach Reference Grisebach1866). A few years later the map was reprinted in Grisebach's magnum opus Die Vegetation der Erde (Grisebach Reference Grisebach1872, 2:appendix) and soon the publishing company produced a French version by replacing the German with French terms (Grisebach Reference Grisebach and de Tchihatchef1875–78, 1:appendix). Later plant geographers would praise precisely this map as the first of a new era in which plant cartography would lose its scientific vagueness (Engler Reference Engler1887, 359; Engler Reference Engler1899, 24–25; Eckert Reference Eckert1921–25, 2:390). But this map not only iconographically influenced the later discipline, it also strengthened the link between the Perthes Verlag and Grisebach. The company recruited Grisebach as an external botanical expert. This consulting activity became the link between the company and the young botanist Drude.
August Grisebach's Die Vegetations-Gebiete der Erde (published in 1866). The German titles were replaced by French at a later stage. Unpublished, Archive of the Perthes Verlag (courtesy Universitäts-und Forschungsbibliothek Erfurt/Gotha, Sammlung Perthes).

Drude contacted the Perthes Verlag with the help of Grisebach in 1876, when the company's expansion was reaching its maximum. The 24-year-old Drude had little experience with maps during his undergraduate years. He had studied botany in Göttingen where Grisebach was his main academic teacher.Footnote 27 While increasing his knowledge of systematics within plant geography, this did not include courses on map-making. Having completed his studies he specialized in the distribution of a particular plant order – the palms. Since the Perthes Verlag had already published articles and maps on singular plant orders,Footnote 28 and because Drude was optimistic that the distribution of palms was of “interest to geography,” he submitted an article on the subject in 1876.Footnote 29 The publishing company was generally interested, but the production of the map was a point of issue. Drude admitted that when it came to map-making, he was “naturally no master from an artistic point of view”Footnote 30 whereas he knew that “the whole world appreciates the cartographical ideas” emerging in Gotha.Footnote 31 Nevertheless, he was willing to draw the map. He had already made the first steps towards working cartographically: “You want to spare me the efforts of elaborating the map; on the contrary I have to say that I am fond of taking cartographical notes and I dealt a lot with it during my studies. You would not be relieving me of trouble so much as robbing me of a great pleasure.”Footnote 32 In spite of this enthusiasm, Drude's practical, auto-didactical skills were low. He felt, for example, “too weak” to design “an accurately-projected image of the world” and requested that the publishing company send him base maps: one for his graphical experiments, the other for the finished result.Footnote 33 The publishing company eventually agreed and allowed Drude to send in his self-made sketches in 1877 (fig. 4), which Petermann corrected, synthesized, and published in the afore-mentioned journal, Petermanns Mitteilungen (Drude Reference Drude1878).
Detail of one of three of Oscar Drude's hand-sketched templates for his map Die geographische Verbreitung der Palmen auf der Erde printed in 1878. Unpublished, Archive of the Perthes Verlag (1877) (courtesy Universitäts-und Forschungsbibliothek Erfurt/Gotha, Sammlung Perthes).

This episode is noteworthy. First, it gives some insights into the status of maps within plant geography up until the 1880s. Now and then maps had been drawn by great authorities, but map-making was far from being a regular part of the botanical curriculum. Secondly, this contact was the starting point for a collaboration between Drude and the Perthes Verlag that would last for decades, as a result of which Drude became the cartographical expert he was regarded to be fifty years later. Shortly after Drude had designed his palm-map, the elderly Grisebach quit his consulting activity for the company, recommending Drude as his successor. Apart from the examination of articles and maps, this assignment also included yearly reviews on plant geography for a broader geographical audience of the company's journals. Drude agreed.Footnote 34
Thus, within a year, the cartographical amateur Drude found himself an associate of the world's leading institute for map-production. The following years remained very eventful for Drude. First, he was appointed to the newly founded chair of botany at the Technical University Dresden (I will return to this topic), then he was roped into one of the publishing company's most prestigious projects at that time: a new edition of the physical atlas. Since Grisebach had died and Drude was the only expert in sight, he was asked in 1882 to edit the section on plant distribution. He agreed, although, once again, was not sure if he could contribute to the project successfully.Footnote 35
To bridge the gap between Drude's lack of experience and the high standards of the publishing company, he received what could be called a “cartographical correspondence course,” and during this course many people came to shape the later botanical section of the atlas (Drude Reference Drude1887). Above all, the editor, Hermann Berghaus (a nephew of the former editor Heinrich), had a strong impact on the young botanist. Berghaus had formulated an outline for the new atlas, which treated both editorial and conceptual concerns.Footnote 36 The comparability among all sections should be ensured (for example by equal projections) and all sections should appeal to a broader, non-specialized audience. Furthermore Berghaus challenged a deep-seated cartographical convention: the Mercator-projection, which was popular among amateur cartographers and which Berghaus identified as the very problem of all contemporary thematic maps.Footnote 37 This outline had an impact on Drude from the beginning.Footnote 38 Shortly after he had agreed to edit the botanical section, Berghaus sent him seven map-sketches to make his expectations clear.Footnote 39 Over the course of the following month Berghaus pushed Drude from specialized botanical topics to more generalized geographical questions. This concerned the so-called “areal-maps” of particular plant orders (as Drude had designed them for the palms). In his first proposal Drude had intended to concentrate on this topic; four of the seven maps were to display the global distribution of taxonomic orders.Footnote 40 For Berghaus, though, this topic was far too specialized and after a meeting in Gotha Drude decided to condense these four areal-maps into a single one. Four maps of all continents later visualized the more regional distribution of plants, which probably was of more interest for geographers and amateur botanists.Footnote 41 The outline was modified several times.Footnote 42
Still, Berghaus’ influence rose the more it came to particular maps. In his letters, Drude mentioned his inexpertness in map-making several times. He had neither the artistic skills nor the instruments to realize complicated drawings.Footnote 43 Thus he delegated all topics that were not “botanical,” but “professionally geographical,”Footnote 44 to Gotha. This involved what Drude basically termed “matters of representation” (Darstellungsangelegenheiten):Footnote 45 color settings, additional contents on the map (contour lines, etc.) and the question of how much data should be visualized in detail. Berghaus should keep in mind the “botanical essence” of Drude's drafts, whereas he could “freely employ everything else at will.”Footnote 46 So Berghaus, for instance, successfully averted against the Mercator-projection which Drude had initially favored. Receiving the first maps in the new projection, Drude was surprised by just how much “space” he “gained” by this method (since the Mercator-projection enlarges the polar regions, being of less interest for plant geography).Footnote 47 Berghaus thus controlled the botanical section very directly: Drude received all his base maps from Gotha and, moreover, Berghaus selected all regional maps that Drude needed for his studies.Footnote 48
But Drude relied even more on Berghaus’ practical knowledge, since the botanist often could not cope with what he called cartographical “compression” or “aggregation.”Footnote 49 Already in his palm-map, Drude had asked Petermann to make two maps out of three by a cartographical synthesis.Footnote 50 Now he repeated this request several times. Thus, when he was faced with very complicated drawings, Drude sent in three to five maps – each addressing a specific question – and anticipated the synthesized result a few weeks later. Whenever he received one of these summarizations, Drude would be pleased with the look of the map and its clear “expression of my ideas.”Footnote 51
Even at home, Drude did not work autonomously. As it turned out, his wife, Lydia Drude, was much more experienced in map drawing than he was. Not only had she once received general training in drawing (which enabled her to help Oscar with all of the botanical illustrations he made during his career), her father had also been a land surveyor (Tobler Reference Tobler1933, 104–105). Drude wrote to his editor that he was “bravely supported” by his wife, especially concerning the many transcriptions from one map to another and complicated coloration.Footnote 52 As daylight – essential for charting – was rare during winter days and Drude also relied on it for botanical studies with the microscope, this support of his wife was essential.
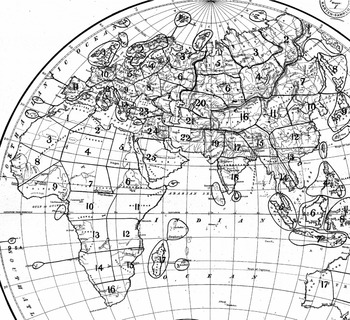
Other Perthes-cartographers changed the design of maps as well. After Drude had worked on the botanical atlas-section for two years, he was asked to pre-publish one of the maps on “floristic realms” in the journal Petermanns Geographische Mitteilungen, accompanied by an article on the subject (Drude Reference Drude1884). This pre-publishing was a common practice in order to test reactions within the scientific community prior to the actual publishing of the more expensive atlas. After Drude had sent the first sketches to Gotha, one of the chief cartographers, Bruno Hassenstein, took care of them.Footnote 53 Hassenstein was already experienced in thematic mapping and had worked in Gotha for such a long time that he excelled at the company's unmistakable way of map-making, the prominent “Perthes style,” like few others. He made numerous suggestions as to how the design of the maps could be improved: regarding colors, the width of particular lines, the general arrangements of different maps, etc. A kind of graphical ping-pong between Gotha and Dresden ensued. Drude sent Hassenstein sketches and described in letters his intentions (fig. 5). The cartographer answered and changed further details – it was precisely these corrections that he found in his mailbox in March 1884 (fig. 1). Drude's surprise at the new Totaleindruck of his own map, which was cited at the beginning of this article, indicates that the crash course in map-making concerned not only questions of style and “matters of presentation.” Instead, the map-making took on a graphical life of its own.
Detail of a hand-drawn sketch by Oscar Drude, marking the “areas” of particular plant orders with vegetation lines. The sketch was later revised and rearranged by Bruno Hassenstein (fig. 1). The base map coincidentally displayed the distribution of trade winds. Unpublished, Archive of the Perthes Verlag (ca. 1884) (courtesy Universitäts-und Forschungsbibliothek Erfurt/Gotha, Sammlung Perthes).

Although Drude largely depended on the graphical skills of professional cartographers, he also contributed indispensable knowledge to the maps. What Drude basically did and regarded as the “botanical essence” of his work, was to compare “vegetation lines” (Vegetationslinien).Footnote 54 A vegetation line marked the point from which a particular plant could be found in the field – the borders of its distribution area. One could determine these lines through field research, of course, by pacing the border along these lines. Yet, the more convenient and thus more common practice was to compare local floras, i.e. the enumeration of all plants within a restricted area. The data Drude accumulated by this method was mainly based on floristic research and was comprised of very heterogeneous material: travel accounts, local floras (often collected by amateurs), monographs on particular plants or plant orders, his own herbarium, and the oral reports of travellers. Only a few data were based on his own field-observations.Footnote 55
The specific advantage of the vegetation line was its seemingly inevitable continuity – it almost automatically standardized the heterogeneous observations. Drude could hardly ever determine the exact borders of a singular plant for whole continents, since some local floras were either untrustworthy due to allegedly inaccurate place descriptions or simply did not exist for particular areas. Nevertheless, he could at least “guess” (rathen) their probable distribution. Footnote 56 In fact, he regarded them as “approximative lines” (Approximativlinien).Footnote 57 He used transparent blueprints, which he applied to Perthes-maps, to experiment with specific lines, before he and his wife Lydia finally transcribed the guessed line on the valuable base maps.Footnote 58 When different observations for a particular region were contradictory or nonexistent, they followed the base map and there they tried to find natural boundaries like rivers or mountains – “just as the map demands.”Footnote 59
The cartographical lines they drew this way were not necessarily visible in the landscape: they could be lines of visibly unobtrusive plants such as, for example, mosses. Nevertheless, botanists could compare lines of different plants without ever having been to the place in question. In the map they then could identify patterns: for example parts of the map where dozens of lines accumulated. These accumulations were interpreted as the border of so-called “floristic” or “botanical realms.” Afterwards they could compare these lines with other thematic maps (for example from meteorology). This practice was not entirely new. Some botanists had worked with vegetation lines from the 1840s on,Footnote 60 but it remained unclear which physical factor (rain, temperature, soil) was responsible for differentiating these realms – and if the realms had any significance at all.Footnote 61 A further problem arose in connecting the vegetational lines and the physiognomically visible vegetation. The distribution of vegetation in turn could not be determined by consulting herbaria, but only by “direct” field-observation. European botanists mainly reconstructed the physiognomical outlook of a specific region by their own traveling or by reading travel accounts. But how could both domains – floras and vegetation – be synthesized?
Drude's mediating tool was a map, but a particular one with a specific scale. Whereas the floristic world-map differed from the vegetational world-map in the atlas, in the borders of their fundamental units (“realms” and “zones”) continental maps proved to be more adequate for making the comparison. Drude had at first not intended to draw continental maps at all, but after his editor Berghaus had convinced him, he began his work with Europe, the continent whose botany was best known (fig. 6). The large scale of the European map enabled Drude – and Berghaus – to combine many botanical phenomena on one map, allowing them to examine all at once problems that otherwise would have been separated: floristic and vegetational distribution, phenology (the flowering of plants in each region), and dominant crop plants. During these days Drude drew so many vegetational lines that they actually followed him in his dreams and – as he wrote to Berghaus – returned there as graphic tangles.Footnote 62
Detail of an uncolored proof sheet of Oscar Drude's “floristic map of Europe” (Florenkarte von Europa) with important vegetation lines and contour lines (published in 1887). Unpublished, Archive of the Perthes Verlag (courtesy Universitäts-und Forschungsbibliothek Erfurt/Gotha, Sammlung Perthes).

Drude recognized at some point in his drawing experiments that the larger scale produced a geographical division of the continent where the distribution patterns of flora and vegetation became similar. There turned out to be geographical units, “regions,” which were the subunits of both: the floristic “realms” and the vegetational “zones.” When he published the atlas, he informed the audience what these regions precisely were: a synthesis of field and cartographical observation.
A vegetational region is therefore a part of a zone-division, which is demarcated by the accumulation of specific vegetation lines. Within a region there prevails a continuous floor-covering, with the domination of one or more “formations” [for example wood, moor, steppe, etc.], which are in turn closely connected to one or more coinciding periods of vegetation. (Drude Reference Drude1887, 4)Footnote 63
Even if it were impossible to decide whether a cartographical line was “specific” to a landscape without observing it in the field, one would not be able to define the borders without the cartographical accumulation of lines. Such maps allowed Drude to synthesize “what in nature is also never separated”Footnote 64 (ibid.) – flora and vegetation – which had been discussed separately among plant geographers for decades. Due to the work on his European map, he applied this regional approach to other continents. As he informed his editor, this map served as a “paradigm” or a “model” for all other continental maps.Footnote 65 Even though the botanical knowledge was still lacking in order to subdivide continents like Africa adequately, the cartographically synthesized “regions” of Europe pointed to what was “desirable” for the rest of the world (ibid., 5).Footnote 66
Historians have attributed to Drude the methodological synthesis of three hitherto separate topics as his major contribution to scientific ecology: environmental conditions, physiognomical “formations” (such as woods, moors, or steppes), and the distribution of taxonomic orders (Trepl Reference Trepl1987, 135). Historiographically, however, it remained unclear how such a complex synthesis could be effected in practice. Drude's early cartographical works indicate that his “thinking-together” was to a great extent a “drawing-together” of complex data (Latour Reference Latour, Lynch and Woolgar1990). When he received a summarized world-map of the physiognomical “zones,” he was even surprised to see the similarities with the earlier floristic maps that had now become visible:
It is very instructive to see how many [vegetational] zone-borders have simultaneously become barriers of floristic realms, respectively regions; it appears to me that the key to an appropriate understanding of plant geography is not to separate the physiognomical and systematical relationships of flora from one another (respectively to unite it in each case on separate maps), at least if it can be done without too much forcing the point. Had, for example, our fame-worthy and adored Grisebach done the same, much in his Vegetation der Erde would have been more accurately understood from a botanical as well as a geographical perspective.Footnote 67
But Grisebach never had the chance to work so closely together with the publishing company's cartographers. Drude's synthesis, by contrast, was highly shaped by the editorial program, the graphical skills, and the publishing interests of the Perthes Verlag. Drude had decided to draw continental maps in the first place due to his editor's Berghaus influence. The graphical standardization among all atlas-sections also assured the easy comparability of maps. Drude wrote that his maps should be “attached” to the meteorological, geological, and animal geographical maps in the atlas (Drude Reference Drude1887, 1); the convertibility of environmental factors and plant distribution was significantly facilitated by this standardization.
There is strong evidence that Drude did not fully recognize the expanded epistemic value of botanical maps until he worked on the atlas. When he had finished his first map on palms in 1877, he still regarded the visualization as subordinate to his text. His treatise would use the map “only” as a “medium of demonstration” of what had just been written.Footnote 68 Seven years later he was pleased and thanked the publisher that he could now “express” himself “so comprehensively through maps and text about what I had to say.”Footnote 69 When he began to write a handbook on plant geography, published three years after the atlas, the map-text-relation had actually reverted. It was to become a “broad text based on the atlas-maps.”Footnote 70 Thus, not only did all his later, major works contain maps like, for example, his book on German plant geography (Drude Reference Drude1890), renowned for being one of ecology's founding studies, but he used maps as an evidence-generating tool in his texts as well, for instance by advancing arguments with specific vegetation lines as evidence, and declaring the cartographically derived “regions” as the “natural units” (natürliche Einheiten) of plant geographical research (Drude Reference Drude1890, 330–331). In one of his first articles that made use of the word “ecology” in the title, Drude emphasized that plant geography could contribute even more to the new science if it further improved its cartographical accuracy:
Botanical geography is occupied with making clear in separate, experimental works, the connection between landscape and formation, and, by imitating geology in the publication of special maps, a long-felt need is being satisfied. Such actual accomplishment counts for a great deal in a field where our wish to make clear the cause so far outstrips our ability to do so, for we must not forget that in all other special scientific branches the final aim lies before us much more clearly than in ecology. (Drude Reference Drude and Rogers1906a, 188)
It was exactly this ability of maps to give a “broader view” of earlier botanical observation that Drude regarded as geobotany's main contribution to ecology. Whereas the “organic science” always had to handle with “separate bits of knowledge,” geographers tended towards universalization: “The tendency of ecology to accumulate minor details obstructs the broad view towards which it has painfully toiled, until the introduction of the freer methods of geography aid it in uniting the results of divided efforts” (ibid., 187). The fusion of “organic science” and “geography” into “ecology” may appear nebulous at first sight. But seen from the perspective of Drude's personal experience, this fusion was a very concrete enterprise, strongly shaped by his contact with the Perthes-cartographers and their skills in handling the synthesis of diverse observations as an everyday practice.
There are plenty of such indications in Drude's letters that during his map-making in the 1880s, he first recognized many relationships that were to become integral parts of his “ecological” theories after the turn of the century. His ecology, however, was by no means an exclusive outcome of paperwork: Instead, his ecological perspective did not take a definite and articulated form until he applied his newly learned cartographical skills to a concrete territory.
Enlarging the Scale: Applied Botany in Saxony
In 1884, shortly before the publication of the maps on “floristic realms” (fig. 1), Drude asked the Perthes Verlag to do him a favor. He had committed himself to giving a talk on the subject at a regional society of natural history, the Isis in Dresden. In order to “arouse the interest of wider circles,” he wished to present his maps on this occasion. “Should it be possible,” asked Drude, “that I receive a print (or even a pre-print) of the 3 maps of the supplement until then in order to submit them there? It would suit me most agreeably.”Footnote 71
There is no doubt that maps were an adequate medium to explain his complex botanical studies to a non-specialized audience, and Drude often resorted to his maps on similar occasions in the following years. However, what may appear as a typical act of one-way “popularization” – an elite botanist displaying results to amateurs by the intelligible medium of the map – turned out to be a considerably more dynamic interaction between speaker and audience. As ought to be shown in this section, the members of this particular Isis turned out to be an indispensable reservoir of botanical observers, enabling Drude to realize much of his subsequent plant geographical research. In the course of this interaction maps became an important tool to organize the regional botanical network. Not until then did ecological questions appear on Drude's research agenda.
When Drude gave his talk on “floristic realms” to Isis members, he had already spent five years doing botanical activities in Dresden. Drude was appointed to the newly founded chair of botany at the Technical University Dresden in 1879. When he arrived at Saxony's capital, it seemed to him that the local botanical infrastructure was misguided. The beds of the botanical garden were “badly arranged” and the greenhouses inadequately heated (Drude Reference Drude and Dänhardt1926, 165). Some work had already been done to explore the regional plant life (mostly by amateurs),Footnote 72 but still the knowledge of Saxony's flora was sketchy. In his eyes, the same was true for the dominating methodological approach: it was ruled by systematics, which for Drude, was nothing but a useless accumulation of decontextualized plants.
Drude came to Dresden shortly after the Könglich-Technische Bildungsanstalt had become a Polytechnikum, and a few years later a full university.Footnote 73 His appointment was an attempt by the state of Saxony to professionalize this already existent but uncoordinated amateur science and to transform it into a servant of state interests – a situation similar to that of agricultural colleges in Germany during that time (Harwood Reference Harwood2005). Drude had to mediate between university and government from the beginning. Since the botanical garden had just been transferred from the medical academy to the state (not, as one might have expected, to the university), Drude was simultaneously a “regular” professor and a public servant. The university, for its part, expected him to speak to a rather unusual audience (Tobler Reference Tobler1932, 12–15). He had to train future school teachers, engineers, and chemists. His first lectures, therefore, dealt with concrete botanical problems: botanical raw materials (Schwede Reference Schwede1932, 22). The state in turn expected Drude to establish the so-called “applied botany.” He was to link the garden to local agriculture and horticulture, and open it to the public (Drude Reference Drude and Dänhardt1926).
Thus, in the first years of his professorship, when Drude updated the botanical cartography at the Perthes Verlag, he simultaneously organized Saxony's botanical institutions, its community, and its objects according to the principals of plant geography.Footnote 74 First, he rearranged the garden and, already for this purpose, his maps became an important model. Its public sites became among the first in central Europe that integrated plants into landscapes from all over the world rather then displaying them systematically.Footnote 75 Drude would enlarge the garden with physiological research beds, “experimental stations for cultural plants,” and beds for the breeding of indoor plants. New gardeners would be employed especially for this latter purpose and small branches of the garden would be built in Saxony's mountainous regions (Tobler Reference Tobler1932, 13). When he presented the new garden sites to a group of interested citizens soon after the re-opening, he asked them to emulate his cartographical gaze: by guiding the audience to a heightened viewpoint at the top of the Alpinum, he explained the thus visible “floristic realms” that now structured the garden site – just as they did in his maps (Sitzungsberichte 1892, 5).
Besides the university, Drude immediately integrated himself into the non-university scientific infrastructure after his arrival and joined two local societies of natural science: Flora and the already mentioned Isis (for the prehistory of the ISIS, see Phillips Reference Phillips2003). Not only did he represent both the university and the state within these societies, he actively participated, and the societies played an important role in realizing his reorganization of Saxony's botanical community. Whereas the botanical society Flora was primarily of interest in order to connect the university's botany with all botanical domains concerning horticulture,Footnote 76Isis turned out to be quite helpful in carrying out plant geographical research.Footnote 77
During his first Isis-session, Drude was immediately voted chairman of the botanical section. He quickly began to instill into the members the most recent map-based practice of plant geography, which he simultaneously professionalized due to his collaboration with the Perthes Verlag. Shortly after his election, Drude gave a talk on the technique of “vegetation lines” and their practicability for regional plant distribution studies (Sitzungsbericht 1880, 18–19). He also tested a laterna magica in order to facilitate more visual demonstrations in future lectures (Sitzungsbericht 1881, 14). The members quickly took to the visual-cartographic fondness of the new university professor and followed his insistence on complementing their studies with maps. Already in 1883, for instance, a school-teacher used maps when talking on the plant geography of Norway in front of the Isis-members (Sitzungsberichte 1883, 13). Soon, an increasing number of map-complemented local floras of Saxony's territory were discussed in the Isis.Footnote 78 Eventually, Drude would prepare the members for collective field excursions with his own Perthes-maps.Footnote 79
By that time, maps had become a rather fashionable tool within the Isis. Already before Drude's arrival, maps had been used in other sections like geology.Footnote 80 During the following decades, distribution maps on regional topics – such as Saxony's anthropology, population, settlement history, medical topography, ornithology, etc. – were discussed at Isis meetings (as a case in point, see Wiechel Reference Wiechel1904). These studies often came into print in the society's proceedings, but some members also contributed to the Petermanns Mitteilungen. By the turn of the century, Drude could attend a meeting of nearly any section to compare his map-research on plant distribution with other fields of study such as, for example, zoology (Sitzungsberichte 1896, 25).
This map-circulation, however, was not limited to final acts of presentation. During his work on the atlas, Drude had already learned that maps could serve as a tool to standardize heterogeneous observations from different sources. Combined with the co-operative-minded Isis audience, the “synthesizing” ability of the Perthes-cartographers now became an adequate technique for Drude to mobilize the members in an organized manner. He basically repeated what he had done on the atlas-maps: accumulating multiple data that was to be synthesized cartographically later on. The main difference being that he both commissioned and standardized the observations on his own.
From the very beginning Drude announced several plant geographical enterprises in collaboration with the Isis. In his first session as a chairman of the botanical section (and again three years later) Drude called on the society's members to aid him in the observation of the regional phenology, i.e. the seasonal life cycles of Saxony's plants (Drude Reference Drude1880, 15; Sitzungsbericht 1883, 41–45). Phenological observations had been carried out since the eighteenth century, especially at botanical gardens, but Drude wanted to expand the places of observation on the state's territory in order to synthesize them later on. The synthesis was to serve economical purposes. The regional “phenological phases,” especially the first flowering of specific plants in spring, was important for public agriculture in determining the optimal date for sowing crops and was supposed to improve the acclimatization of plants to local climatic and soil conditions (see Ihne Reference Ihne1909).
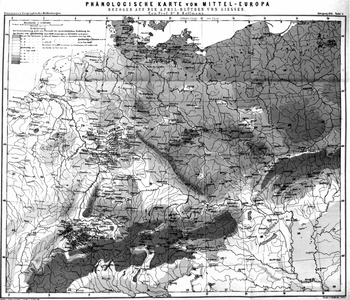
The idea for this project was linked directly to recent map-productions by the Perthes Verlag. Drude was inspired by his colleague Heinrich Hoffmann in Giessen, who published a phenological map of central Europe in the journal Petermanns Mitteilung at that time (Hoffmann Reference Hoffmann1881). Hoffmann's map displayed the flowering of plants in spring in relation to the city of Giessen (fig. 7). He had observed the initial flowering day in Giessen and had compared the regional variation with reports of other observers. Giessen was the basis of comparison in Hoffmann's map and the time of flowering was visualized in daily incremental steps by coloration. All places with the same date were colored white; rosa-red colors indicated an earlier flowering; green was used for later dates. A study of this map demonstrated to Drude that the data concerning Saxony was incorrect in many cases, because Hoffmann had just reverted to a few local observers (Drude Reference Drude1881, 7–8). What Drude therefore needed was an evenly-spaced grid of local botanists, akin to the already established meteorological stations. Otherwise it was impossible to observe a nearly simultaneous event at different places (Drude Reference Drude1880, 16). “Even for a smaller and fragmented highland and hill country, such an important map can only be obtained by the co-operation of many like-minded people based on easy enrolment” (Drude Reference Drude1892, 105).Footnote 81
Hermann Hoffman's phenological map of Central Europe, which outlines regional variations of the flowering date in spring by different depths of color in comparison to the city of Giessen. In this reproduction in black and white, darker inking indicates mainly a later flowering date. From Hermann Hoffmann, Vergleichende Phänologische Karte Mitteleuropas (1881).

Drude was confident that the Isis and its “observation-keen disciples of the scientia amabilis” would support him (Drude Reference Drude1881, 3).Footnote 82 He therefore formulated detailed instructions for how, and by which features, the phases of flowering should be described. He also defined 35 crop plants and 80 “natural” plants (mostly physiognomically important “character plants”) as observational objects (see ibid., 9, 12, 20–21). If a particular plant was missing at one station, he even offered to send it over. To unify the descriptions he had a tablet printed for standardized recording of these observations. The place and year of the particular observation had to be inscribed on each page. He sent instructions to 33 Isis members and just two of them did not answer the call (Sitzungsbericht 1883, 41). However, this network did not consist of university-trained botanists. Among others it consisted of, again, his wife, foresters, school teachers, pharmacists, engineers, two owners of manors, professors of agriculture, and gardeners (Sitzungsbericht 1883, 42–43). Two years after his call, Drude was able to inform Isis that “nearly all” observations were “usable” for further research due to the unified scheme (Sitzungsberichte 1883, 41).
From the very beginning, the goal of these phenological observations had been a map:
If the numerous observations will be carried out for years . . ., so that one can deduce quite reliable averages, the differences in developmental periods between the stations . . . must be visualised cartographically and be compared with a map of temperature; the result will be a cultural map, which will speak most intelligibly to everyone and will be of true relevance for national economics. (Drude Reference Drude1880, 15)Footnote 83
The phenological map took form during the following decade. In 1892 Drude not only informed the Isis members about the results of the “phenological observations according to a collective concept” (Drude and Naumann Reference Drude and Naumann1892). He also gave a talk at Saxony's economic society and presented to the audience a map of the onset of spring in the territory (Drude Reference Drude1891–92).
Whereas this phenological research should quickly clarify the public value of plant geography, Drude also traced a map-complemented long-term project, which again depended on the active Isis support. In his first introduction speech in 1880, Drude announced the compilation of the first modern “Flora Saxonica” (Drude Reference Drude1880). This enterprise was partly financed by the government and embedded in the “systematical research on the state territory” (systematische Landesdurchforschung). What Drude had in mind was more than an enumeration of all plants within Saxony. Rather, the new flora should take into consideration “biological” phenomena as well – and this meant to him: plant geography. His goal was to describe exactly all of the formations in the territory (woods, heath-lands, etc.).
Therefore, as Drude informed the Isis audience, new herbaria had to be built at the garden. Besides the already-existing collection a special herbarium ought to be established, consisting of plants from Saxony exclusively. Additionally, a so-called “formation herbarium” was to be designed that would contain only the physiognomically important species of the plant geographical formations, serving as a teaching instrument (for this new kind of herbarium, see Schorler Reference Schorler1907). He naturally needed plants for these herbaria and he encouraged the society members to actively collect plant specimens (Drude Reference Drude1880, 13, 16). In order to avoid the continuation of disparate collecting practices among the amateurs, Drude distributed a formula that required the collectors to record the exact place of discovery. The members were to send in all local plants of interest for the “Flora Saxonica” fitting this scheme. The garden also systematically bought private herbaria and plants offered by plant exchange societies.Footnote 84 This process of accumulation lasted for decades and was supplemented by Drude's own excursions. It was based on the idea that all participants should collect and send in their material in a form that could later be processed cartographically: “It goes without saying that the systematic botanical researches on state territory must finally lead to cartographical syntheses” (Drude Reference Drude1900, 26).Footnote 85 Thus, an accurate description of the place of discovery was mandatory, and only places to be found on a map should be registered (Schorler Reference Schorler1915, 107). Hence, the “herbaria of Saxony” in Dresden not only consisted of plants alone; dozens of maps, along with other media like photographs, accounted for an important part of the collection (Schorler Reference Schorler1894, 61; Drude Reference Drude1915, 78).
The local botanists were not only instructed to keep in mind the future “mapability” of their collections: Drude also recommended that they use accurate maps in the field. This agenda was soon feasible. At that time, on behalf of the treasury department, the state of Saxony was surveyed in the new high resolution scale of 1:25,000 (Torge Reference Torge2007, 271–275), and already in the mid-1880s, Drude received a complete edition of this map for his botanical garden (Drude Reference Drude1885, 86). Later, when the respective sections of the ordnance map were even more accessible in schools and local societies, Drude and his employees encouraged the collectors to use them as a research tool in the field (Drude Reference Drude1915, 98; Schorler Reference Schorler1915, 101–103, 108):
One can hardly overemphasise how much a botanist gains by using such accurate maps in his research and how, in the first place, it enables him to bring together at once a series of singular facts that he had observed before; just think of how much plant geography must develop scientifically according to the topographical image of the world. (Drude Reference Drude1885, 86)Footnote 86
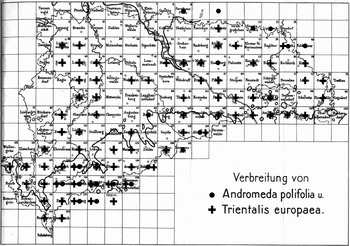
Over the years, the sections of Saxony's ordnance map evolved into a grid by which Drude and his employees organized spatially their observations and the objects that reached the botanical garden in Dresden. In 1915, Drude and the curator of the herbarium, Bernhard Schorler, finally published the grid-map as the definitive spatial guideline for collectors (fig. 8). They also marked single plants with a cross, thus displaying the sections where a plant had been found. This map was intended, first of all, to make visible “at a glance” the distribution patterns of particular plants. Furthermore, botanists should investigate whether the uncrossed gaps in the map corresponded with their knowledge of the local plant life (Drude Reference Drude1915, 98). Thus, this system was simultaneously a social tool to mobilize future research.
Grid map of Saxony's territory. The regional distribution of two plant species was marked by crosses and dots. From Bernhard Schorler, Zur Feststellung der geographischen Verbreitung (1915).

Grid systems were by no means Drude's invention. The Victorian botanist Hewett C. Watson had already established a similar “vice-count system” for the British Isles from the 1840s onwards (Watson Reference Watson1847–59, 1:10–14).Footnote 87 Hermann Hoffmann, whose phenological mappings had already served as prototypes for Drude's flowering studies, had parcelled out the territory of the Central-German state of Hesse in the 1870s (Hoffmann Reference Hoffmann1879).Footnote 88 A similar plant cartographical inventory had also taken place in the state of Württemberg by the turn of the century.Footnote 89 For Drude, however, the application of the ordnance maps was not limited to the inventory and the spatial control of field collections. They also became a companion to his studies in situ. Since the 1890s he personally used these maps in order to chart the landscape of some parcels. It was due to this enlargement of scale that ecological aspects explicitly appeared on his research agenda and became cartographically visible.
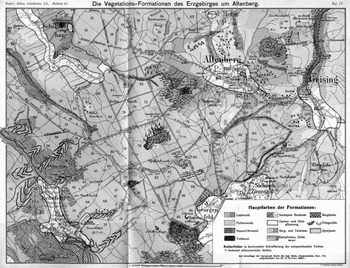
Since even Drude and his employees could hardly chart the whole plant life of Saxony alone, they concentrated on selective field studies, spot tests, which were close to the town of Dresden. Accompanied by numerous Isis members, they intensively botanized the mountainous regions around Dresden for several summers (Sitzungsberichte 1892, 6; Drude Reference Drude1898). Already in the mid-1880s Drude published the results of these excursions in the society's proceedings (Drude Reference Drude1885). A decade later Drude reformulated a “sharper version” of the former article, containing a first map of a particular area with a scale of 1:135,000 (Drude Reference Drude1895). Then he cartographically zoomed in more closely. Again, ten years later he published three maps of particular localities, which used the particular ordnance section at a scale of 1:25,000 as a base (fig. 9). In this map the plant geographical “formations” were variously colored; the vegetation lines and some peculiar locations of “characteristic plants” were marked by symbols.
Oscar Drude's map of “vegetational formations” near Dresden (Die Vegetations-Formationen des Erzgebirges um Altenberg). Important landscape physiognomical “formations” were displayed by different colors and symbols. From Oscar Drude, Die kartographische Darstellung mitteldeutscher Vegetationsformationen (1908).

It was precisely in the context of these map-supported, local “area studies” based on collective excursions that Drude used the term “ecological” for one of the first times in his writings (Drude Reference Drude1898, 90). He soon recommended the practice of using maps with small scales, i.e. 1:25,000, to other botanists – especially in case they wanted to study ecology in the field (Drude Reference Drude1908; Drude Reference Drude1915, 98). By using such maps in high resolution and adapting his color scheme the botanist was namely “forced” to enlarge on the “proper external parameters” as, for example, soil conditions (Drude Reference Drude1908, 12).Footnote 90 Whereas maps with a scale of up to 1:200,000 – as he had used in the atlas – were now primarily a “clear measure for representation” (übersichtliches Hilfsmittel) that to him would still reflect the scientist's “thought” (Drude Reference Drude, von Wettstein and Wiesner1906b, 429), high-resolution maps permitted an epistemologically more accurate “ecological” comparison. The map with a scale of 1:100,000 or less “really guides us through the landscape and, back in the study, enables comparison with other landscapes of the same floristic region and even permits ecological comparisons concerning specific questions in remote regions of the earth” (ibid.).Footnote 91
Not coincidentally, Drude referred to the map as an active force. He believed that these small-scale maps clarified the “positive understanding” of ecological formations without requiring interpretation: “one can say that through topographical surveys the definition of formations will be clarified by themselves, since the map, with its striking, geographically-caused traits, demands that one overlook some smaller features and recognise – in its great lines – the causal coherence of the vegetational image which is stretched out in front of us” (ibid., 432).Footnote 92
In Drude's eyes, the probability of errors would necessarily decrease in such small-scale maps, since the graphical “fundament” of the ordnance section would still “dominate” the map (Drude Reference Drude1908, 12).Footnote 93
Regardless of such epistemic promises Drude, in fact, still depended on his employees and the local members of the Isis as soon as it came to such concrete mappings. “Surveys” of that kind, he wrote, would still “require a familiarity with particulars that a single person is hardly able to secure” (Sitzungsberichte 1900, 5).Footnote 94 This was especially true for his local-ecological plant mappings. Thus he explicitly thanked several Isis amateurs who had accompanied him during his summer excursions. Due to their local knowledge, Drude pointed out, he had been able to chart the particular localities in the first place (Drude Reference Drude1895, 39–40).
Even though the later synopses of Saxony's plant life appeared exclusively under Drude's name, he left no doubt that they were an outcome of a collective enterprise. Already in the 1890s Drude mentioned his regional network as an empirical basis, when he described the plant geography of all of Germany (Drude Reference Drude1896, V), an enterprise that has been described as one of the earliest and most foundational studies of ecology.Footnote 95 In 1902 he published a description of the plant geographical unit that Saxony was placed in, the “hercynian district” north of the Danube and east of the Rhine (Drude Reference Drude1902a). In this study, comprising nearly 700 pages, he described all vegetational formations, distribution areas, vegetation lines of important “indicator plants” and phenological phases in Saxony and Thuringia. He contributed nearly a dozen maps. Small maps displayed different localities, and the last one synthesized the general distribution patterns. And it is precisely this enlargement of scale that could be realized with this collective observation and accumulation of plants supported by the Isis.Footnote 96
Although the local distribution maps were published by competing companies within Saxony, Drude's tie to the Perthes Verlag was never severed during these years. Interestingly enough he used a Perthes-map, when he published his overview-map of the “hercyian district,” even though the work was printed by a competing publishing company. The exact causes for this choice remain unclear, but it may have been due to Drude's personal opinion that this particular publishing company was a predestined place to recapture on overview of the long-lasting and fragmented field studies. And although Drude constantly enlarged the scale of his botanical maps by the turn of the century, he reminded his audience never to lose this overall sense.
In 1888, when he presented the first results of the collective observation in Saxony, he namely described them to the audience as a cartographical “zooming-in” (Drude Reference Drude1888a, 59–60). He referred to the section he had just published in the atlas in order to describe the plant geography of the entire world. He then “zoomed in” on Europe and its main plant geographical regions, again subdivided into smaller “districts.” Saxony could thus be identified as part of the “hercynian district.” Before he described its borders by comparing vegetation lines, he reminded his audience how important this overview he just gave had been: “the flora of Saxony and Thuringia can only be understood correctly if one keeps an eye on the flora of the adjoined areas” (ibid., 60).Footnote 97
Drude had learnt to “keep an eye” on the big picture during his work for the atlas. After enlarging the scale to particular localities during his Dresden years, he emphasized that neither the former plant geography nor the new science of ecology should get lost in details, for example by exclusively charting particular localities (Drude Reference Drude and Rogers1906a, 187–188). Instead, both fields of research should always keep in mind the practice of the cartographer to synthesize local details in large-scale maps (Drude Reference Drude and Alberhalden1932, 19–23), a practice he had first experienced in collaboration with the Perthes Verlag. Footnote 98 Scaling up and down, in that sense, was for Drude the appropriate link between plant geography and ecology, a gap that he daily crossed in the scientific milieu of Saxony.
No matter how deeply Drude's mapping practices were grounded in the academic and popular milieu of Saxony and Thuringia, his approach quickly shaped the research techniques in plant geography and ecology on a much wider geographical level. Already in the 1880s, Drude encouraged other botanists in Europe and the United States to participate in the improvement of world-wide plant cartographical knowledge. After positive reactions to his atlas on plant distribution (see, e.g., the review Engler Reference Engler1887), he sent his maps to other botanists, e.g. Charles Flahault in Montpellier, in order to provide them with a graphical prototype for their regional mappings.Footnote 99 The Danish botanist Eugen Warming, whose Plantesamfund became the most prominent founding study in plant geographical ecology (Warming Reference Warming1895), carried around Drude's book and map on the “floristic realms” (fig. 1) while botanizing in Greenland.Footnote 100 Fellow botanists called Drude's attention to numerous errors in his maps concerning particular areas, sometimes integrating small sketches in their letters to rectify the distribution of some vegetation lines.Footnote 101 After Drude had been excoriated on the lack of perfection in his South American atlas-map, he replied that the state of knowledge was naturally tentative. He demanded that his colleagues contribute more floristic and cartographical details to his model-map: “Let us work on it together!” (Drude Reference Drude1888b, 291).Footnote 102
The number of botanical maps grew explosively from the 1890s onward.Footnote 103 Simultaneously Drude reiterated his earlier personal appeals for a graphical standardization of maps and spatial collecting practices.Footnote 104 He had been giving talks on these topics at national and international botanical and geographical congresses since 1895, mostly using his atlas-maps and his maps of Saxony as a model for adequate coloring (the most important aspect of standardization), but also for modeling other matters of display, projection, and scale.Footnote 105 Other researchers ought to adopt his cartographical zooming-in in order to gain unbiased results:
The cartographical method and representation is the last, indispensable complement of special studies in vegetational formations. The great plant geographical overviews on the whole earth depict the most striking as well as physiognomically and ecologically intelligible and remarkable; in national floras one must more carefully pay attention to the subtle traits of the formational image, but the cartographical survey of a particular landscape has to master all the questions that could possibly arise; the map forces the florist into the ultimate decision in situ. (Drude Reference Drude1908, 11)Footnote 106
Drude was highly successful in this regard and had a huge influence on mapping becoming an established part of field observation after Word War I.Footnote 107 When Frederic Edward Clements published his outline book on the Research Methods of Ecology in 1905, it already contained a section on maps – and Clements referenced many of Drude's cartographical studies on plant distribution (Clements [1905] Reference Clements1977, 183–187, 326). From 1896 onwards, accompanied by Adolph Engler,Footnote 108 Drude edited the ambitious plant geographical series Die Vegetation der Erde, which in 1923 had reached 15 volumes. Drude's contribution was the already-mentioned study on the “hercynian district” (Drude Reference Drude1902a). With this much-cited series the editors forced the standardization of the graphical language within botany – and, thus, the cartographical calibration of the period eye – probably more than any official proposals at congresses or written instruction could have accomplished. Here, the reader could find examples of plant geographical maps on nearly every scale, reaching from whole continents and national floras to regional and local mapping. From now on, even local field botanists could basically find their own location on maps of each scale, from the world map, switching to the continent, moving forward to a national map, getting to the specific floristic region and even forward to the town and the fields close to where they lived.
Conclusion
During his work with maps Oscar Drude's eyes progressively opened more widely, so to speak, discerning new facts and principles. Before his collaboration with the Perthes Verlag, he had seldom worked with maps and only after his gradual initiation into the graphical universe of map-making did cartographical observations emerge as an increasingly important and autonomous domain of his plant geographical studies. By cartographically zooming in on the territory of Saxony, even “ecological” relationships became visible to him in maps. Maps, therefore, proved to be a crucial technique within plant geography for him and eventually for ecology. Mapping, as Drude successfully predicted, was to become a standard tool of botanical observation.
At first sight this upgrading of maps as an indispensable research tool for botanists may appear as a single-handed achievement, emanating from the lonesome study of the academe. After a close analysis of Drude's scientific life, however, this shift turns out to be highly entangled with trends in the German commercial cartographical market and was also socially grounded in the milieu of “popular” botany at that time. The increasing importance of maps in his botanical studies was to a great extent an outcome of popular visual culture in Imperial Germany. Cartographers, with their practical abilities to synthesize multiple observations, became both irreplaceable assistants as well as role models to the botanist Drude, teaching him how to process huge amounts of data in a scientifically “sound” manner. When Drude subsequently applied his newly acquired cartographical skills to reorganize Saxony's scientific infrastructure, its collections, and networks of observers, this expansive research milieu shaped his practice of map-making considerably. The enlargement of map-scales up to particular localities, where ecological relationships became visible to him, was only feasible because Drude modulated his practices according to the social needs and material conditions of his local scientific milieu.
Drude therefore emphasized that each botanical mapping should be adapted to local requirements (Drude Reference Drude1900, 31). The decision for the “smallest scale required,” for instance, should largely depend upon the accessible ordnance maps. The best coloration was to match with the regional plant life. Yet, such position-dependency, as I have shown, is no less important as regards our own historiographical decision on the adequate scales of description. This article aimed to describe the case of Oscar Drude in order to highlight just how much his particular map-based way of practicing plant geography was shaped by regional geographies of knowledge. Due to his influence on the scientific community, Drude is, in many respects, a representative case for the mapping impulse in Central-European botany at the turn of the century. Contemporaries knew that by that time Germany became an epicentre for a “methodological” expansion on maps in botany (Eckert Reference Eckert1921–25, 2:393) and Drude, certainly enough, was here an influential figure, not least because of his international networking and his close connection to the Perthes Verlag.
This is not to say that one can reduce the regional scale to a global level or generalize his particular case without any distortions. Some plant geographers, especially with a physiological background, did not use maps at all; other contemporaries applied botanical mappings in quite different – local, regional, or global – geographies of knowledge. Adolph Engler at the national botanical garden in Berlin, for instance, used maps in a more colonial milieu; Charles Flauhault's mappings were grounded in the particular milieu of agricultural science in Montpellier; Frederic Edward Clements at the University of Nebraska simultaneously began to zoom-in even more closely. Although Drude was closely connected to these scholars, the appropriate historiographical scale to describe their respective research milieu would have to be a different one. This article thus suggests that it is indispensable for historians to find new and appropriate scales of descriptions in order to rethink common narratives within the history of plant geography and particularly of its influence on ecology, which – as Drude's case has shown – was more a by-product rather than the teleological goal of his mapping activities. Such a practice-based perspective may therefore help us to better understand how and why in certain geographies of knowledge even old research techniques could unfold such innovative social and epistemic dynamics, as mapping did for late nineteenth-century plant geography.
The old medium of the map was in many ways an unpredictable one for Drude. This was not just the case when he found the map on “floristic realms” in his mailbox in March 1884. The surprise about their epistemic and social possibilities traverses most of his letters and writings. His surprise reminds us that the “invention” of a particular scientific practice like mapping is just the starting point for a dynamic and often unforeseeable history. Discussing the afterlife following of a medium's invention – such as its accessibility, its circulation, and its application to new scientific settings – helps us to historicize more adequately its actual role as an epistemic practice in a long-term perspective. Although some outstanding plant- and biogeographers had already used maps as a research tool since the early nineteenth century, it still took what were decades until mapping became a widely established practice of observation, collectively shaping ways to reflect on plant distribution. This cumulative scaling of the discipline's period eye was not turned into practice until the late nineteenth century – and to a great extent, it was the outcome of a particular milieu of knowledge production in which scholars such as Drude had practiced botany since the 1870s.
This scaling was by no means limited to a well-defined group of scientists and Drude was well aware of the observational collectiveness as its base. After he had received the final atlas-version of the maps on “floristic realms,” he repeatedly implored his editor to delete his name from the map-legend. Earlier, the editor had reinterpreted and synthesized his former sketches several times, so Drude felt that his name was ultimately dispensable.Footnote 109 This statement was to some extent meant to be coy and flatter the editor, of course, and Drude was far from interrogating the postmodern question of authorship. Nevertheless, this modesty was also a consequence of his daily experiences. Such finished maps, then, not only made visible to him new patterns of distribution, they also made invisible the many contributing hands that helped him produce his work: for instance, field collectors, curators of herbaria, colorists, engravers, cartographers, and even his own wife. Drude was by no means the powerful puppeteer behind the scenes, manipulating these hands at leisure with a master plan in his mind. Instead, Drude's whole fascination with the all-at-onceness (Totaleindruck) of the final image may also have been caused by this unusual experience: the coming together of a hodge-podge of hands, each contributing indispensable abilities and skills, allowed him to perceive something new in his maps, to glimpse distribution patterns that were as yet unseen. Historiographically, the observations he made were thus neither ahead of his era nor behind. How could they have been anyway? His eyes were just in time.
Acknowledgments
The author extends special thanks to his supervisor, Rüdiger vom Bruch; to Lorraine Daston for her helpful advice and critique on different versions of this paper as well as for her continuous support of the work in general; to the participants at the Max Planck Institute for the History of Science Department II Colloquium for a stimulating discussion of a first draft of this article; to Jenny Beckmann, Jonathan Harwood, Christian Reiß, Skúli Sigurdsson and Max Stadler for their detailed comments; to Alexandre Métraux for his many editorial suggestions, and to Petra Weigel for her generous support in the archive of the Perthes Verlag. Benjamin Nübel and Matthew Spellberg kindly helped me improve the English phrasing.
Abbreviations
SPK = Forschungsbibliothek Gotha, Sammlung Perthes, Kartensammlung.
SPA = Forschungsbibliothek Gotha, Sammlung Perthes, Archiv (documents quoted in this paper are from the subsection, “Mitarbeiter und Freunde des Verlages”).