NOMENCLATURE
- Aw
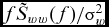
high-frequency spectral decay limit of
 $f{\tilde S_{ww}}( f )/\sigma _w^2$ (similarly for Av and Au) according to Kolmogorov's –5/3 Law
- f
frequency (cycle/s or Hz)
- ${\tilde R_{ww}}$
modelled series expansion of autocorrelation of turbulence velocity w, (similarly for u and v)
- RwworRwPwP
autocorrelation of vertical turbulence velocity w at a generic point P, first term in the perturbation series expansion of
${\tilde R_{ww}}$, a form of the von Karman vertical correlation function (similarly for Ruu and Rvv)- RwPwQ
cross-correlation between vertical turbulence velocities at P and Q (similarly for u and v)
- ${\tilde S_{ww}}$
modelled series expansion of autospectrum of turbulence velocity w, (similarly for u and v)
- SwworSwPwP
autospectrum of vertical turbulence velocity w at P (similarly for u and v)
- SwPwQ
cross-spectrum between vertical turbulence velocities at P and Q (similarly for u and v)
- Sc wPwQ,S wPwQq
co-spectrum and quad-spectrum between vertical turbulence velocities at P and Q (similarly for u and v)
- Tu,Tv and Tw
time scales of longitudinal, lateral, and vertical turbulence
- t
time (s)
- $\bar u,\ \bar v$and
$\bar w$
mean turbulence velocities in the longitudinal, lateral, and vertical directions
- u,v and w
turbulence velocities in the longitudinal, lateral, and vertical directions (see Fig. 1)
- αu,αv, and αw
scaling or normalisation parameters for autocorrelations (autospectra) of u,v, and w
- β1w,β2w,. . ., βnw
constants in the perturbation series expansion of
${\tilde R_{ww}}\ $ (see Equation (2a), similarly for ${\tilde R_{uu}}$ and ${\tilde R_{vv}}$)- γ2wPwQ
coherence or coherence function between vertical turbulence velocities w 1 at P and w 2 at Q (similarly for γ2uPuQ and γ2vPvQ)
- θwPwQ
phase angle of cross-spectrum
${\tilde S_{wPwQ}}$ (similarly for θuPuQ and θvPvQ)- σw
root mean square (rms) of vertical turbulence velocity (similarly for σu and σv)
- σ2w
variance or energy of vertical turbulence velocity (see Equation (2c), similarly for σ2u and σ2v)
- τ
time interval or time lag, t 2 - t 1,


1.0 INTRODUCTION
Helicopter shipboard operations have to contend with airwake-downwash turbulence: the coupled flow-field of ship's airwake shed from the superstructure and the thrust-induced downwash from the helicopter itself(Reference Gaonkar1). Airwake-downwash turbulence is formidably complex in that it is nonhomogeneous and rapidly distorting. Due to this complexity, the current predictive capability for the autospectrum and such fundamental statistics merits significant improvement, let alone the capability for real-time simulation. Over the past five years, the state of the art of treating airwake-downwash turbulence in the helicopter-ship dynamic interface has been thoroughly reviewed by Reference DoaneRef. 2, and a summary account is given by Reference Polsky and WilkinsonRefs 3, Reference Gaonkar4 and Reference Schau5. As seen from these studies(Reference Doane2–Reference Schau5), major strides have been made in generating the database of flow velocity points, primarily based on CFD approaches and, to a lesser degree, based on wind-tunnel and full-scale experiments.
This database presents an unharnessed opportunity for generating a relatively complete set of statistics and developing interpretive models. Specifically, the statistics refer to one-point statistics of autospectrum for all three velocity components and to the corresponding two-point statistics of cross-spectrum and coherence. The interpretive models(Reference Schau5) represent these one-point statistics in closed form. By design, they have a simple analytical structure to facilitate delineation, simulation through white-noise-driven filters and routine use as a predictive tool. Because of the built-in simplicity, they offer considerable promise for real-time simulation. Moreover, they broaden the scope and utility base of a database that invariably requires enormous resources. The present paper is driven by this opportunity.
The mathematical framework for developing interpretive autospectral models from a database posits that airwake-downwash turbulence is nonlinearly transformed atmospheric boundary layer turbulence (ABL); see Reference SchauRef. 5. Specifically, each velocity component is treated independently of the other, each component having its own time scale and rms value. Classical homogeneous, isotropic turbulence theory along with Taylor's frozen turbulence hypothesis(Reference Gaonkar1) is adapted to modelling ABL. With this adaptation, the autocorrelation for each component is represented by a separate perturbation-type series in which the first term has a form of the von Karman longitudinal or lateral correlation function. After transformation into equivalent perturbation series of autospectrum, the coefficients in the series are calculated by satisfying the theoretical constraints and fitting a curve to a set of selected autospectral data points on a least squares basis. The framework represents a judicious combination of a mathematical formulation based on series expansion, a database, and theoretical constraints. In turn, it guarantees that, for all three velocity components, the extracted autospectral models and the corresponding autospectral data points have the same time scale, mean square value and asymptomatic decay according to the Kolmogorov –5/3 Law(Reference Schau5). That is, all three fundamental turbulence characteristics of the data are captured by the extracted models.
Harris was the first to propose that the longitudinal autocorrelation function of nonlinearly transformed ABL can be expressed by a perturbation-type series(Reference Harris6). For some assumed values of constants in the series expansion, he qualitatively showed the utility of this approach for modifying the von Karman longitudinal autospectrum to include autospectral variation with height above the ground(Reference Harris6). Here, the focus is almost exclusively on the longitudinal component, for which, the treatment also includes two constraint equations in closed form, which are related to the preservation of time scale and asymptotic decay. In Harris’ treatment, the lateral and vertical autospectra are derived from the longitudinal by invoking the continuity equation for an incompressible fluid. A direct extension of this work to nonhomogeneous, non-isotropic turbulence leads to inconsistent and arbitrary time scales. Harris’ work does not address any application to a database. Despite all this, the pioneering treatment of Harris sets the stage for exploiting the potentialities of the series-expansion approach and the database.
In a recent study(Reference Gaonkar and Mohan7), the treatment of Harris has been extended to modelling ship airwake. Here, the focus is on autospectral and cross-spectral models in the low-frequency bandwidth (0 ⩽ f(Hz) ⩽ 1.6). More important, the approach of Reference Gaonkar and MohanRef. 7 is completely numerical, and it does not provide a means of preserving the key turbulence characteristic of autospectral asymptomatic decay in the extracted model. Reference Reference Gaonkar8 is another follow-up study, which represents a preliminary investigation of helicopter downwash effects on ship airwake with the approach of Reference Gaonkar and MohanRef. 7.
Now, it is expedient to ask: How far does this work advance the state of the art of treating airwake with downwash, particularly as an advancement over the works of Harris(Reference Harris6) and Gaonkar and Mohan(Reference Gaonkar and Mohan7)? For the first time, this paper exploits a comprehensive database – airwake alone, downwash alone, and airwake with downwash – to generate one-point statistics of autospectrum and two-point statistics of cross-spectrum and coherence. Thereby, it demonstrates the impact of downwash-induced disturbances on the entire flow-field of airwake. Above the rotor plane, these disturbances directly affect the rotor; as excitations to the rotor itself, they are critical to low-speed helicopter flight dynamics. Below the rotor plane, these disturbances, as internal excitations from the rotor to the fuselage, increase the fuselage loads and in turn affect the pilot's workload and operational envelope(Reference Lee and Zan9,Reference Zan10) .
In developing a mathematical framework as well, while the present study(Reference Schau5) is built on the works of Harris(Reference Harris6) and also Gaonkar and Mohan(Reference Gaonkar and Mohan7), it expands on them in three respects. First, for time scale preservation and asymptotic decay, it derives from first principles the constraint equations in closed form for the vertical component. These equations also apply to the lateral component with only minor changes. Second, it refines the formulation of Gaonkar and Mohan(Reference Gaonkar and Mohan7) to include the constraint equations for all three velocity components, so that the extracted autospectral models capture asymptotic decay and such fundamental characteristics of the autospectral data points. Third, it demonstrates that the framework is robust and that the extracted models lend themselves well to designing shaping filters driven by white noise. This demonstration is based on a comprehensive database of airwake with downwash.
2.0 MODEL STRENGTHS AND WEAKNESSES
Airwake-downwash turbulence deviates appreciably from ABL, whereas the framework is based on a perturbation-type series expansion in which the first term is represented by a form of the von Karman autocorrelation function from classical turbulence theory, including Taylor's hypothesis(Reference Gaonkar1). Moreover, there is no guarantee that the contribution of the first term of the series dominates over those of the second and remaining terms. These concerns should be tempered with the intended role of the framework: To provide a foothold on airwake-downwash phenomenon for engineering analysis. Moreover, the framework does not follow the classical perturbation theory approach of a linearised solution with perturbation corrections as add-ons. In fact, it represents a practical combination of series expansion, exploitation of the database, and theoretical constraints, and thereby it guarantees that time scale, mean square value and asymptomatic decay of the autospectral data points are preserved in the extracted models. It is emphasised that Taylor's hypothesis and the Kolmogorov –5/3 Law are found to be remarkably robust(Reference Mathieu and Scott11,Reference Townsend12) . It is further emphasised that Taylor's hypothesis is not restricted to homogeneous turbulence and that this hypothesis is applicable to all turbulent flows as long as mean flow velocity is larger, compared to the eddy convection velocity(Reference Mathieu and Scott11,Reference Townsend12) . “Thus, in practice, although Taylor's hypothesis is not exact, because real turbulence evolves as it is convected, it is approximately true in many flows(Reference Mathieu and Scott11).” While the validity of Taylor's hypothesis for airwake-downwash turbulence may be debatable, this hypothesis provides a powerful means of converting spatial coordinates into temporal coordinates. And the Kolmogorov –5/3 Law is well supported by experiments in a variety of flow fields, ranging from tidal flows and atmosphere near the sea surface to wind-farm wake turbulence and ship airwake with and without downwash(Reference Schau5,Reference Mathieu and Scott11) . This Law requires, though, high-Reynolds-number and fully-developed-turbulence conditions(Reference Mathieu and Scott11). By design, the construction of shaping filters driven by white noise is as routine as the currently used procedure for the von Karman. What is more, the framework's utility is well borne out when tested against a comprehensive CFD database (details to follow). As things turn out, these models typically require no more than a first-order correction (a two-term series).
These weaknesses notwithstanding, this work should serve as a reference point for future investigations of downwash effects on the helicopter-ship dynamic interface. After all, almost all aspects of this interface, from pilot workload to excitations to the rotor/fuselage system to health and safety concerns, are affected by downwash coupling with airwake, not to mention the launch and recovery envelope(Reference Zan10).
3.0 DOWNWASH-IMPACT STATISTICS
The stochastic description is based on one-point statistics of autospectrum and two-point statistics of cross-spectrum and coherence. These statistics for airwake with downwash are compared with the corresponding statistics for airwake alone, and this comparison is used to quantify the impact of downwash on airwake. For all these results, the database lays the groundwork. Accordingly, it is presented first.
3.1 Database
The database is CFD-based and it was generated at the Naval Air Warfare Center Aircraft Division (NAWCAD), Patuxent River, Maryland. Specifically, it refers to flow velocity points of airwake for a DDG-81 Class Ship at rest with a 25-Kn headwind. Downwash coupling is simulated through an embedded H-60 actuator disk model (the rotors of Sikorsky SH-60 (Sea Hawk) and S-70 (Black Hawk) are virtually identical, and they are commonly referred to as H-60 rotor). Simply put, the flow field comprises the airwake shed by a 25-Kn headwind and downwash from an H-60 rotor hovering within this airwake.
The database is voluminous. Velocity data exists at 258,335 points in space that are arranged in a three-dimensional spatial grid of 55 ×61 ×77 nodes. The grid begins at what could be considered as the landing area and propagates back over 400feet behind the ship. In total, 600 flow velocity predictions spaced at 0.1 seconds apart (1 minute of transient data) are available at each of these 258,335 points. The H-60 actuator disk model is embedded at 20 representative locations within the grid, and a complete set of flow velocity data are available for each of these 20 locations. To sum up: a total of 258,335 ×600 ×3 ×20 data points; that is, well over 9.3Bn velocity points of airwake with downwash.
The database is also comprehensive in that it comprises two equally compelling sets of data points: one for the 25Kn airwake alone and one for downwash alone, under identical conditions (in the airwake-alone case the actuator disk is absent; in the downwash-alone case the headwind is absent) Thus, it provides a direct means of isolating and quantifying downwash impact on airwake.
3.2 One-Point and Two-Point Statistics
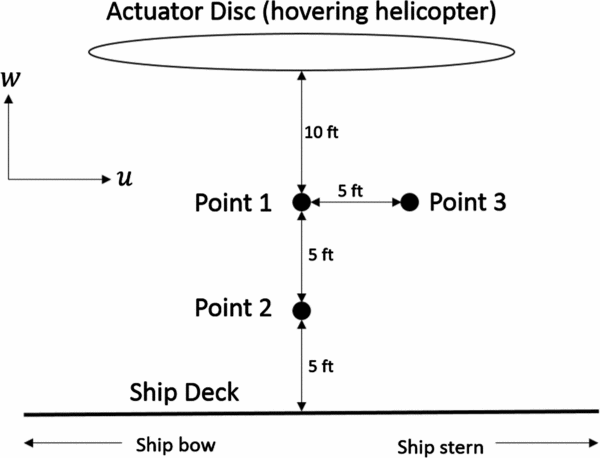
Given the extent of the database, the statistics are presented for three points in the spatial grid, which are schematically shown in Fig. 1, along with the topology relative to the actuator disk and landing deck. The first two points are 10 feet and 15 feet vertically below the actuator disk, and the third point is 5 feet horizontally to the right from the first. In the sequel, these three points are referred to as ‘Point One’, ‘Point Two’, ‘Point Three’, and the actuator disk is referred to as a “hovering helicopter”.
A schematic of topology of point one, point two, and point three in the spatial grid relative to the actuator disk and deck level.

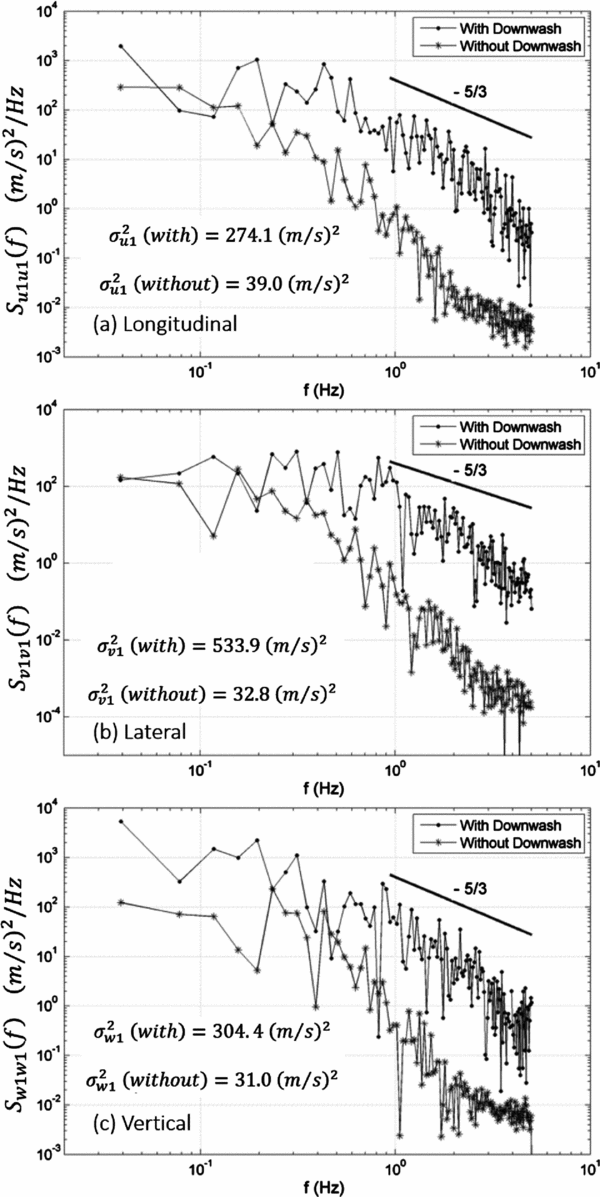
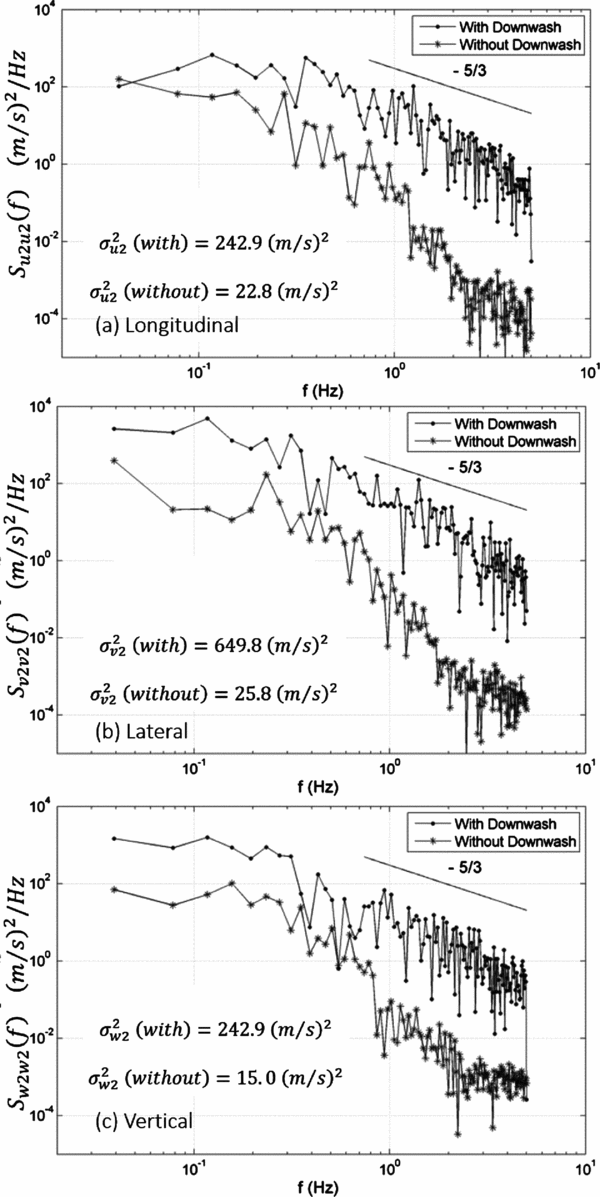
Figure 2 refers to Point One, and Fig. 3 to Point Two, 10 feet and 15 feet vertically below a hovering helicopter, respectively. Each of two figures presents how the autospectra of longitudinal, lateral, and vertical components for airwake with downwash compare with the corresponding autospectra for airwake alone. This comparison is of significance in that the area under dimensional Sii(f) versus f curve represents the mean square σ2i, which is also referred to as turbulence energy in the sense that σ2i also represents variance (because the mean flow is subtracted from the velocity time history). Moreover, the frequency bandwidth over which this energy is concentrated can be identified as well. For illustration, the vertical component at Point One in Fig. 2 is considered. The energy, or mean squareσ2W1, is31.00(m 2/s 2) without downwash, compared to 304.4(m 2/s 2), with downwash, nearly a tenfold increase due to downwash coupling. Equally important, almost all of this energy is concentrated within the low-frequency bandwidth (0.16 ⩽ f(Hz) ⩽ 1.6) that is of concern to helicopter flight mechanics. The results of Fig. 3 exhibit the same pattern, that is, one order of magnitude increase of turbulence energy because of downwash coupling: σ2W2 = 242.9(m 2/s 2)with downwash compared to 15.00(m 2/s 2) without downwash, nearly a 16-fold increase (the autospectral and mean square results for Point Three (Fig. 1) essentially depict the same trend and are thus omitted).
Autospectra with and without downwash at point one, 10 feet vertically below a hovering helicopter.
Airwake autospectra with and without downwash at point two, 15 feet vertically below a hovering helicopter.
Compared to the preceding consideration of airwake-downwash turbulence energy and its concentration over a low-frequency bandwidth, the asymptotic decay of autospectra is more subtle. And, it is equally significant from the consideration of whether the turbulence flow field is still distorting or close to be being fully developed. As seen from Figs. 2 and 3, the asymptotic decay rate for all three velocity components of airwake with downwash is a bit higher than the Kolmogorov –5/3 decay rate, and for airwake alone, the decay rate is fairly comparable to the Kolmogorov rate. Observe that the Kolmogorov Law of –5/3 autospectral asymptomatic decay requires high-Reynolds-number and fully developed turbulence. Thus, this steeper-than-the-Kolmogorov decay rate due to downwash coupling seems to indicate that, compared to airwake alone, airwake with downwash is relatively less fully developed; that is, the eddy distortions are more pronounced and they continue longer. These remarks on the Kolmogorov decay rate, however, merit revisiting on the basis of experimental, at-sea or wind-tunnel data.
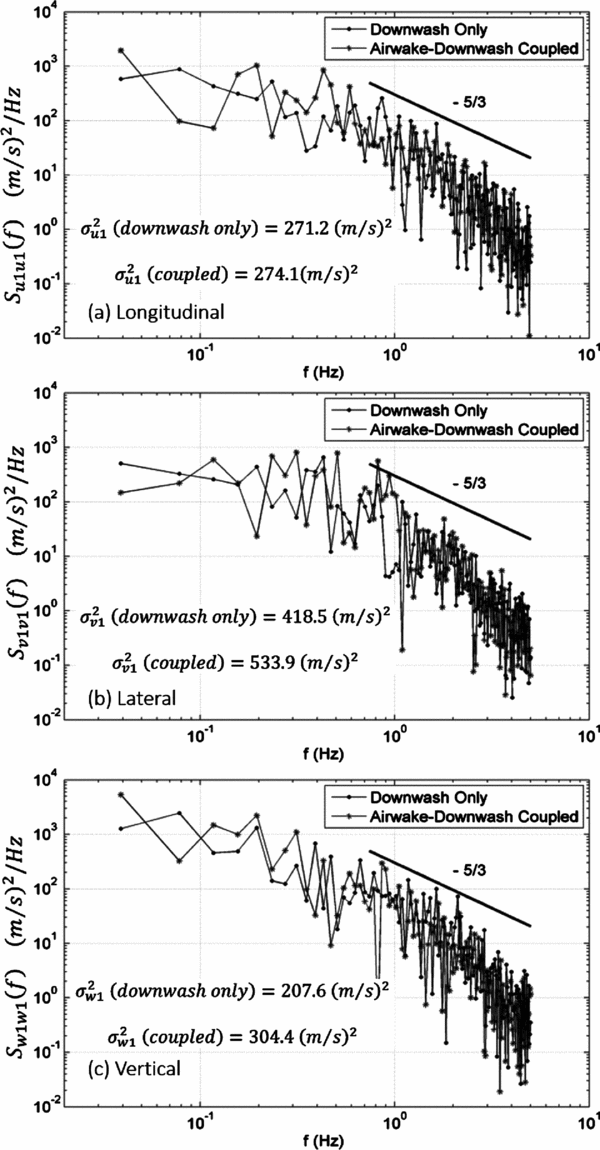
Figures 2 and 3 show the impact of downwash on the airwake flow field. The CFD database offers a set of data in which airwake is not present in the flow field, leaving downwash as the driving factor. Figure 4 shows the autospectral results from this downwash-only flow field at Point One, plotted with the coupled autospectra of Fig. 2. As expected, downwash is the driving factor in that the two spectra are virtually indistinguishable. Here as well, further research is required on the basis of experimental data.
Airwake-downwash autospectra and downwash-only autospectra at point one, 10 feet vertically below a hovering helicopter.
The next set of statistics on the impact of downwash on airwake represents the two-point statistics of cross-spectrum and coherence. To help present the results without any ambiguities of terminologies, and to appreciate the results, the basic equations of the two-point statistics of cross-spectrum and coherence are first mentioned in passing, and then the results are presented. The correlation between, say vertical component w 1(t) at Point One and w 2(t + τ) at Point Two, for the time interval τ is the cross-correlation R w1w2(τ). The Fourier transform of R w1w2(τ) is the cross-spectrum, which is a complex valued function(Reference Bendat and Piersol13):
 $$\begin{equation}
{S_{w1w2}}\left( f \right) = \ S_{w1w2}^c\left( f \right) - i\ S_{w1w2}^q\left( f \right) = \left| {{S_{w1w2}}\left( f \right)} \right|\ {e^{ - i{\theta _{w1w2}}}},
\end{equation}$$
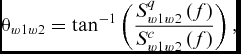
where Sc w1w2(f) is the co-spectrum,Sq w1w2(f) is the quad-spectrum, and θw1w2 is the phase angle. Specifically, the magnitude and phase are given by
 $$\begin{equation}
\left| {{S_{w1w2}}\left( f \right)} \right| = \sqrt {{{\left[ {S_{w1w2}^c\left( f \right)} \right]}^2} + {{\left[ {S_{w1w2}^q\left( f \right)} \right]}^2}},\\
\end{equation}$$
 $$\begin{equation}
{\theta _{w1w2}} = {\tan ^{ - 1}}\left( {\frac{{S_{w1w2}^q\left( f \right)}}{{S_{w1w2}^c\left( f \right)}}} \right),
\end{equation}$$
Given the autospectra for both w 1(t) and w 2(t) – S w1w1(f) and S w2w2(f) – and the magnitude of the cross-spectrum between w 1(t) and w 2(t) – |S w1w2(f)| – the corresponding coherence or coherence function (also referred to as the spectral correlation coefficient) is given by(Reference Bendat and Piersol13)
 $$\begin{equation}
\gamma _{w1w2}^2\left( f \right) = \frac{{{{\left| {{S_{w1w2}}\left( f \right)} \right|}^2}}}{{{S_{w1w1}}\left( f \right){S_{w2w2}}\left( f \right)}}\ \ \,\ \ \ \ 0 \le \gamma _{w1w2}^2\left( f \right) \le 1
\end{equation}$$
As expected, forw 1(t) = w 2(t), γ2w1w2(f) = 1 represents perfect correlation. Coherence γ2w1w2(f) is greater than zero and less than one, and this shows the extent to which these two series are “similar” or correlated at each frequency.
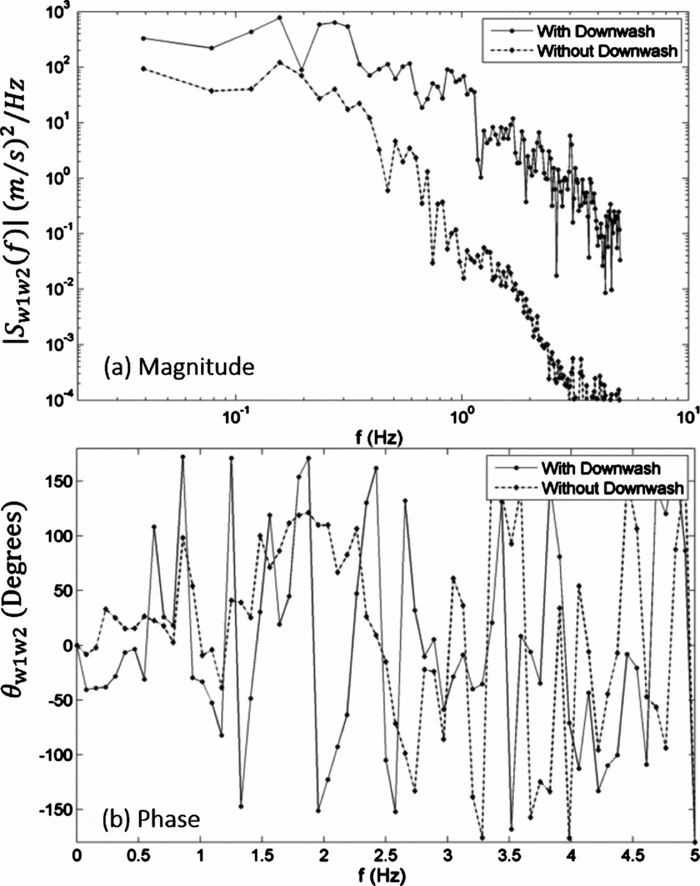
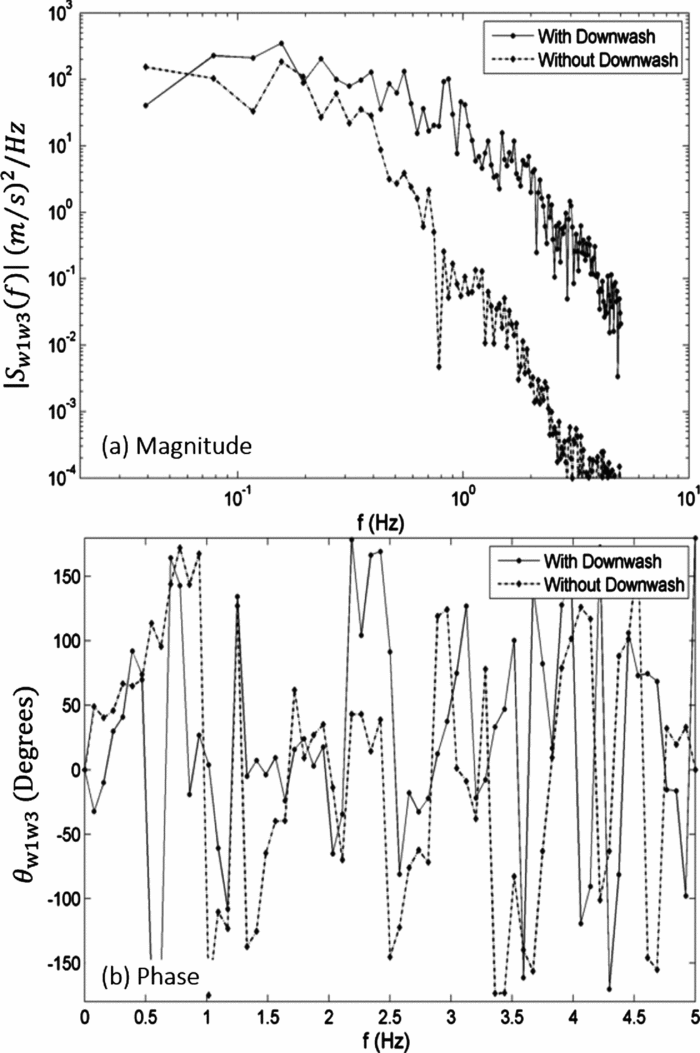
For both airwake and airwake-downwash turbulence, Fig. 5 shows the cross-spectrum S w1w2(f) between the vertical components w 1(t) at Point One and w 2(t) at Point Two; magnitude, as typified by Equation (1b), is shown in Fig. 5(a), and phase, as typified by Equation (1c), in Fig. 5(b). As seen from Fig. 5(a), downwash impact on airwake is severe for both points; that is, airwake-downwash turbulence within the area containing both points has more energy than airwake for the entire frequency range. The phase information in Fig. 5(b) is extremely instructive in comparison to some of the extensively pursued nonhomogeneous, anisotropic flow fields. As an illustration, for ABL near the ground, the phase angle is found to be relatively small and thus, the cross-spectrum is often approximated by the real part or co-spectrum; see Reference Simiu and ScanlanRef. 14 for details. By contrast, Fig. 5(b) shows that, for both airwake and airwake-downwash turbulence, the widely used small-phase approximation, that is, approximating cross-spectrum by its real part co-spectrum, is not tenable. For a relatively complete picture of two-point statistics in the interface, the cross-spectrum between point one and point three – S w1w3(f) – is also included in Fig. 6, magnitude in Fig. 6(a), and phase in Fig. 6(b). Here as well, the overall impact of downwash on airwake on the basis of cross-spectrum magnitude and phase variation with frequency is similar to that of S w1w2(f) in Fig. 5. The cross-spectral results for the longitudinal and lateral components are essentially similar to those of the vertical components and are thus omitted.
Airwake vertical cross-spectrum with and without downwash between point one and point two (these two points are identified in Fig. 1).
Airwake vertical cross-spectrum with and without downwash between point one and point three (these two points are identified in Fig. 1).
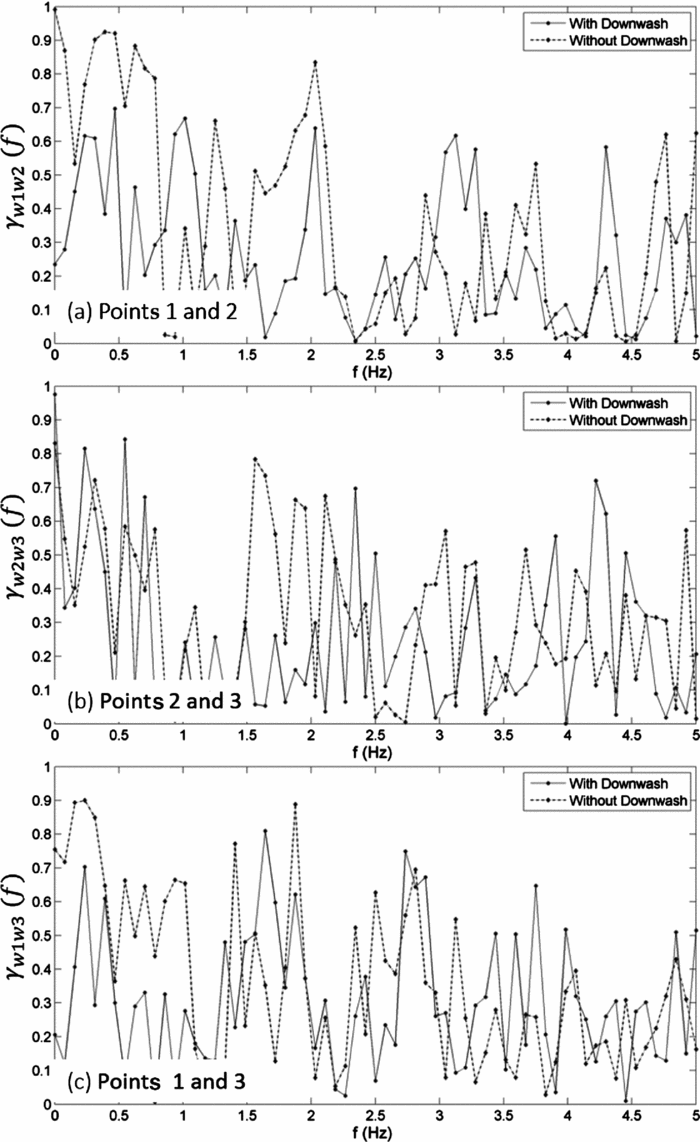
Figure 7 shows coherences γ2w1w2(f), γ2w1w3(f), and γ2w2w3(f) for vertical velocity components for three pairs of points; also see Fig. 1. For example, γ2w1w2(f) represents the dimensionless correlation between vertical components w 1(t) at Point One and w 2(t) at Point Two in the frequency domain; this should explain why coherence, as typified by Equation (1d), is also referred to as the spectral correlation coefficient. Coherence is widely used as a quantitative measure of similarity (or dissimilarity) between two time histories of flow velocities(Reference Bendat and Piersol13). As seen from Fig. 7, for airwake-downwash turbulence, the coherence is generally low (sayγ2ii < 0.5) for all three velocity components for most of the entire bandwidth(0 ⩽ f(Hz) ⩽ 5); this indicates that the two time histories of the corresponding components at these two points are weakly correlated. By comparison, the coherence values are much higher (γ2ii > 0.5) for airwake alone; that is, the correlation between the corresponding time histories is relatively stronger. These comparative features are consistent with the physics of two flow fields. Compared to airwake, airwake-downwash turbulence is far more distorting with reduced point-to-point similarity because of downwash coupling.
Vertical airwake coherences with and without downwash for three pairs of points (these three points are identified in Fig. 1).
As seen from Fig. 1, all three points, thus far investigated, are below the rotor plane, two points vertically down and the third one slightly behind the rotor. Although significant in the prediction of downwash-induced fuselage loads and the corresponding impact on pilot work load and operational envelope(Reference Lee and Zan9,Reference Zan10) , flow disturbances at these below-the-rotor-plane points represent an excitation that is internal to the rotor-fuselage system: from the rotor to the fuselage. By comparison, flow disturbances at points upstream of the rotor and above the rotor plane convect downstream and directly impact the rotor as an excitation to the rotor itself; and this excitation is thought to have a major effect on low-speed helicopter flight dynamics. That is, this excitation (rather than fuselage forces) is the primary source of pilot workload and limitations. Accordingly, one point just upstream of the rotor, and two points above the rotor are selected (these points are not shown). Specifically, the upstream point is on the rotor plane and 10feet forward of the rotor, and the other two points are 5feet and 10feet vertically above the rotor. For quantitative illustration, suffice it to consider σ2w, the energy values of the vertical components of airwake alone and airwake with downwash. Because of downwash, σ2w increases threefold at the point 5feet vertically above, and 40% at the upstream point on the rotor plane and marginally at the point 10feet vertically above. Finally, it is also instructive to compare downwash effects at two “representative points” that are above and below the rotor plane, say at Point One (Fig. 1), 10feet vertically below the rotor and at another point, 5feet vertically above. At Point One, σ2w increases tenfold from downwash and at the latter point, it increases threefold. The message is that, while downwash effects vary from point to point, these effects should be included in any realistic assessment of how the flow-field affects the vehicle.
4.0 MATHEMATICAL FRAMEWORK
The mathematical framework represents the series expansion approach in combination with the theoretical constraints and a database so that the extracted autospectral model from this database and the autospectral data points have the same time scale, mean square value, and asymptotic decay. The contributions of this paper are novel in three respects: (1) Derivation of theoretical constraints of time scale and asymptotic decay in closed form for the vertical component (essentially the same constraints apply to the lateral component with minor changes); (2) Development of a framework with built-in theoretical constraints for all three components (the constraints for the longitudinal were derived earlier by Harris(Reference Harris6)); and (3) Demonstration of the framework's viability against a comprehensive database.
For illustration, the vertical velocity component w(t) of airwake-downwash turbulence is selected; therein, the mean value  $\bar w( t )$ plus the corresponding fluctuation or turbulence w(t) represent the total vertical component:
 $w( t ) + \ \bar w( t ).$ For the longitudinal and lateral components, the details run virtually parallel to those of the vertical. Moreover, for helicopter flight dynamics applications, the vertical component is generally more important than the other two components.
4.1 Vertical Turbulence Model
The autocorrelation of vertical airwake-downwash turbulence  ${\tilde R_{ww}}( \tau )$ is expressed by a perturbation-type series:
 $$\begin{equation}
{\tilde R_{ww}}\left( \tau \right) = {\beta _{1w}}{R_{ww}}\left( \tau \right) + {\beta _{2w}}R_{ww}^2\left( \tau \right) + \cdots + {\beta _{nw}}R_{ww}^n\left( \tau \right)\ \
\end{equation}$$
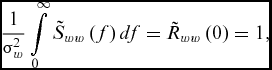
Using the classical definition of time scale  ${T_w} = \mathop \smallint_0^\infty {\tilde R_{ww}}( \tau )d\tau $ and with
 ${\tilde S_{ww}}( f )$ representing the vertical airwake-downwash turbulence autospectrum, Equations (2b) and (2c) provide the footholds for the derivation of the constraint equations.
 $$\begin{equation}
{\tilde S_{ww}}\left( 0 \right) = 4\sigma _w^2\mathop \int\limits_0^\infty {\tilde R_{ww}}\left( \tau \right)d\tau = 4\sigma _w^2{T_w},\\
\end{equation}$$
 $$\begin{equation}
\frac{1}{{\sigma _w^2}}\mathop \int\limits_0^\infty {\tilde S_{ww}}\left( f \right)df = {\tilde R_{ww}}\left( 0 \right) = 1,
\end{equation}$$
where σ2W is the mean square value, or variance. Furthermore,Rww(τ), the first term on the right side of Equation (2a), is referred to here as a basis function, and it is represented by a form of the von Karman vertical correlation function:
 $$\begin{equation}
{R_{ww}}\left( \tau \right) = \frac{{{2^{2/3}}}}{{{\rm{\Gamma }}\left( {\frac{1}{3}} \right)}}{\left( {\frac{{{\alpha _w}\tau }}{{{T_w}}}} \right)^{1/3}}\left[ {{K_{1/3}}\left( {\frac{{{\alpha _w}\tau }}{{{T_w}}}} \right) - \frac{1}{2}\left( {\frac{{{\alpha _w}\tau }}{{{T_w}}}} \right){K_{2/3}}\left( {\frac{{{\alpha _w}\tau }}{{{T_w}}}} \right)} \right],
\end{equation}$$
where αw is introduced to satisfy Equation (2b) and serves as a time-scale preservation parameter. K 1/3 and K 2/3 are modified Bessel functions of order 1/3 and 2/3, respectively; this is necessitated by the definition of autocorrelation,  ${\tilde R_{ww}}( 0 ) = 1$, regardless of the value of αw. As seen from Equations (2a) and (2d), β1w,β2w,. . ., βnw along with αw, represent n+1 unknown constants. Their evaluation requires the autospectrum, which is obtained by taking the Fourier transform of Equation (2a):
 $$\begin{equation}
{\tilde S_{ww}}\left( f \right) = {\beta _{1w}}{S_{ww1}}\left( f \right) + {\beta _{2w}}{S_{ww2}}\left( f \right) + \cdots + {\beta _{nw}}{S_{wwn}}\left( f \right),
\end{equation}$$
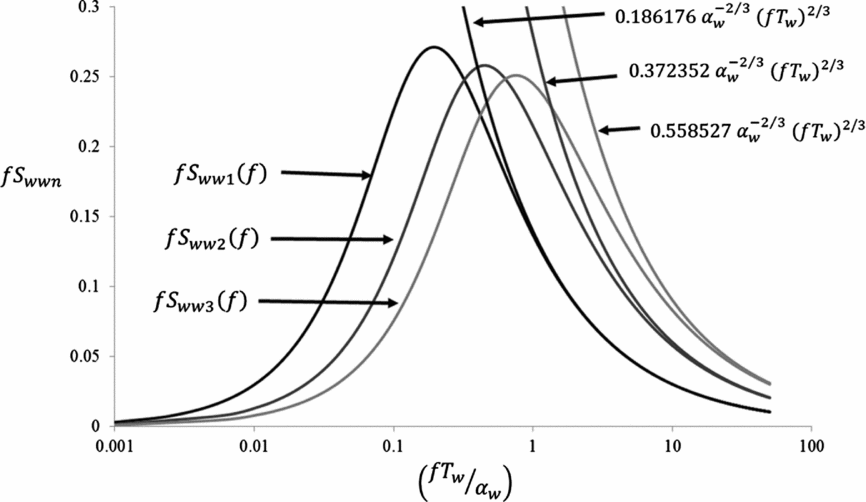
where Swwn(f) is the Fourier transform of Rnww(τ). A part of Fig. 8 shows the corresponding Fourier transforms multiplied by f: fS ww1(f), fS ww2(f), and fS ww3(f) (i.e. the terms of Equation (3) if all beta coefficients are set to unity).
A geometrical representation of asymptotic decay according to the Kolmogorov –5/3 law.
4.2 Constraint Equations
Since  ${\rm{\ }}{\tilde R_{ww}}( 0 ) = {R_{ww}}( 0 ) = 1$, Equation (2a) gives
 $$\begin{equation}
{\beta _{1w}} + {\beta _{2w}} + \cdots + {\beta _{nw}} = 1\ \
\end{equation}$$
Integrating Equation (2a), and using the relation in Equation (2b) lead to(Reference Schau5):
 $$\begin{equation}
{\alpha _w} = {\beta _{1w}}\mathop \int\limits_0^\infty {R_{ww}}\left( \tau \right)d\tau + {\beta _{2w}}\mathop \int\limits_0^\infty R_{ww}^2d\tau + \cdots + {\beta _{nw}}\mathop \int\limits_0^\infty R_{ww}^nd\tau \\
\end{equation}$$
 $$\begin{equation}
{\alpha _w} = \frac{{\sqrt \pi {\rm{\Gamma }}\left( {\frac{5}{6}} \right)}}{{2{\rm{\ \Gamma }}\left( {\frac{1}{3}} \right)}}\left[ {{\beta _{1{\rm{w}}}} + {\beta _{2{\rm{w}}}}\frac{{79\sqrt 3 }}{{256}} + {\beta _{3w}} \times D} \right],
\end{equation}$$
whereD is evaluated numerically. Finally,
 $$\begin{equation}
{\alpha _w} = 0.373417\,{\beta _{1w}} + 0.199591\,{\beta _{2w}} + 0.122360\,{\beta _{3w}}
\end{equation}$$
Similarly, the Kolmogorov asymptotic Law requires(Reference Schau5):
 $$\begin{equation}
{\left[ {\frac{{f\ {S_w}\left( f \right)}}{{{\sigma _w}^2}}} \right]_{{\rm{high}}\ {\rm{frequency}}}} = {A_w}{\left( {f\ {T_w}} \right)^{ - 2/3}}
\end{equation}$$
After some manipulations, Equation (5a) reduces to
 $$\begin{equation}
\frac{{{A_w}}}{{\alpha _w^{2/3}}} = \frac{{16}}{{3{{\left( {2\pi } \right)}^{5/3}}}}\frac{{\sqrt \pi {\rm{\ \Gamma }}\left( {\frac{5}{6}} \right)}}{{{\rm{\Gamma }}\left( {\frac{1}{3}} \right)}}\left[ {{\beta _{1w}} + 2{\beta _{2w}} + 3{\beta _{3w}} + \cdots } \right],
\end{equation}$$
where Aw is the asymptotic value, which is extracted from the autospectral data points according to Equation (5a)(Reference Schau5). This equation is simplified to:
 $$\begin{equation}
\frac{{{A_w}}}{{\alpha _w^{2/3}}} = \ 0.186176\,{\beta _{1w}} + 0.372352\,{\beta _{2w}} + 0.558527\,{\beta _{3w}}
\end{equation}$$
Figure 8 shows a geometrical representation of Equation (5c); for additional details, see Reference SchauRef. 5. The closed form expressions, as typified by Equations (4a), (4c), and (5b), represent the constraint equations of the model framework.
5.0 NUMERICAL ASPECTS
The process of managing the voluminous database and generating the autospectral data points, and then evaluating the unknowns in the series expansion, involves many and varied details(Reference Schau5). The following account is intended to convey a flavor of this process; although addressed for the vertical component, it applies to the other two components as well. As seen from Equations (2a) and (2d), the numerical task boils down to computing ‘n’ series-expansion constants of β1w,β2w,β3w, and one normalisation parameter αw. The task begins with the evaluation of the mean square value σ2w directly from the raw data points. Then, the autospectral data points, including the point at zero frequency, are generated from the database, and the mean square value σ2w is once again evaluated from Equation (2c); these two sets of mean square values are found to agree fairly well. Finally, the time scale Tw is calculated from Equation (2b), and the asymptotic limit Aw is graphically evaluated from Equation (5a).
Having thus extracted time scale Tw and asymptotic limit Aw from the database, the numerical scheme now turns to solving for n+1 unknowns – β1w,β2w,β3w, along with αw – and to subjecting this solution to satisfy the constraints typified by Equations (4a), (4d), and (5c). As seen from Equation (4d), these n β-coefficients completely determine αw, not the other way around. Thus, the numerical scheme actually involves the computation of n β-coefficients that satisfy the two constraints given by Equations (4a) and (5c).
Throughout, the constraint given by Equation (4a) is strictly enforced, and the numerical scheme begins with the von Karman model: βw = 1. The optimisation algorithm ‘sqp’ subjected to the constraints detailed above is used to minimise the error between the n β-coefficients of the model and the autospectral data points. When the β coefficients alone are considered without any reference to the asymptotic constraint Aw of Equation (5c). (Recall that Equation (4a) is always enforced), the minimisation process leads to several solutions sets, with minor differences between any two solution sets (e.g. these minor differences are due to the differences in the selection of the autospectral data points.)
When the β coefficients are considered along with the Aw constraint of Equation (5c), the numerical scheme becomes demanding in that it may lead to one set of β-coefficients thus satisfying all the constraints exactly but the β-coefficients may not adequately fit the data. Accordingly, an alternative numerical scheme is devised: A least-squares minimisation of the sum of the errors between the β-coefficients and the autospectral data points and between the Aw coefficient of the model (resulting from the β-coefficients, see Equation (5c)) and the measured Aw. This alternative scheme is found to be remarkably robust and routine, and the computed Aw values are generally found to be within 3%.
6.0 AIRWAKE-DOWNWASH MODELS
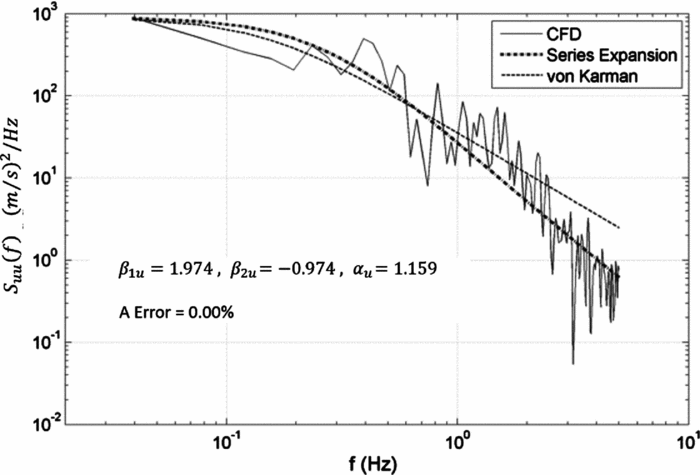
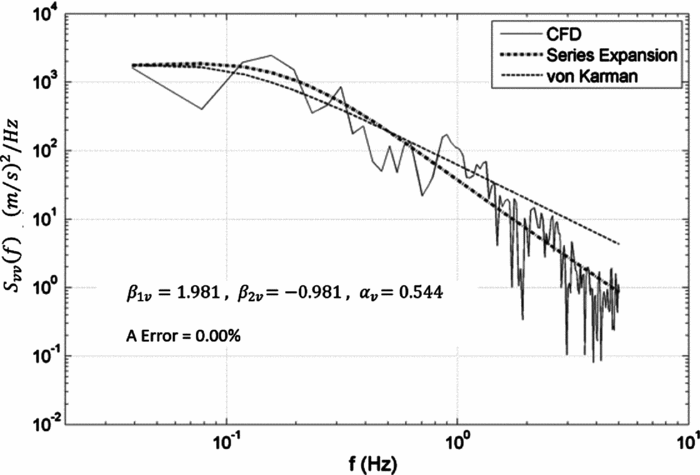
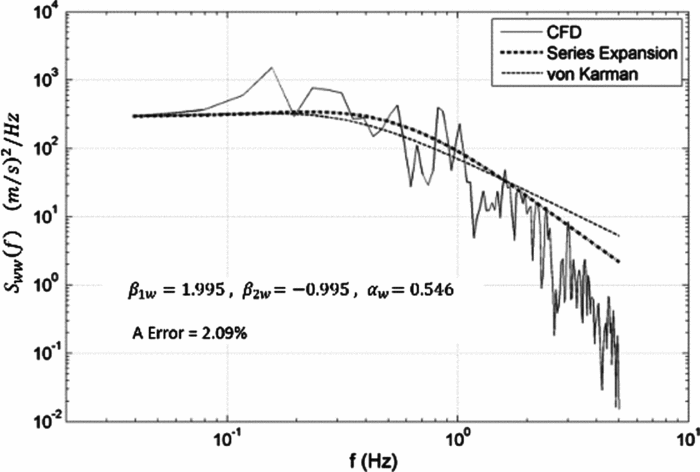
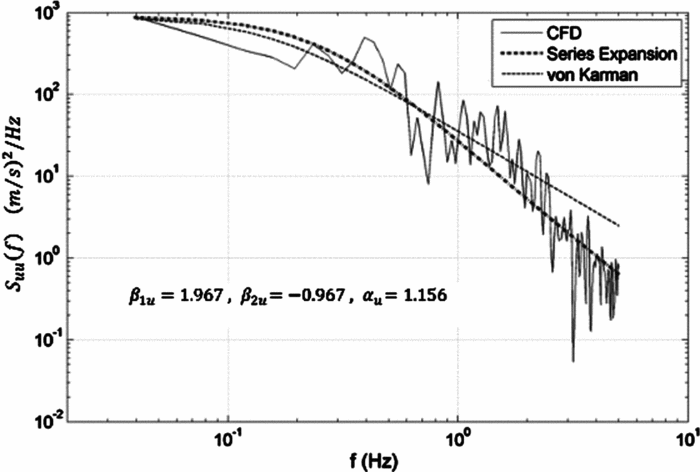
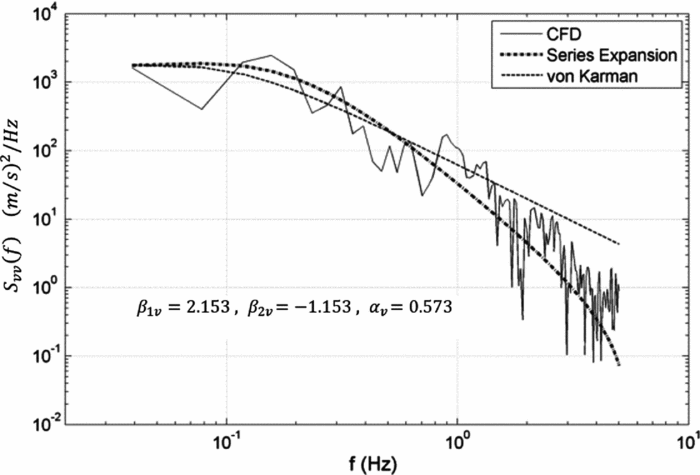
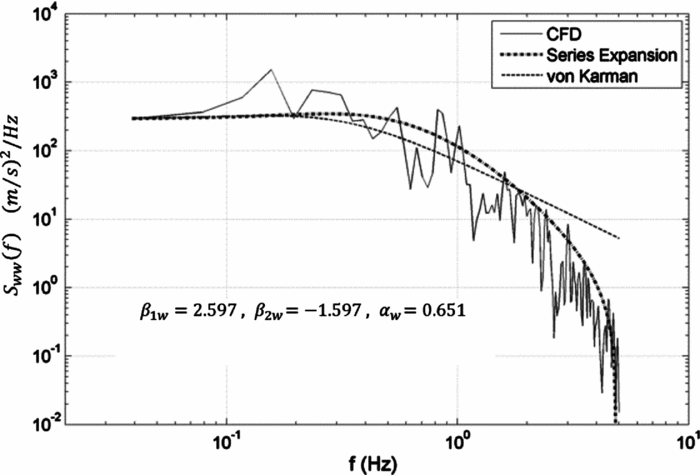
The framework is tested against a comprehensive database of airwake-downwash turbulence(Reference Schau5). A representative sample of the results from this testing is now presented in Figs. 9-14. Therein, the extracted interpretive models of autospectra are compared with the numerically generated autospectral data points from the database and the von Karman models (e.g. β1u = 1 for the longitudinal component).
Longitudinal autospectra of airwake-downwash turbulence from CFD, von Karman, and two-term series expansion.
Lateral autospectra of airwake-downwash turbulence from CFD, von Karman, and two-term series expansion.
Vertical autospectra of airwake-downwash turbulence from CFD, von Karman, and two-term series expansion.
Longitudinal autospectra of airwake-downwash turbulence from CFD, von Karman, and two-term series expansion, without the a-constraint.
Lateral autospectra of airwake-downwash turbulence from CFD, von Karman, and two-term series expansion without the A-constraint.
Vertical autospectra of airwake-downwash turbulence from CFD, von Karman, and two-term series expansion without the A-constraint.
For a segment of the database, the autospectral data points are found to exhibit a mixed trend: for some velocity components, the Kolmogorov –5/3 Law was clearly exhibited, while for the other components, this Law was not so clearly exhibited. Accordingly, for the same set of autospectral data points, the framework is used with the enforcement of the Kolmogorov Law in Figs. 9-11, and without this enforcement, in Figs. 12-14. Moreover, in Figs. 9-11, “A Error = xx %” indicates the error in satisfying the Kolmogorov –5/3 Law. As it turns out, rigorous enforcement of Equation (5c) severely limits the model. Due to the nature of the –5/3 law, allowing the model's asymptotic decay level to deviate from the measured value is acceptable. An error of less than 10% is considered acceptable for engineering analysis. To clarify the previous statement: The beta coefficients of Equation (3) are solved for in a least squares (curve fitting) sense, with exact adherence to the constraint Equation (4a). To allow for a greater set of possible solutions, Equation (5c) is enforced to within an acceptable level. Similarly, in Figs. 12-14, “without the A-Constraint” means that the asymptotic decay according to the Kolmogorov –5/3 Law typified by Equation (5c), is not enforced. Now, the least-squares solution is subjected to two constraints, typified by Equations (4a) and (4d). Another point merits mention: The selection of a specific segment of the database with a mixed trend of exhibiting the Kolmogorov –5/3 Law is intentional. Its purpose is to demonstrate that the framework lends itself remarkably well to a wide range of the database, irrespective of whether the autospectral data points exhibit the Kolmogorov –5/3 Law or not. Ignoring Equation (5c) in the model extraction is completely appropriate, if the data itself does not exhibit the –5/3 Law.
As seen from all these six figures, Figs. 9-14, the developed models with only a first-order correction (a two-term series) approximate the autospectral data points remarkably well, and they represent a significant improvement over the von Karman model.
It is also instructive to compare the extracted models with the –5/3 Law enforcement to those without the enforcement. For the longitudinal and lateral components (Figs. 9, 12 and Figs. 10, 13, respectively), the autospectral data points exhibit asymptotic decay according to the –5/3 Law, and enforcement of this Law is found to be desirable. Specifically, for the longitudinal component, both cases with and without the enforcement lead to virtually identical models, and for the lateral component, the model with the enforcement better approximates the autospectral data points; for example, compare Figs. 10 with 13, in particular, for frequencies greater than 1Hz.
For the vertical component in Figs. 11 and 14, the autospectral data points exhibit a steeper-than-the –5/3 slope. In this case, the model without this enforcement (Fig. 14) represents a qualitative improvement over the model with the enforcement (Fig. 11). The reason is that the enforcement hinders the framework's capability for the model extraction for the flow-field at this particular location.
In summary, these six figures demonstrate that the framework is remarkably robust: The capability for extracting autospectral models from a wide range of autospectral data points with and without the Kolmogorov –5/3 asymptotic decay. They further demonstrate that, with only a first-order correction, the framework extracts models that provide an excellent approximation of the autospectral data points, and a vast improvement over the von Karman. It is important to note that although the points modelled are below the rotor, they could be applied to any point in the flow field, for example, above and upstream of the rotor.
7.0 SIMULATION FILTERS
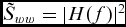
For the one-point statistics of autospectrum (e.g.  ${\tilde S_{ww}}( f )$ in Equation (3)), simulation requires reconstruction of the random process or time histories from the extracted autospectral models. Accordingly, random white noise is passed through a filter, a single-input single-output system, say with system function H(f). Since white noise autospectrum is constant, it is set to unity, and now, the response autospectrum of the shaping filter is simply |H(f)|2. Thus, the random process reconstruction simplifies to designing a shaping filter with system function H(f) such that |H(f)|2 agrees with the extracted autospectrum model; that is,
 ${\tilde S_{ww}} = {| {H( f )} |^2}$.
A key feature of the extracted autospectrum models of airwake-downwash turbulence, as typified in Equation (3), is that the filter design is virtually identical to the widely-used design for the von Karman autospectra. For the vertical autospectrum, the system function for the extracted autospectrum models can be expressed as(Reference Schau5):
 $$\begin{equation}
\frac{{{H_w}\left( f \right)}}{{{\sigma _W}}} = \frac{{4\sqrt {{T_W}} \ \left( {1 + {b_1}{T_W}f + {b_2}{{\left( {{T_W}f} \right)}^2}} \right)}}{{1 + {a_1}{T_W}f + {a_2}{{\left( {{T_W}f} \right)}^2} + {a_3}{{\left( {{T_W}f} \right)}^3}}}
\end{equation}$$
In the above equation, TW is time scale, referred to earlier in Equation (2b). The time scale is calculated from the data. The remaining five coefficients – a1, a2, a3, b1 and b2 – are evaluated by nonlinear data fitting to the extracted autospectral model on a least squares basis(Reference Schau5).
7.1 Airwake-Downwash Simulation
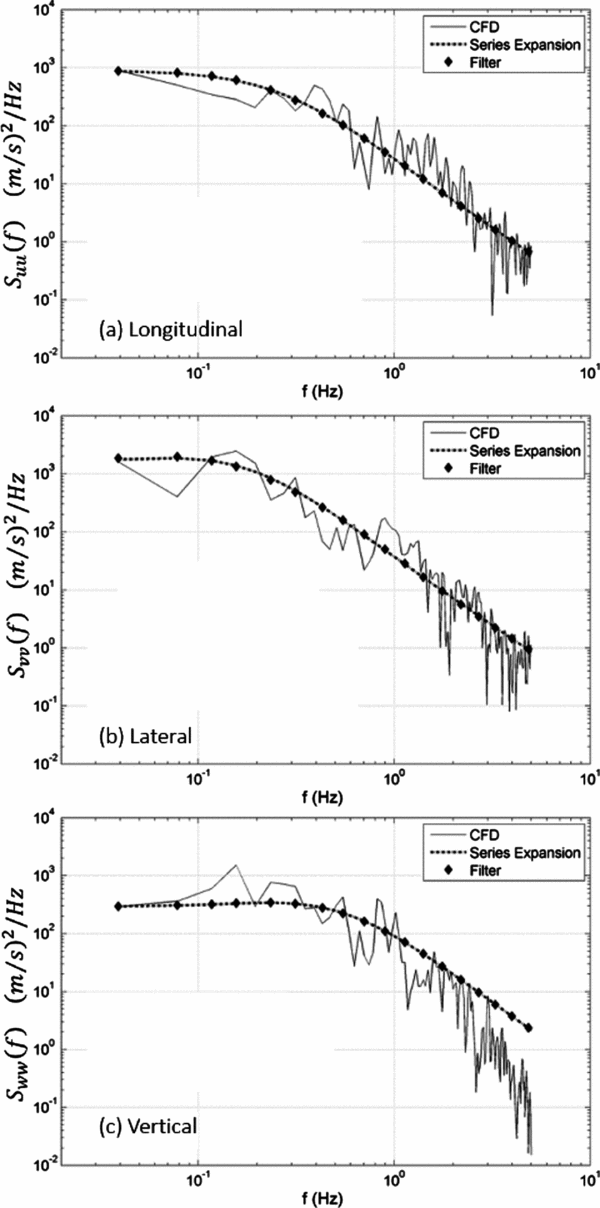
The filter design follows Equation (6), and Fig. 15 shows how the autospectra from these white-noise-driven filters compare with the autospectral data points and with the extracted models from the database. These autospectral data points and the extracted models are identical to the models presented earlier in Figs. 9-11. The extracted models are found to lend themselves extremely well to the design of filters(Reference Schau5), and, as seen from Fig. 15, they agree well with the other two sets of models: autospectral data points (CFD) and extracted interpretive model (series expansion).
Airwake-downwash turbulence autospectra from CFD, two-term expansion series, and shaping filter simulation of two-term series model.
8.0 CONCLUSIONS
For a better appreciation of these findings, it is emphasised that downwash affects practically all aspects of helicopter shipboard operations, ranging from unsteady fuselage loads to pilot work load to operational limit(Reference Lee and Zan9,Reference Zan10) , not to mention the health and safety concerns. Moreover, there is little quantitative information available on the statistical aspects of airwake-downwash coupling. Given this background, this paper's two major contributions are: (1) A quantitative demonstration of the impact of downwash on airwake on the basis of one-point statistics of autospectrum and two-point statistics of cross-spectrum and coherence; these statistics are generated directly from a CFD database for a DDG-81 class ship. The database represents both airwake alone and airwake with downwash and (2) Development of a mathematical framework for extracting autospectral models from a database. Compared to the earlier-exercised series expansion schemes(Reference Harris6–Reference Gaonkar8), the present work develops from first principles the constraint equations in closed-form for time scale and asymptotic decay of the vertical and lateral components. (The corresponding constraints equations for the longitudinal component were developed earlier by Harris(Reference Harris6).) This framework incorporates these time-scale and asymptotic-decay constraints for all three velocity components, and in turn, it ensures that the extracted model captures all three fundamental turbulence characteristics of the autospectral data points: time scale, mean square value and also asymptotic decay according to the Kolmogorov –5/3 Law. Thus, the framework represents a noteworthy advancement over the earlier-proposed series-expansion schemes(Reference Harris6–Reference Gaonkar8).
The framework is tested against a comprehensive database of airwake with downwash, and this testing includes a segment of the database for which the autospectral data points do not clearly exhibit the Kolmogorov –5/3 asymptotic decay. Moreover, the extracted models are further tested as to their suitability for routine simulation through white-noise-driven filters. The one-point and two-point statistics generated directly from the database of airwake and airwake with downwash, and also the framework's application to autospectral modelling, lead to the following specific findings:
1. The one-point statistics of autospectrum (e.g. Fig. 2) show that the airwake energy increases by nearly one order of magnitude and that almost all of this energy is concentrated within the frequency bandwidth of 0.16 ⩽ f(Hz) ⩽ 1.6; the bandwidth of concern to flight dynamics. Similarly, the two-point statistics of coherence demonstrate that spectral correlation between the flow-velocity time histories between two points is significantly reduced by downwash coupling.
2. When utilising the presented framework for autospectral model extraction, all that is generally required is a first-order correction (a two-term series). Moreover, the framework is found to be remarkably robust; it lends itself well to a wide range of the database with and without the enforcement of the Kolmogorov –5/3 Law. Stated otherwise, the framework is equally viable for the segment of the database for which the turbulence spectrum does not exhibit the asymptomatic decay according to the –5/3 Law.
3. For the extracted models of autospectrum, the design of the white-noise-driven simulation filters is as routine as the widely used procedure for the von Karman model.
8.1 Future Research
The following points are suggested for future research in the presented area:
1. The database is numerically generated from a CFD-based investigation, in which, the downwash coupling is incorporated through an embedded actuator-disk model, whereas, the flow-field is rapidly distorting and nonlinear, and it involves the interaction of rotor thrust, downwash and airwake as elements in a closed-loop feedback system. Given the flow-field complexity, a database from wind-tunnel and at-sea experiments, would help validate the current approaches to modelling the fully coupled flow-field of airwake with downwash.
2. The preceding mathematical framework with built-in constraint equations in closed form is restricted to developing interpretive autospectral models of one-point statistics. On the other hand, airwake alone and, more so, airwake with downwash represent nonhomogeneous and distorting flow fields. A relatively complete description of such flows requires both one-point statistics of autospectrum and two-point statistics of cross-spectrum and coherence. Thus, an extension of this framework together with the corresponding constraints in closed form, represents a fruitful area of research.
3. For the one-point statistics of autospectrum, the filter represents a single-input, single-output system driven by white noise; thus the filter design is a routine exercise. Given this background, further research on the feasibility of connecting the extracted autospectral model to a flight simulation code offers promise. For the two-point statistics, the filter represents a multiple-input, multiple-output system. Here as well, further research is required to assess how the interpretive models of these two-point statistics lend themselves to designing such a multiple-input, multiple-output system driven by white noise.
4. Compared to fuselage loads (e.g. drag and yawing moment) induced by airwake alone, the corresponding fuselage loads induced by airwake with downwash are substantially higher(Reference Lee and Zan9,Reference Zan10) . Of particular significance is the development of a methodology for incorporating the interpretive models of one-point and two-point statistics as an input matrix in the prediction of these fuselage loads. This methodology would help develop realistic quantitative measures of predicting pilot work load during shipboard operations(Reference Zan10).
ACKNOWLEDGEMENTS
The authors are grateful to the Naval Air Warfare Center Aircraft Division (NAVCAD), Patuxent River, MD, for providing the “CFD Airwake Data for a DDG-81 Class Ship with Embedded H-60 Actuator-Disk Model.” The help of Mr. Kuntal Thakkar of Florida Atlantic University, Boca Raton, FL, is gratefully acknowledged as well in the preparation of the paper. The authors are also grateful to Dr. Steven Zan, Director R&D Aerodynamics, NRC Aerospace, Canada, and to Professor Joseph Horn, Pennsylvania State University, PA for reviewing this paper.