INTRODUCTION
On 19 September 1991, a male corpse was accidentally discovered by mountain hikers in a shallow ice patch at a high-altitude mountain pass [3210 m above sea level (m asl)] of the Ötztal Alps in central Europe. The find was quickly nicknamed Ötzi and aroused considerable interest among archaeologists when the age of the body was determined by radiocarbon dating to be between 5320 and 5050 cal yr BP (95.4% probability range), i.e. between 3370 and 3100 BC (Bonani et al. Reference Bonani, Ivy, Niklaus, Suter, Housley, Bronk, van Klinken and Hedges1992, Reference Bonani, Ivy, Hajdas, Nicklaus and Suter1994; Hedges et al. Reference Hedges, Housley, Bronk and van Klinken1992; Kutschera and Müller Reference Kutschera and Müller2003). The excellent preservation of this “Iceman” and an apparently lethal arrow wound in his upper body (Pernter et al. Reference Pernter, Gostner, Egarter Vigl and Rühli2007) triggered a large number of investigations and speculations about his whereabouts and the circumstances of his death. Relatively certain is that he grew up south of the Alps, which was established by a detailed isotope study of his teeth (Müller et al. Reference Müller, Fricke, Halliday, McCulloch and Wartho2003). Later, a whole-genome sequencing of the Iceman surprisingly showed some characteristics of people living now on the island of Sardinia in Italy (Keller et al. Reference Keller, Graefen, Ball, Matzas, Boisguerin, Maixner, Leidinger, Backes, Khairat, Forster, Stade, Franke, Mayer, Spangler, McLaughlin, Shah, Lee, Harkins, Sartori, Moreno-Estrada, Henn, Sikora, Semino, Chiaroni, Rootsi, Myres, Cabrera, Underhill, Bustamante, Egarter Vigl, Samadelli, Cipollini, Haas, Katus, O’Connor, Carlson, Meder, Blin, Meese, Pusch and Zink2012). This trait may have been common for people living in Italy 5000 yr ago, but was only preserved until today in the island setting. On the other hand, a recent study of the Iceman’s mitochondrial DNA indicated that a characteristic trait of it was lost later by demographic mixing (Coia et al. Reference Coia, Cipollini, Anagnostou, Maixner, Battaggia, Brisighelli, Gómez-Carballa, Destro Bisol, Salas and Zink2016). In addition, another recent DNA study of the Iceman’s stomach bacterium Heliobacter pylori shows a clear Asian origin (Maixner et al. Reference Maixner, Turaev, Herbig, Hoopmann, Hallows, Kusebauch, Egarter Vigl, Malfertheiner, Megraud, O’Sullivan, Cipollini, Coia, Samadelli, Engstrand, Linz, Moritz, Grimm, Krause, Nebel, Moodley, Rattei and Zink2016), indicating that an African admixture occurred later in this prevalent bacterium.
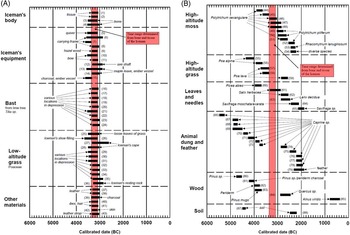
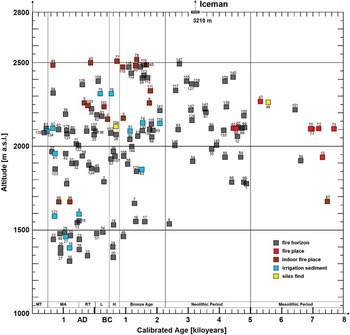
In the years following the discovery, extensive 14C measurements have been performed on material found at the Iceman site, and also from various locations above the tree line in the general environment of the Ötztal Valley indicating human presence at high altitudes since about 9000 yr (Kutschera et al. Reference Kutschera, Patzelt, Wild, Haas-Jettmar, Kofler, Lippert, Oeggl, Pak, Priller, Steier, Wahlmüller-Oeggl and Zanesco2014). For convenience, two figures from this work are reproduced here. In Figure 1, a summary of 14C measurements of various materials at the finding place of the Iceman is displayed. While some materials show strong evidence that they belonged to the Iceman, others span a large time range of several thousand years. Particularly interesting are the wood specimens at the bottom of Figure 1B, which indicate human presence at the Iceman site already 1000–2000 yr earlier. Figure 2 summarizes the 14C results for human activities in the Ötztal Alps at high altitude, spanning about 9000 yr. Early presence was essentially confined to areas above the tree line, while from the Bronze Age onwards also lower altitudes were used. This probably happened due to human impact on the tree line (intentional fires). Of interest is the clustering of human presence at the highest altitude (2500 m) during the Bronze Age (see Figure 4 below). The observations displayed in Figures 1 and 2 triggered our interest to take a closer look at glacial variations in the European Alps throughout the Holocene.
Summary of 14C dating results at the Iceman finding place (Kutschera et al. Reference Kutschera, Patzelt, Wild, Haas-Jettmar, Kofler, Lippert, Oeggl, Pak, Priller, Steier, Wahlmüller-Oeggl and Zanesco2014). The red vertical band indicates the calibrated time range (95.4% probability, see Figure 2) obtained from bone and tissue of the Iceman’s body (Bonani et al. Reference Bonani, Ivy, Niklaus, Suter, Housley, Bronk, van Klinken and Hedges1992, Reference Bonani, Ivy, Hajdas, Nicklaus and Suter1994; Hedges et al. Reference Hedges, Housley, Bronk and van Klinken1992). All additional dates are shown with filled horizontal block symbols (95.4% calibrated range). (A) Material most likely directly associated with the Iceman. (B) Material that falls outside the time range of the Iceman. The numbers in parentheses refer to the detailed 14C results listed in Tables 1 and 2 of Kutschera et al. (Reference Kutschera, Patzelt, Wild, Haas-Jettmar, Kofler, Lippert, Oeggl, Pak, Priller, Steier, Wahlmüller-Oeggl and Zanesco2014).

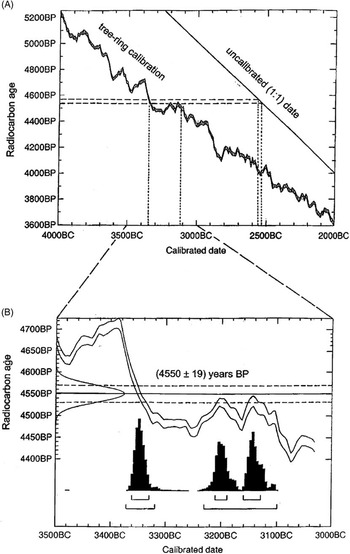
Visual presentation of the absolute age determination of the Iceman’s body as reproduced from Figure 3 of Kutschera and Müller (Reference Kutschera and Müller2003). The flat region of the calibration curve increases the uncertainty of the absolute age considerably as compared to the measured 14C content (14C age). The small brackets indicate the 68.2% probability range, whereas the large brackets span the 95.4% probability. The wiggly character of the “plateau” region leads to three separate probability distributions. Most of Iceman’s equipment falls within the range of 3500 to 3000 BC (see Figure 1A).

In general, the vegetation at high altitudes in the Alps is a sensitive proxy of temperature changes, e.g. the tree line moves by about 100 m for an average summer temperature change of 0.6 to 0.7°C (Nicolussi et al. Reference Nicolussi, Kaufmann, Patzelt, van der Plicht and Thurner2005). Another proxy of temperature change is the waxing and waning of glaciers. Precipitation at the mid-latitudes of the European Alps has probably not changed much during the Holocene (see, however, Vincent et al. Reference Vincent, Le Meur, Six and Funk2005). This, of course, may be an oversimplification of the real situation, but it is considered to be a reasonable first-order approximation to arrive at temperature changes in the past. For these studies, dendrochronology and 14C measurements of fossil wood and other organic material (e.g. fossil peat) preserved in various high-altitude archives (e.g. peat bogs, moraines, glacier ice) are performed, which allow to understand the chronology of tree-line and glacier movements. Based on such evidence, an evaluation of temperature changes during the summer months (May to September) throughout the Holocene will be presented. Such a paleoclimatic temperature record is of interest because it constitutes a natural baseline of changes before the onset of the much-debated anthropogenic influence in our time (IPCC 2013). Although it only gauges the climate change at high altitude in the Alps, it provides a relatively robust information contrasting the much more complex conditions of global climate change we face today.
RECONSTRUCTING TEMPEATURE VARIATIONS THROUGHOUT THE HOLOCENE IN THE EUROPEAN ALPS
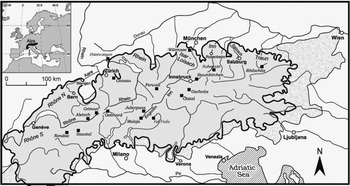
The European Alps stretch for about 1000 km from Nizza to Vienna forming a veritable mountain barrier between northern Italy and central Europe. During the Last Glacial Maximum (LGM) some 20,000 yr ago, most of the Alps and its forelands were covered with a thick layer of ice (Figure 3). After that time, the ice started to recede and by 11,500 yr ago (end of the Younger Dryas cold snap), our current interglacial warm period (Holocene) finally took off. Although the Holocene has been particularly stable with respect to large (>5°C) global temperature changes, the detailed study of glacier advances and recessions, and of movements of the tree line, revealed a number of seemingly small (~1°C) temperature variations in the Alps throughout the Holocene. These, however, can have a big impact on the environment and civilizations. The increase of human presence at lower altitudes beginning with the Bronze Age, as depicted in Figure 4, may be a consequence of the gradual decrease of the average temperature in the second half of the Holocene (cf. also Figure 7).
The extent of ice coverage (shaded area within the thick line) of the European Alps during the Last Glacial Maximum some 20,000 yr ago (Ivy-Ochs et al. Reference Ivy-Ochs, Kerschner, Reuther, Preusser, Heine, Maisch, Kubik and Schlüchter2008). The part of the Alps not covered by ice is indicated with the stippled pattern.

Summary of 14C data (squares), mainly from charcoal, found in connection with evidence for human presence at high altitude in the Ötztal Alps (Kutschera et al. Reference Kutschera, Patzelt, Wild, Haas-Jettmar, Kofler, Lippert, Oeggl, Pak, Priller, Steier, Wahlmüller-Oeggl and Zanesco2014). Note that the Iceman site (3210 m) is far above the region where humans left some clues for their extended presence. The color code in the online version of the article indicates the kind of human activity. The data cover the last 9000 yr and show a trend towards increased activities also at lower altitudes in the second half of the Holocene. The time ranges of archaeological periods are marked with thin vertical lines (MT=modern times; MA=Middle Ages; L=La Tène period; H=Hallstatt period; L+H=Iron Age). The numbers at the squares refer to the detailed 14C results of Table 3 in Kutschera et al. (Reference Kutschera, Patzelt, Wild, Haas-Jettmar, Kofler, Lippert, Oeggl, Pak, Priller, Steier, Wahlmüller-Oeggl and Zanesco2014), where also an online high-resolution figure can be found indicating the individual uncertainties of the 14C measurements.

Evidence from Glacial Movements
It is well known the Alpine glaciers are currently rapidly receding, and this may well be connected with the anthropogenic global warming described in the recent report of the Intergovernmental Panel on Climate Change (IPCC 2013). Man’s influence on Earth’s system undoubtedly exist with an accelerating pace; therefore, a new geological period following the Holocene called the “Anthropocene” was suggested by Paul Crutzen (Reference Crutzen2002), and extensively discussed recently by Waters et al. (Reference Waters, Zalasiewicz, Summerhayes, Barnosky, Poirier, Gałuszka, Cearreta, Edgeworth, Ellis, Ellis, Jeandel, Leinfelder, Mcneill, Richter, Steffen, Syvitski, Vidas, Wagreich, Williams, Zhisheng, Grinevald, Odada, Oreskes and Wolfe2016). However, it is difficult to separate anthropogenic and natural causes for climate changes. In order to get a better handle on natural variations, one can study time periods where man’s influence has likely been negligible. Except for the last few hundred years, the entire Holocene can be considered to offer such an opportunity. Concerning rapid temperature changes, it is interesting to note that high-resolution ice-core records from Greenland (Steffensen et al. Reference Steffensen, Andersen, Bigler, Clausen, Dahl-Jensen, Fischer, Goto-Azuma, Hansson, Johnsen, Jouzel, Masson-Delmotte, Popp, Rasmussen, Röthlisberger, Ruth, Stauffer, Siggaard-Andersen, Sveinbjörnsdóttir, Svensson and White2008) show temperature changes within a few years towards the end of the last Ice Age (15,500 to 11,000 yr ago).
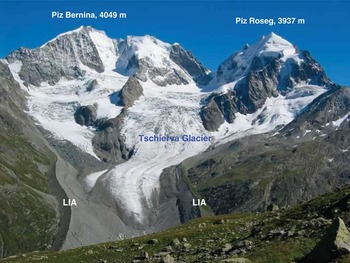
Obvious indicators of glacial movements include moraines, which are left over when the glaciers recede. An example from the Swiss Alps is shown in Figure 5, where the moraines formed during the end of the Little Ice Age (LIA) around AD 1850 are clearly seen (Joerin et al. Reference Joerin, Nicolussi, Fischer, Stocker and Schlüchter2008). Dating of the moraines can be performed via 14C measurements of buried organic material (e.g. wood). In addition, the dating of moraines and glacial bedrocks has greatly advanced by measuring in situ-produced cosmogenic nuclides with AMS (e.g. Ivy-Ochs et al. Reference Ivy-Ochs, Kerschner and Schlüchter2007). 10Be has been particularly useful to date moraines in the European Alps with high precision (e.g. Schimmelpfennig et al. Reference Schimmelpfennig, Schaefer, Akcar, Ivy-Ochs, Finkel and Schlüchter2012, Reference Schimmelpfennig, Schaefer, Akcar, Koffman, Ivy-Ochs, Schwartz, Finkel, Zimmerman and Schlüchter2014), revealing considerable glacier movements throughout the Holocene. Moraines have also been dated successfully with 10Be in the Southern Alps of New Zealand, where seven different time periods of glacial advances between ~3000 BC and ~AD 1700 (LIA) were identified (Schaefer et al. Reference Schaefer, Denton, Kaplan, Putnam, Finkel, Barrell, Andersen, Schwartz, Mackintosh, Chinn and Schlüchter2009). An interesting novel application using two in situ-produced radionuclides with different half-lives, 14C (5.70×10³ yr) and 10Be (1.39×10⁶ yr), has been applied to recently exposed bedrock of the Rhone Glacier in the Swiss Alps (Goehring et al. Reference Goehring, Schaefer, Schluechter, Lifton, Finkel, Jull, Akcar and Alley2011). From the measurement of 14C/10Be ratios, it was possible to trace the duration of exposure without ice and of burial with ice coverage, and also to obtain information on erosion depth. This revealed that the Rhone Glacier was smaller than today for most of the Holocene.
Typical glacial recession in the Swiss Alps in 2004 (Joerin et al. Reference Joerin, Nicolussi, Fischer, Stocker and Schlüchter2008). The moraines of the end of the Little Ice Age (LIA, ~AD 1850) are clearly seen.

Evidence from Dendrochronology and 14C Dating
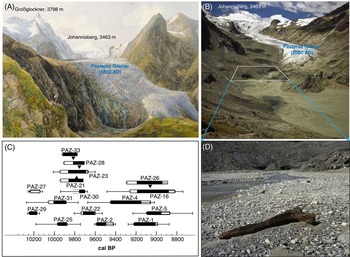
Figure 6A shows the fully advanced Pasterze glacier in the Austrian Alps towards the end of the LIA. The picture was produced in 1832 by the painter Thomas Ender (1793–1875) with “photographic” detail, as part of a project initiated by Archduke Erzherzog Johann (1782–1859) from the royal Habsburg family. The photo of Figure 6B shows the state of the glacier in the year 2000 with the reduction of ice mass typical for the post-LIA period. Today, the tongue of the glacier recedes by about 30 m per year. In Figure 6D, a log of a tree can be seen in the forefield of the glacier, which was released by the glacier. This tree and other wood specimens collected in the forefield were dated by dendrochronology and 14C (Nicolussi and Patzelt Reference Nicolussi and Patzelt2000). The results revealed surprisingly old ages between 10,000 and 9000 yr (Figure 6C). This means that during the early Holocene the formation of soil and the growth of large trees must have been possible in areas that today are still covered with ice.
(A) The Pasterze Glacier in the Austrian Alps as seen by the painter Thomas Eder in 1832. (B) Photograph of the strongly reduced Pasterze in 2000. (D) Enlarged area from B, indicated by the trapezoid and showing a log of a stone pine (Pinus cembra) found in the forefield of the glacier. (C) Age distribution of all wood specimens collected from the glacier forefield (Nicolussi and Patzelt Reference Nicolussi and Patzelt2000) by combining dendro dating (filled sections) with 14C measurements (error bars indicate 65% calibrated age ranges). The open sections depict missing inner tree-ring sections, and the hatched sections indicate compressed wood.

The receding glaciers released datable material in many places in the Alps. Extensive investigations in this respect were performed in the Swiss Alps (Hormes et al. Reference Hormes, Müller and Schlüchter2001, Reference Hormes, Beer and Schlüchter2006; Grosjean et al. Reference Grosjean, Suter, Trachsel and Wanner2007; Joerin et al. Reference Joerin, Nicolussi, Fischer, Stocker and Schlüchter2008). In the central Eastern Alps in Austria, a detailed study of the Holocene tree-line variability was performed by dendrochronological analysis of living trees and subfossil logs of stone pines (Pinus cembra, Nicolussi et al. Reference Nicolussi, Kaufmann, Patzelt, van der Plicht and Thurner2005). The age and altitude distribution of the subfossil logs indicate warmer periods than today during the first half of the Holocene. Distinct fluctuations in the temperature (δ18O) record of Greenland ice cores indicate an 8.2-ka cold snap (Alley and Agustsdottir Reference Alley and Agustsdottir2005; Thomas et al. Reference Thomas, Wolff, Mulvaney, Steffensen, Johnsen, Arrowsmith, Whited, Vaughn and Popp2007), and an earlier one at 9.3 ka (Vinther et al. Reference Vinther, Clausen, Johnsen, Rasmussen, Andersen, Buchardt, Dahl-Jensen, Seierstad, Siggaard-Andersen, Steffensen, Svensson, Olsen and Heinemeier2006). There is some indication in Figure 6C that the 9.3-ka event may have terminated the growing of trees by the advance of the Pasterze Glacier (see also Figure 7). Similarly, the 8.2-ka event may have been accompanied by the advance of glaciers, again burying trees that have been growing there during warmer periods (Figure 7). Recently, a dendrochronological study of tree remains in the forefield of the Mont Minè Glacier in the Walliser Alps (Switzerland) arrived at a calendar-dated Alpine glacier response to the 8.2-ka event (Nicolussi and Schlüchter Reference Nicolussi and Schlüchter2014).
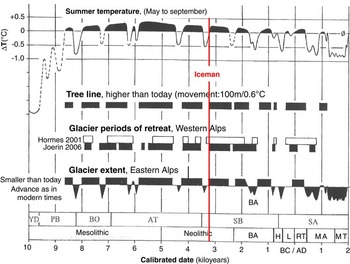
Schematic presentation of glacier and tree-line movements during the Holocene. The periods of smaller glaciers and higher tree lines are indicated with the box symbols. Glacial advances are indicated with filled triangles and curves. The largest advances took place during the Little Ice Age (~AD 1300 to 1850). The top curve depicts the relative summer temperature variations deduced mainly from the tree-line movement. The mean temperature between AD 1900 and 2000 is used as the zero-degree reference. The red vertical line marks the time of the Iceman (see Figure 1). At the bottom of the figure, the paleoclimatic periods (YD=Younger Dryas; PB=Preboreal; BO=Boreal; AT=Atlantic; SB=Subboreal; SA=Subatlantic) and the archaeological periods (BA=Bronze Age; H=Hallstatt period; L=La Tène period; L+H=Iron Age; RT=Roman times; MA=Middle Ages; MT=modern times) are indicated.

Overview of Climatic Variations during the Holocene
The information gathered from glacier and tree-line movements throughout the Holocene is summarized in Figure 7 (improved from Patzelt Reference Patzelt2014). A fairly clear time overlap between smaller glaciers and higher tree lines can be seen. As a guide to the eye, these movements are translated into the top curve describing the summer temperature variations relative to the mean temperature between AD 1900 and 2000 (zero-degree reference).
DISCUSSION
It is quite obvious from the temperature curve shown in Figure 7 that the first half of the Holocene was on the average warmer than the second half. This apparently led to glacier recessions at times far beyond what we experience now, and allowed the growth of forests in areas that are still covered with ice today (Nicolussi and Patzelt Reference Nicolussi and Patzelt2000; Hormes et al. Reference Hormes, Müller and Schlüchter2001). This temperature trend during the Holocene is also visible in the δ18O record of Greenland ice cores (Vinther et al. Reference Vinther, Clausen, Johnsen, Rasmussen, Andersen, Buchardt, Dahl-Jensen, Seierstad, Siggaard-Andersen, Steffensen, Svensson, Olsen and Heinemeier2006). It is interesting to note that the reconstruction of the global temperature variation during the Holocene shows also a similar trend as depicted in Figure 1B of Marcott et al. (Reference Marcott, Shakun, Clark and Mix2013). In the Alps as well as on a global scale, the mean temperatures started to drop right around the time of the Iceman (~5000 yr ago). One can speculate that this may have contributed to the excellent preservation of the Iceman’s body, being probably always covered by snow and ice at the high altitude of his resting place (3210 m asl). Although there is some evidence that the ice may have melted briefly in warm spells (see Figure 7) somewhere between 5300 and 2800 yr ago (Acs et al. Reference Acs, Wilhalm and Oeggl2005; Heiss and Oeggl Reference Heiss and Oeggl2009), it apparently had little effect on the excellent state of preservation of the Iceman’s body.
The detailed study of glacier advances and retreats as well as the tree-line movements indicate a number of small but significant temperature changes during the Holocene (Figure 7). Except for the last 300 yr one can assume that they are not caused by human impact. The cause of these natural variations is not well known, although it is possible that variations of the solar activity (e.g. Steinhilber et al. Reference Steinhilber, Beer and Fröhlich2009; Abreu et al. Reference Abreu, Beer, Steinhilber, Christl and Kubik2013) trigger processes that ultimately lead to the observed variations of glaciers and tree lines.
CONCLUSION
Glaciers and tree lines are sensitive proxies for gauging temperature changes in the Alpine areas. In order to correctly predict climate changes for the future, caused by both natural and human influences, one would like to understand the former better. The Holocene fluctuations of the climate proxies described in the current work offer this possibility. However, since they are only proxies, the challenge remains to understand their causes from first principles. So far, it seems that only the long-term variations of the climate observed in isotope records of ice cores (Jouzel et al. Reference Jouzel, Masson-Delmotte, Cattani, Dreyfus, Falourd, Hoffmann, Minster, Nouet, Barnola, Chappellaz, Fischer, Gallet, Johnsen, Leuenberger, Loulergue, Luethi, Oerter, Parrenin, Raisbeck, Raynaud, Schilt, Schwander, Selmo, Souchez, Spahni, Stauffer, Steffensen, Stenni, Stocker, Tison, Werner and Wolff2007) and marine sediments (Hays et al. Reference Hays, Imbrie and Shackleton1976) can be explained by a first-principle theory, i.e. the Milankovic theory of variable insolation due to the change of orbital parameters of the Earth (e.g. Broecker and Denton Reference Broecker and Denton1990). The short-term climate fluctuations during the Holocene described in the current work still await a basic understanding. Only then one can hope to make firmer predictions about the development of the climate in the future.
ACKNOWLEDGMENT
We thank the reviewers for helpful comments on various aspects of this work.