The extent to which social divisions within society are expressed politically is a long-established topic of controversy. Whereas most of the controversies over description and measurement have been resolved, many controversies over explanation remain. Why has class been such a major influence on voting behaviour in Britain? Why has the impact of class on vote declined over time? And more generally, why does its impact vary? What factors condition the political salience of social divisions? Answers to these questions have tended to fall into one of two camps: those that privilege social structural factors and those that emphasize political choice factors. The former – which dominated the early literature – tended to view political divisions as simple reflections of social conditions. This view is neatly summed up by Lazarsfeld et al., who famously wrote: ‘A person thinks politically as he is socially’.Footnote 1 According to this ‘bottom-up’ approach, changes that have occurred within the electorate over the last fifty years, such as rising living standards, the spread of affluence, social mobility and the emergence of new issues have undermined the salience of traditional group identities and made voters more individualistic.Footnote 2 Accordingly, the salience of social divisions has declined over time, and this in turn has led to a decline in class voting, which – despite rising levels of inequality – apparently signifies ‘the successful resolution by political systems of deep-seated conflicts of social interests’.Footnote 3
The problems with this account have been well documented.Footnote 4 First, on a theoretical level it is somewhat deterministic, and does not pay sufficient attention to how voters respond to the actions of political parties, or how parties themselves mobilize and appeal to different sections of society. Secondly, on an empirical level, these sociological accounts (which emphasize gradual processes of social change and individualization) fail to capture much real-world variation, and are unable to account for instances when the level of class voting increases as well as decreases. And thirdly, on a methodological level, evidence used to support this account has tended to rely on crude measures of the class-vote relationship, such as the Alford Index.
More recent accounts of class voting have emphasized the role that parties play in mobilizing social divisions and how voters respond to these mobilization strategies.Footnote 5 These studies have attempted to account for variation in the level of class voting over time with reference to supply-side changes in the nature of the political choice that parties offer voters. This ‘political choice’ approach treats the political salience of class as a response to changes in the supply side of party policies. Accordingly, as Przeworski puts it, ‘individual voting behaviour is an effect of the activities of political parties’.Footnote 6 And thus changes in the electoral significance of class reveal more about how parties have changed than about how voters have changed. This line of thought has most recently been summed up by Evans and Tilley, who argue that parties influence social divisions by differentiating themselves in ways that are relevant to the choices of voters on relevant axes of competition or, conversely, minimizing their differences on these axes so that they are less relevant to party preference.Footnote 7
According to this perspective, voters do not behave blindly, but respond to the structure of the political choice between the parties with which they are faced. Previous research has tended to examine the structure of this choice in policy terms, most commonly understood in relation to parties’ positions on left-right issues. The rationale for this dates back to Lipset et al.'s early assertion that the working class tend to prefer redistributive policies, and so they vote for parties on the left, whereas the middle class try to resist these claims and so vote for parties on the right.Footnote 8 Accordingly, if parties differ in their policy outlook on left-right issues, we would expect the salience (or strength) of the class cleavage to be stronger than if the parties stand for much the same policy outlook.
Recent empirical tests of this hypothesis have received support in a number of different contexts. Oskarson finds that class voting is higher in polarized political contests (with reference to the policy position of extremist parties) in Northern Europe and Scandinavia;Footnote 9 Elff finds evidence that social classes respond to the policy offering of political parties in six West European democracies;Footnote 10 and country-level case studies have also found policy effects on class voting in BritainFootnote 11 and Italy.Footnote 12 Collectively, these studies go some way to showing that class voting is not purely a sociological phenomenon, and that the level – or strength of class voting – varies at least partially in response to political choice factors related to policy. But these studies also leave a number of questions unanswered. For example, in the British context the policy polarization thesis helps to explain why New Labour's move to the right, and the ensuing process of policy convergence between Labour and the Conservatives, led to a decline of class voting in the 1990s, but this approach does not shed light on why class voting was so strong in the 1960s and 1970s, when there was also little ideological difference between the two main parties. This suggests that there may be other factors at play that condition the relative strength of social cleavages.
In this article I build on these insights and examine the structure of political choice from a more sociological perspective, linking the early sociological accounts of class voting and the more recent instrumentalist accounts of policy voting. A key element of the political choice literature on class voting is the link between class position, class interests and policy preferences. Accordingly, voters’ perceptions of their interests are shaped by their class position, which in turn means that different social classes prefer different redistributive political programmes. The extent to which the working class feel that their interests are represented by a political party therefore depend on the party's policy platform. But policy representation is of course only one form of political representation, and it may be that voters are also responsive to other aspects of political representation, which hitherto have not been considered. In exploring this possibility, I draw a distinction between political choice based on policy or ‘substantive’ representation and political choice based on social or ‘descriptive’ representation.
A useful starting point for thinking about this is Hanna Pitkin's well-established typology of representation, which distinguishes between substantive and descriptive representation.Footnote 13 Pitkin describes substantive representation as ‘acting in the interests of the represented in a manner responsive to them’. Thus the working class may be substantively represented by a particular political party when that party advocates public policy that is in the interests of the working class. This is typically understood in terms of left-wing policies, for reasons outlined above. By contrast, descriptive representation occurs when representatives mirror the social backgrounds of the represented. Thus the working class may be descriptively represented by a political party when the members of parliament (MPs) from that party are themselves from working-class backgrounds.
Whereas the descriptive representation of women and ethnic minorities has increased in Britain over the last few years, the representation of other social groups, particularly the working classes, has declined.Footnote 14 This was bought into sharp focus following the 2010 British general election, when the coalition cabinet was almost entirely composed of millionaires (who occupied twenty-three out of the twenty-nine posts). The cabinet contained more (rich) ethnic minorities and women than it did people from working-class backgrounds. Although there is a great deal of research on the changing composition of political elites, we still know relatively little about how these changes have affected how citizens orientate themselves toward politicians and parties, and the impact of these changes on individual-level patterns of voting behaviour. In this article I examine the impact of policy representation and social representation on the extent to which social classes support different political parties. Do voters respond to social cues as well as political cues? What impact, if any, have changes in the social background of political representatives in Britain had on how voters participate in the political process?
How does Social Representation Matter?
Discussion on social representation in political science has tended to focus on whether politicians will enact policies that are beneficial to other members of their social group in the population as a whole. Do female MPs ‘better represent’ women's issues than men? Do ethnic minority MPs better represent ethnic minority issues? And do working-class MPs better represent the issues of working-class people? Research on these questions has tended to produce mixed results, and there is ongoing academic debate as to whether descriptive representation leads to substantive (policy) representation.Footnote 15 The arguments for why it might do so have a certain intuitive appeal. MPs from privileged backgrounds may be ‘less in touch with the mass electorate’ and less in touch with working-class voters. Working-class MPs may also be more likely than upper-class MPs to put forward or support left-wing policies; it may therefore be harder for the leadership of a left-wing party to change party policy and move to the right when there are many working-class MPs within the party who would potentially resist such a move. Indeed, it is notable that Neil Kinnock's attempt to modernize the Labour Party in Britain in the 1980s began with reforming the rules on candidate selection rather than with a drastic overhaul of policy.
Although there is a certain amount of controversy over whether there is in fact a link between descriptive and substantive representation, there is much stronger evidence to suggest that the public believe such a link exists. And when it comes to the determinants of voting behaviour, the public perception that this link exists may carry more weight than whether or not the link actually exists in practice. For example, there is a growing body of work that shows, at least as far as voters are concerned, that descriptive (or social representation) matters; all else being equal, people with a given social characteristic prefer candidates or leaders who share that characteristic: women are more likely than men to vote for female candidates,Footnote 16 and black people are more likely than white people to vote for black candidates.Footnote 17 More generally, socio-demographic dissimilarity with a political figure (for example, a party leader) tends to decrease a voter's expected utility from electing that person.Footnote 18
One explanation for this process is that the public use the social background of politicians as a heuristic shortcut for making judgements about what sort of policies the party will pursue. Gathering information on candidates’ and parties’ policy positions and coming up with an opinion of one's own is obviously a more costly activity than observing the social characteristics of candidates and party leaders.Footnote 19 And whereas voters might be uncertain about what policies, for example, the British prime minister, David Cameron, really wants to pursue based on what he says in public, voters might draw much firmer inferences based on his privileged social background and Eton upbringing, and assume that whatever policies he does pursue will be in the interests of the rich. According to Popkin, then, ‘demographic facts provide a low-information shortcut to estimating a candidate's policy preferences … characteristics such as a candidate's race, ethnicity, religion, gender, and local ties are important cues because the voter observes the relationship between these traits and real-life behavior as part of his daily experience’.Footnote 20 Similarly, Johnston et al. argue that ‘it is entirely reasonable to ask how much like oneself the potential agent is. The more an agent resembles oneself the more he or she might be expected reflexively to understand and act on one's own interests … we might reasonably prefer leaders who embody our own demographic characteristics’.Footnote 21
Indeed, the idea that social similarity effects judgements and behaviour has a long history in the social psychology literature. For example, as far back as 1958 Heider argued that interpersonal similarity, be it similarity in attitudes, personality characteristics or social background variables, promotes a sense of ‘belongingness’, or closeness.Footnote 22 More recent research has found that people tend to like similar others more than dissimilar ones,Footnote 23 and are typically more emotionally invested in close than distant others.Footnote 24 Interpersonal similarity also has important implications for information processing. Liviatan et al. show that people construct different representations of similar and dissimilar individuals even when they are provided with the same information about those individuals.Footnote 25 These representations, in turn, affect people's judgements about similar and dissimilar others’ actions. For example, Rim, Uleman and Trope show that students are more likely to draw the trait inference of ‘rude’ if a disruptive audience member is from a different university (that is, is socially distant) than if he is from the same university (that is, is socially proximal).Footnote 26
This body of work implies that people are more receptive to information from similar rather than dissimilar individuals. From this we might expect that if a politician is socially similar to a voter (that is, from the same class background), then the voter will be more likely to ascribe positive attributes to what the politician is saying, and be more likely to believe what they are saying and think they are sincere. To a working-class voter, it may therefore be more credible when a politician from a strong working-class background says that he or she will stand up for the underprivileged than when a multimillionaire member of the aristocracy says the same thing. Thus if a party contains many working-class MPs, working-class voters may be more likely to think it represents and stands up for their interests. This suggests that the greater the proportion of MPs from working-class backgrounds in a party, the more the electorate will perceive that party as representing the interests of the working class, and the more likely the working class will be to vote for it. Thus the social background of MPs influences party image, which in turn influences voting behaviour.
Hypotheses
To investigate these claims I test a number of hypotheses. Recent research has shown that the strength of the class-party association in the UK is associated with policy differences between the two major parties.Footnote 27 Thus I first simply aim to replicate this finding using an independent data source, and examine whether there is a link between class voting and policy representation on left-right issues. As Evans and Tilley state, ‘Party polarization should increase the magnitude of the association between social position and party choice; party convergence should reduce it. When there is ideological convergence the strength of the signals from parties to voters is weakened and the motivation for choosing parties on interest/ideological grounds derived from class position is reduced, and vice versa’.Footnote 28 Accordingly, class voting is shaped by variations in the policy representation of left-right issues between the parties.
Hypothesis 1: The strength of the class-party association is associated with the policy difference on left-right ideology of the two main parties.
The second hypothesis that I test refers to the extent to which class voting is related to social representation, and the cues that parties send voters by selecting MPs from different social backgrounds. When the parties are socially distinctive in terms of the class backgrounds of their MPs, the motivation for choosing parties on class grounds is increased, and vice versa. Thus class voting is shaped by variations in the social representation of the working class between the parties.
Hypothesis 2: The strength of the class-party association is associated with the social differences in class background of MPs from the two main parties.
The third hypothesis examines the nature of the joint impact of policy and social representation on class voting. If there is a link between social and policy representation, then voters may only pay attention to policy signals insofar as they come from credible social sources. It may be that it is more important to have people who are ‘like you’ in parliament than it is to have people who claim to speak on your behalf. Indeed, given the potential association between social representation and policy representation at the party level, the apparent association between policy representation and class voting may be driven by variations in social representation, in which case we would expect the impact of policy difference on class voting to be mediated by the impact of the social difference between the parties.
Hypothesis 3: The relationship between class voting and policy is weakened by controlling for the social background of MPs.
Data and Methods
To test these hypotheses I analyse a merged dataset, which combines information on voters, parties’ policy positions and the occupational background of MPs. The data comes from three sources. First, to examine the social characteristics and voting behaviour of individuals over time, I use pooled cross-sectional survey data from the British Election Studies, 1964–2010.Footnote 29 This series covers thirteen elections and consists of 35,597 interviews. Secondly, to examine policy representation and the policy platforms of the political parties over time, I use party manifesto data from the Manifesto Research Group.Footnote 30 And thirdly, to examine social representation and the occupational background of MPs, I use data from the Datacube project collated by the EurElite network.Footnote 31
The dependent variable is recall of vote choice in the last general election. In the British context, the main class divide has been between the Labour party and the Conservative party, so I focus on these parties. To measure the key independent variable, social class, I use a simplified version of the Erikson-Goldthorpe seven-class schema, which categories people according to their occupation.Footnote 32 Because of concerns over sample size and how well the skilled and semi-skilled categories are distinguished, the higher and lower professional categories and the working-class categories are collapsed. However, the categories that are collapsed are not strongly distinguishable with respect to their pattern of party choice. Respondents are therefore divided into four class categories: salariat (professional and managerial workers), petty bourgeois (self-employed, small businessmen and farmers), routine non-manual, and manual workers (including supervisors/foremen and skilled and unskilled workers).
Following previous research, policy positions are estimated using party manifesto data,Footnote 33 which provide a useful indication of party positions since they represent the electorate's choices before each election. Moreover, as the content of party programmes is often the result of intense intraparty debate, the Comparative Manifesto Project (CMP) estimates should be reliable and accurate statements about parties’ positions at the time of elections. These measures are generally consistent with those from other party positioning studies, such as those based on expert placements, citizen perceptions of parties’ positions and parliamentary voting analyses, which provides additional confidence in the validity and reliability of these estimates.Footnote 34 The CMP measures are based on content analyses of main political parties’ programmes at every post-war election. The policy statements in each (‘quasi-’) sentence are classified into fifty-six policy categories over seven policy domains. Following the traditional Laver/Budge methodology, the left-right scores of the various parties can be computed by summing up the percentages of all the sentences in the left category and subtracting their total from the sum of the percentages of the sentences in the right category. The policy difference between the parties is simply the difference between these two scores.
To measure the social representation of the working class, I use data from the Datacube project collected by the EurElite network. The Datacube is a major study of political representatives in Europe and contains information on the demographic background of elected representatives since 1850.Footnote 35 The data come from a variety of sources; the more recent data on Britain used in this article (1964–2010) is drawn from the Nuffield Election Series.Footnote 36 The occupational backgrounds of MPs are classified into eleven distinct categories. The working-class composition of the main political parties is calculated as the proportion of MPs in each party that is from a working-class background (including supervisors/foremen and skilled and unskilled workers). The social difference between the parties is simply the difference between these two scores.
Changing Pattern of Class Voting in Britain
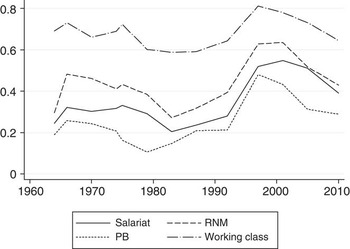
The first task is to examine the association between class and vote choice in Britain over time. Figure 1 displays the probability of voting Labour rather than Conservative for each social class since the 1960s. The pattern is now well known, and has been well documented elsewhere.Footnote 37 The impact of class on vote has declined over the last fifty years, as can be seen by the narrowing of the gap between the lines in Figure 1. The probability gap between the salariat and the working class voting Labour rather than Conservative has declined from over 0.4 in the 1960s to just 0.1 in the 2000s. The gaps between the other middle classes (routine non-manual and petty bourgeois) and the working class follow similar, though somewhat less pronounced, trends. However, the pattern is not one of steady decline. During the early period there is little evidence of class dealignment, and the pattern appears to be one of ‘trendless fluctuation’,Footnote 38 but since the 1980s there seems to have been a distinct convergence between the classes, a pattern that is often attributed, at least since the 1990s, to New Labour's ideological repositioning.
Probability of voting Labour vs. Conservative by class, 1964–2010. Source: BES 1964–2010

Changing Party Positions on Left-Right Ideology
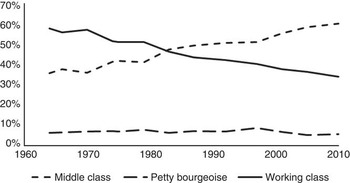
It is often claimed that the Labour party moved to the centre of the ideological spectrum in response to the changing social composition of the electorate and the shrinking of its core support base in the manual sector. From Figure 2 we can clearly see that the size of the working-class population has steadily declined since the 1960s, while the size of the middle-class population has steadily increased. Since the early 1980s the middle classes have overtaken the working classes in terms of size, and since 1987 the middle classes have comprised more than 50 per cent of the electorate. These demographic changes would appear to provide a clear incentive to the Labour party to broaden its appeal among middle-class voters – particularly, one would think, since the middle class overtook the working class as the largest occupational group in the electorate.
Class composition of British electorate, 1964–2010. Source: BES 1964–2010

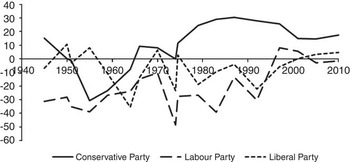
However, there is little evidence to support this claim. Whereas the size of the working class has steadily shrunk over the last fifty years, there has not been a corresponding shift toward the right by the Labour party. Figure 3 shows how the main parties in Britain have shifted their left-right policy positions over the last half-century. During the first part of the period there was little difference between the Conservative and Labour positions, but – somewhat contrary to the expectations of the strategic incentives hypothesis – during the 1970s the Labour party moved substantially to the left and stayed there for the best part of twenty years. During this period there were thus clear ideological differences between the two parties. Since 1992, and in particular since 1994 when Tony Blair took over the leadership of the party, there has been a process of policy convergence, with the Labour party moving towards the centre ground and the Conservatives moving somewhat to the left.
Left-right positions of parties, 1950–2010. Source: Manifesto Research Group

Comparing Figures 1–3 suggests that there may be a number of inconsistencies with conventional accounts of the relationship between policy representation and class voting, and with the relationship between social change and policy representation. First, during the high-water mark of class voting during the 1960s there was little policy difference between the parties, and during the period of ideological polarization during the 1980s there was little evidence of any increase in class voting. As Evans has pointed out, it is only really in the latter period that class voting and ideological polarization appear to co-vary.Footnote 39 Secondly, although there has been a steady decline in the size of the working-class electorate, there has not been a correspondingly steady move to the right by the Labour party, and at times the Labour party has moved in the opposite ideological direction to the strategic incentives suggested by social change. Although this does not directly undermine the ‘political choice’ perspective, it does cast doubt on one of the key intervening variables that is thought to link social change and class dealignment, which relates to how parties have responded to changes in the social structural composition of the electorate.Footnote 40 So although the top-down ‘political choice’ approach makes some significant advances over previous, more sociological accounts of class voting, it also leaves a number of questions unanswered, and suggests that there is perhaps space for further research on the topic.
Changing Party Representation of Working-Class MPs
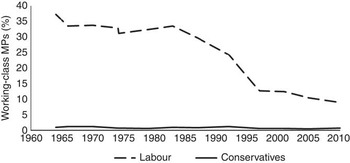
The next task, then, is to consider social representation and examine how the social representation of the working class within the two main parties has changed over time. If the proportion of working-class MPs within the Labour party has declined over time, then the social signals that the party sends voters about what group the party represents will also have become weaker, leading to a hypothesized decline in class voting. Figure 4 depicts the changes that have taken place in the social background of Labour and Conservative MPs over the last fifty years. Although never high compared to the proportion of the working class in the population, the number of MPs with a background in manual work has fallen dramatically. In 1964, 20 per cent of MPs had a working-class occupational background, but by 2010 just 5 per cent had such a background. This decline is almost entirely due to changes that have occurred within the Labour party, which was traditionally expected to represent working-class people. In 1964, Labour was not just a party for the working class, but was also substantially comprised of the working class, with over 37 per cent of MPs coming from manual occupational backgrounds. By 2010 this fell to just under 10 per cent.
Working-class MPs in Britain, 1964–2010. Source: Datacube

The decline in the proportion of working-class Labour MPs started in the 1980s, and continued during Labour's long march to the centre instigated by Neil Kinnock. This sequencing appears to fit with the strategic incentives offered by changes in the social composition of the electorate, and although there is not much evidence to suggest that Labour moved to the right as the size of the working-class population in the electorate declined, there is much clearer evidence to suggest that as the electorate became more middle class so did the party representatives.
One obvious consideration is therefore to what extent variations in the social representation of the working class in political parties is actually a cause (rather than a response) to class voting. The core hypothesis in this article is that differences in social representation between the parties have a causal impact on how voters from different social backgrounds relate to the parties, and are thus associated with variations in the level of class voting over time. However, an alternative causal narrative might be that as society has become more middle class, people have become less likely to vote for working-class politicians, and so consequently fewer working-class politicians get elected to office. In this case, social representation cannot meaningfully be seen as a cause of class voting, since it is itself a product of class voting. I will return to this point later in the article. However, a number of factors indicate that such an interpretation is faulty, and that the changes we observe in the social composition of MPs have not been driven by ‘bottom-up’ factors related to citizens’ voting behaviour but instead by ‘top-down’ strategic decisions made by party leaders. First, it is notable that following the heavy election defeats of 1979 and 1983, the proportion of working-class Labour MPs did not fall. It does not therefore appear to be the case that there was an electoral backlash against working-class MPs. It is only during the long march back to electability that the social profile of Labour MPs (and candidates) began to change, and the greatest changes in the social profile of Labour MPs followed the big electoral gains of 1992 and 1997, when the party put forward many more middle-class candidates.
These changes in candidate selection can be traced to institutional changes that were implemented by Kinnock in a bid to modernize the Labour party during the 1980s. During this period, the Labour party reformed its selection process for parliamentary candidates in order to counter the impression that it was dominated by union interests. In the case of the electoral college, this meant banishing union leaders from the selection process. These institutional changes had a significant impact on candidate selection. Without the influence of the unions, and in a bid to distance the party from the working-class radicalism that the unions were associated with, more and more middle-class candidates were put forward.Footnote 41 The effect of this process can be illustrated with reference to Pippa Norris’ 1992 and 1997 candidate studies,Footnote 42 which show that the new Labour candidates were much less likely to think of themselves as working class than the incumbent MPs who were standing for re-election. In 1992, 58 per cent of incumbent candidates thought of themselves as working class, compared to just 45 per cent of the new candidates; in 1997, 37 per cent of incumbent candidates thought of themselves as working class compared to just 20 per cent of new candidates. Evidently, the new candidates who were selected to stand tended to identify less with the working class than the incumbent candidates, and the changes that took place in the social background of Labour MPs were therefore driven by the party's strategic choices about candidate selection rather than by bottom-up processes to do with citizens’ voting behaviour. Moreover, even if these strategic choices may have been informed by social change, they are exogenous to the relative impact of class on vote.
The result of these changes in recruitment has been a parliament with many fewer voices able to speak from working-class experience, particularly on the Labour side of the House. Such changes in MPs’ occupational backgrounds have made parliament much less representative of the broader British population, and the Labour party much less representative of the working class whose interests it was traditionally supposed to represent. Parties in contemporary Britain have thus become ideologically and socially less distinctive. Whereas the former has received a great deal of attention, both within the literature on class voting and more broadly, the latter has not. In the next part of the article I redress this balance and investigate the extent to which the electorate responds to both social and policy cues.
Class Voting and Social and Political Representation
To test the hypotheses I link data on policy representation and social representation to pooled cross-sectional survey data, creating a hierarchical dataset in which individuals are nested within elections. I therefore specify a multilevel logit model to estimate how the class-party association varies according to the structure of political choice. At level 1 is the individual survey respondent, and at level 2 is the election. The general model is specified as follows:
 $$\displaylines{ & VOT{{E}_{}}\, = \,f({{\beta }_0}\, + \,{{\beta }_1}Clas{{s}_{ij}}\, + \,{{\beta }_2}POLDI{{F}_j}\, + \,{{\beta }_3}Clas{{s}_{ij}}\,\ast\,POLDI{{F}_j}\, + \,{{\beta }_4}SOCDI{{F}_j} \cr & \, + \,{{\beta }_5}Clas{{s}_{ij}}\,\ast\,SOCDI{{F}_j}), \cr}$$
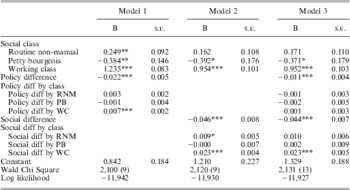
where VOTE is party support (1 = Labour; 0 = Conservative) at election t, β 0 is the constant, Class is the occupational background of the voter, POLDIF is the policy difference between the two main parties, Class × POLDIF is a cross-level interaction between class and policy difference, SOCDIF is the social difference between the two main parties, and Class x SOCDIF is a cross-level interaction between class and social difference. Controls are also included for basic demographics. In order to model the extent to which social classes differ in their voting behaviour, I do not control for any attitudinal variables that may be endogenous to class at the individual level or policy difference and social difference at the party level, such as leadership evaluations, the economy or party identification.Footnote 43 Three different models are specified, which test the impact of (1) policy representation on class voting, (2) social representation on class voting and (3) the joint impact of policy and social representation on class voting. The relevant parameter estimates from these models are reported in Table 1.Footnote 44
Multilevel Logistic Regression Models Predicting Labour vs. Conservative Vote

Note: reference category is salariat. Models also control for age and sex. All models contain thirteen surveys and 19,307 individuals. *p < 0.05; **p < 0.01; ***p < 0.005.
To test Hypothesis 1, Model 1 tests the impact of policy representation on class voting. The policy difference term is highly significant and negative, which indicates that people tend to be less likely to vote Labour when there are large ideological differences between the two parties. This is certainly consistent with the view that Labour's move to the centre made the party more electable. The coefficient for the working-class term is positive and also highly significant, indicating that even when we control for policy difference between the parties, people from the working class are significantly more likely to vote Labour than people from the salariat. In order to examine the impact of policy representation on the level of class voting, an interaction term is specified between policy difference and social class. With respect to the working class, this has a significant effect in the expected direction. Working-class people are significantly more likely than middle-class people to vote Labour when there are substantial policy differences between the two parties than when there is little policy difference. The extent of class voting therefore appears to respond to policy signals. For example, Model 1 predicts that the difference between someone from the salariat voting Labour and someone from the working class doing so would be about 39 percentage points if there is a high level of policy difference between the parties (a CMP difference of 70, compared to the 1983 value of 68), but only 22 percentage points if there is a much lower level of policy difference between the parties (a CMP difference of 10, compared to the 2001 value of 9). The model therefore supports Hypothesis 1 and replicates the findings of earlier research, which suggests that the magnitude of the effect of class on vote depends on the ideological difference between the two main parties.
To test Hypothesis 2, Model 2 assesses the impact of social representation on class voting. We can see that the social difference term is significant and negative, indicating that people tend to be less likely to vote Labour when there are large social differences between the representation of working-class MPs within the two main parties. This finding is also consistent with the view that the social transformation of the Labour party into a more middle-class body of MPs has made the party more electable. More interesting from a theoretical perspective, though, is that the interaction term between social difference and class is highly significant and in the expected direction. Working-class people are significantly more likely than middle-class people to vote Labour when there are substantial social differences between the two parties than when there is little social difference. Class voting therefore appears to respond to the social signals that parties send voters by having MPs from different social backgrounds. For example, Model 2 predicts that the difference between a person from the salariat and the working class voting for Labour is 42 percentage points if there is a high level of social difference between the parties (a difference of 40, compared to the 1964 value of 36), but only 25 percentage points if there is a much lower level of social difference between the parties (a difference of 10, compared to the 2010 value of 8). The model therefore provides support for Hypothesis 2, and suggests that the effects of class on vote may depend on the social difference between the parties. Comparing the fit statistics between the two models, we can see that the social representation model provides a better fit to the data than the policy representation model. This suggests that class voting may respond more to the social signals that parties send voters than the policy signals.
Model 3 examines this possibility more systematically by testing the policy representation and social representation hypotheses simultaneously. As in previous models, the main effects of both the policy difference and social difference terms are significant and in the expected direction. However, this time the interaction term with class is only significant with respect to social representation, and the interaction between class and policy difference is not significant. The magnitude of the interaction term between policy difference and the working class declines from a significant b = 0.007 in Model 1 to a nonsignificant b = 0.001 in Model 3. By contrast, the magnitude of the coefficient for the interaction term between social difference and working class is unchanged at b = 0.023 between Models 2 and 3. These findings show that once we take social representation into account, the strength of the class-vote association does not vary by policy representation. Voters may pay attention to policy signals in so far as they are consistent with the social signals that parties send voters, but there do not appear to be any additional effects of policy representation on class voting beyond those that are transmitted via social representation. This suggests that social representation not only drives the class-vote relationship, but also drives the association between policy difference and class voting.
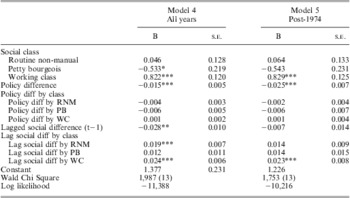
As mentioned earlier, an obvious consideration is to what extent variations in social representation are actually a cause of (rather than a response to) class voting. An alternative causal narrative could be that parties have become more middle class in response to the diminishing importance of class on vote. Thus, as the political salience of class has declined, left-wing parties have become more middle class in a bid to appeal to more middle-class voters. However, if there is evidence that class voting responds to parties’ level of social representation from the previous electoral period, then this helps to rule out this possibility. On this point, there is strong evidence of temporal effects in the expected direction, and the class interactions with the lag variable of social representation (t−1) are highly significant (Table 2, Model 4). These estimates signify a process in which voters are responding to parties’ social differences rather than the other way around. These results stand up even if we restrict the sample to just the post-1974 period,Footnote 45 which is when Evans and Tilley argue voters became more responsive to policy cues (Model 5).Footnote 46
Multilevel Logistic Regression Models Predicting Labour vs. Conservative Vote

Note: reference category is salariat. Models also control for age and sex. Model 4 contains twelve surveys and 18,412 individuals. Model 5 is restricted to the post-1974 period and contains ten surveys and 16,515 individuals. *p < 0.05; **p < 0.01; ***p < 0.005.
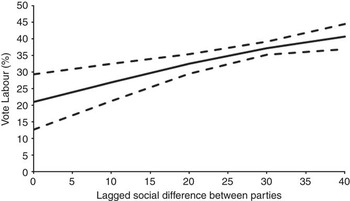
We can get a clearer sense of the substantive impact of these findings by plotting the average marginal effects from the interaction between the lag of social difference and class. Figure 5 plots the difference that we would predict between a working-class voter and a middle-class voter casting their ballot for the Labour party at different levels of social difference between the two main parties. When the parties are socially similar, Model 4 predicts that the difference in Labour support between working-class people and middle-class people is just over 20 percentage points. This suggests that the model is unable to explain some persistent class differences. Thus we cannot completely reduce class voting to the social difference between parties. However, class differences become much more pronounced as the level of social difference between the parties increases. When the parties are socially distinctive (to a level similar to 1964), the difference in Labour support between working-class and middle-class people almost doubles to 41 percentage points. The baseline difference in support for Labour between the working class and the middle class is substantial, yet if the parties are socially distinctive, the model predicts that the effect of class on vote substantially increases. Social representation clearly matters to people's party choices.
Predicted difference between voting Labour for working-class people compared to middle-class people by level of social difference between the parties. Note: these are predicted probabilities from Model 4 of Table 2, and refer to the difference in percentage points between working-class and middle-class people voting Labour.

These results indicate that there is a strong over-time relationship between social representation and class voting. But if the social cues thesis is correct, there is no reason why there should not also be a cross-sectional relationship between social representation and class voting, whereby class voting is stronger in constituencies that have clear social differences between the two main parties (that is, when the Labour candidate is from a working-class background). To investigate this possibility, I link data from the 2001 British Representation Survey to the 2001 British Election Survey.Footnote 47 I specify a multilevel logit model with individuals nested in constituencies to estimate how the class-party association varies according to the occupational background of the Labour candidate. The general model is specified as follows:
 $$VOTE\, = \,f({{\beta }_0}\, + \,{{\beta }_1}Clas{{s}_{ij}}\, + \,{{\beta }_2}LABCLAS{{S}_j}\, + \,{{\beta }_3}Clas{{s}_{ij}}\,\ast\,LABCLAS{{S}_j})$$
where VOTE is party support (1 = Labour; 0 = Conservative), β 0 is the constant, Class is the occupational background of the voter, LABCLASS is the occupational background of the Labour candidate, and Class x LABCLASS is a cross-level interaction between the voter's class and the Labour candidate's class. Controls are also included for age, sex, education and religion at the individual level, and economic deprivation at the constituency level. Three different models are specified, which examine the impact of a candidate's class on class voting (1) across all seats, (2) across seats where the Labour candidate is a challenger and (3) across seats where the Labour candidate is the incumbent.
The relevant parameter estimates from these models are reported in Table 3. Across all three models we can see that the sign for the class coefficient of the Labour candidate is negative, indicating that people are less likely to vote Labour when the candidate is working class, controlling for the level of economic deprivation in the constituency. This is particularly evident when the Labour candidate is also the sitting MP (Model 3), which is consistent with the findings from the earlier models presented above.
Multilevel Logistic Regression Models Predicting Labour vs. Conservative Vote, 2001

Note: reference category is middle class. Due to the small sample size, the salariat and petty bourgeoisie categories have been merged. Models also control for age, sex, education and religion. *p < 0.05; **p < 0.01; ***p < 0.005.
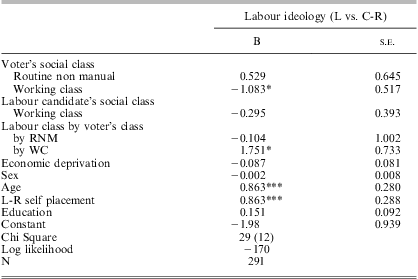
Across all three models we can also see that the interaction term between the voter's social class and the candidate's social class is in the expected direction. Given the relatively small sample sizes, we have to be a little cautious in our interpretation of the results, but nonetheless the evidence is broadly supportive of the idea that working-class voters tend to be relatively more likely than the middle class to vote Labour when the Labour candidate is also working class.Footnote 48 Interestingly, the magnitude of the coefficient for this interaction term is over four times larger when the Labour candidate is the sitting MP than when he or she is a challenger. This suggests that it is the class background of MPs rather than candidates per se that matters most. Thus, in addition to shedding light on the over-time dynamics in the strength of class voting, the social representation thesis also appears to highlight variation in the strength of class voting across constituencies. Moreover, there is also evidence to show that the way the party looks matters to voters, and that the class background of the Labour candidate influences the party's image.Footnote 49 From Table 4 we can see from the cross-level interaction that working-class voters are more likely to regard Labour as being left wing when they have a working-class MP in their constituency. Based on the average marginal effects, the model predicts that among the salariat, 38 per cent think Labour is a left-wing party when the incumbent is middle class compared to 33 per cent when the incumbent is working class, and that among the working class, just 16 per cent think Labour is a left-wing party when the sitting MP is middle class compared to 42 per cent when the sitting MP is middle class. Thus, working-class voters are more likely to think that the Labour party is left wing and stands for traditional working-class policy interests when their local MP is from a working-class rather than a middle-class background.Footnote 50 As far as the working class are concerned, then, there is indeed a perceived link between descriptive and substantive representation.
Multilevel Logistic Regression Models Predicting Labour Party Image, 2001

Note: reference category is middle class. Due to the small sample size, the salariat and petty bourgeoisie categories have been merged. *p < 0.05; ***p < 0.005.
Conclusion
Recent research on class voting has emphasized the ways in which parties shape social divisions. The ‘old orthodoxy’ that the influence of class on vote has declined because social change has weakened the distinctiveness of social classes has been firmly rejected,Footnote 51 and the new wave of political choice literature instead relates dynamics in class voting over time to variations in parties’ policy platforms.Footnote 52 In short, without party strategy that emphasizes class differences in interests, class position is less likely to be strongly associated with party choice.
In this contribution I have sought to build on many of the insights from this emerging literature, and to broaden the discussion of political choice to consider other ways in which parties may represent (or be seen to represent) the interests of different social groups. By focusing on the distinction between policy representation and social representation, I find much stronger evidence for social representation effects on class voting. This shows that the social cues that parties send to voters matter, and that voters are perhaps not as instrumental or individualistic in their voting decisions as is sometimes portrayed in the policy representation literature. Indeed, in some ways the concept of social or descriptive representation is much closer to the original principle of group voting that underpins the idea of social cleavages. If class voting were based solely – or even mainly – on policy, then the phenomenon could perhaps more accurately be described as issue voting rather than cleavage voting. Whereas policy representation implies an individualistic and instrumental calculus (which may be aggregated to the group level), social representation implies a more group orientated and expressive calculus, which explicitly engages with social identity theory and social distance theory. Voters may think that people from their own social group will be more likely to represent their interests, but there is also potentially an expressive dimension to this calculus; the simple presence of people from one's own social group in a position of political power might make voters feel closer to the party in question, and better represented by it. Indeed, there is plenty of evidence from the social psychology literature to suggest that such mechanisms might exist, which could be explored further.
Thus focusing on issues of social representation not only makes an empirical contribution to the study of class voting and the politicization of social divisions more generally, but also provides a clear link to the theory of social cleavages, which emphasizes the importance of group membership. In doing so, this approach also provides a coherent narrative of class voting in Britain over time; we can draw a link between social change, party strategy and voting behaviour. One implication of this research is that the social composition of parliament matters. It influences how people participate in the political process, and might also influence how people view politics and engage in politics more widely. This suggests that there may be empirical as well as normative implications to the ongoing debate about the social representativeness of political representatives. Recent concerns about the extent to which MPs are socially representative of the wider population – in terms of class, age, sex, region and ethnicity – may have serious implications for how people from different backgrounds relate to politics.